 Theoretical Economics Letters, 2013, 3, 328-339 Published Online December 2013 (http://www.scirp.org/journal/tel) http://dx.doi.org/10.4236/tel.2013.36055 Open Access TEL Health and Household Income in Vietnam Cuong Tat Do1*, Anh Ngoc Thi Ngo2 1Division of Public Policy Analysis, Institution of Economics, National Academy of Administration and Politics, Hanoi, Vietnam 2Division of Economic Management, Institution of Economics, National Academy of Administration and Politics, Hanoi, Vietnam Email: *dotatcuong@gmail.com, ngongocanhqlkt@yahoo.com Received September 29, 2013; revised October 29, 2013; accepted November 6, 2013 Copyright © 2013 Cuong Tat Do, Anh Ngoc Thi Ngo. This is an open access article distributed under the Creative Commons Attri- bution License, which permits unrestricted use, distribution, and reproduction in any medium, provided the original work is properly cited. In accordance of the Creative Commons Attribution License all Copyrights © 2013 are reserved for SCIRP and the owner of the intellectual property Cuong Tat Do, Anh Ngoc Thi Ngo. All Copyright © 2013 are guarded by law and by SCIRP as a guardian. ABSTRACT This study provides empirical evidence regarding to the relationship between household income and individual health, as well as the correlation between health and education at provincial level. We apply the concept of human health capi- tal theory into models which treat health as a form of human capital in income process and education progress. We em- ploy two datasets, one is Vietnam Household Living Standard Survey wave in 2002, 2004 and 2006, and the other is the dataset for provincial level in the year 1999, 2002 and 2004, in order to make two panels. Constructing panels allow us to exploit “within” variation in health, income and education to figure out the possible unobservable biased estimates of the impact of health on income and education on health in a short period of panel data. Household income is signifi- cantly affected by individual health and life expectancy is considerably influenced by education. These findings could be seen as evidence for policy makers in health and education policy in the context of development planning. Keywords: Household Income; Individual Health; Life Expectancy; Illiterate Rate; Vietnam; VHLSS 1. Introduction Since the mid of 1980s, Vietnam has experienced a trans- formation from central planning economy to market- oriented economy. This process has been demonstrated by a significant growth of income per capita and the re- duction of poverty [1]. In nearly three decades, Viet- namese economy has become a member of middle in- come league from a low developed country1. There are a number of factors that can be seen as critical determi- nants of rapid growth. Researchers usually claim rapid growth as a result of employing effectively conventional factors such as physical capital, educational human capi- tal, trade liberalization, technology and technical diffu- sion. To my best knowledge, however, there is a lack of study on the role of health human capital, which is usu- ally shown as a critical determinant of labor’s productiv- ity, on agricultural households’ income. This paper investigates the determinant of individual health capital on households’ income in the production process. The theoretical framework of the paper is based on the several prominent theories [2-4]. Additionally, empirical tasks have been done with Vietnamese House- holds Living Standard Survey (here after VHLSS) where the relationship between individual health capital and agricultural households’ income can be tested, and the panel data are at provincial level. The development of estimation of the relationship be- tween health and income has been transformed consid- erably. The relationship was claimed from the income to health, which means that richer people will invest more in health, from health to income, which means that peo- ple or nation with better health will have higher income. According to [4], there are four pathways where health can contribute to income. Firstly, people who have better health will work longer hours, and because they have good health, they are more productive and gain more income. Secondly, healthier people will have more in- centive to invest on their knowledge and skill which re- sult in better training and education. Thirdly, in the life cycle, greater longevity will reduce saving rate in the *Corresponding author. 1The average growth rate of income per capita from 1990 to 2010 is about 6.5%, and the fraction of poverty households has been reduced from nearly 60% in 1993 to 14% in 2008 [1].  C. T. DO, A. N. T. NGO 329 productive life period, so financial market will gain more investment. Finally, healthier population will lead to a low mortality rate of children and then reduce fertility rate. Additionally, healthier population will also lead to longer working age of population, and this is a major de- terminant of economic growth and per capita income. The first and the second points are the main hypotheses, about which this study wants to test for the case of Vietnam. This study concerns more about agricultural house- holds and farmers, rather than people who are living in urban areas or working in non-agricultural sector, be- cause farmers are working based heavily on their physi- cal functional status and strength. Moreover, when a farmer gets sick, it may be one day or longer, and he does not have any payment for sick-leave like laborers who are active in non-agricultural sector. This situation could be also seen as a weak point of public policy when the government does not provide any health insurance to this part of their citizens. In addition, microeconomic theory suggests that pro- ductivity of laborer tends to converge to the real wage at the equilibrium of labor market. This assumption, actu- ally, doesn’t always hold in the context of urban area, where sometimes the wage rate of laborer is not driven by demand and supply sides. For example, non-market factors such as relationship with government officials or private connection are crucial elements of having good earning [5,6]. On the other hand, agricultural laborers are usually self-employment, and then their productivities in the long-term and short-term are depending significantly on their health status. For that reason, the relationship between human health status and productivity in urban areas does not have much attention among researchers. Instead, many researchers focus on the relationship be- tween health and productivity in rural and agricultural areas, which will be summarized in the next section. The next section is a summary of the literature on the relationship between human health capital and agricul- tural productivity. Section 3 presents a detail description on the dataset which is used for this study and Section 4 shows the empirical results. The last section will provide a discussion about the major findings, implications and limitation of the study. 2. Literature Review 2.1. The Relationship between Health and Income The correlation of health and income has been attracted many researchers. There is abundant evidence regarding the analyzing this relationship at individual and aggre- gate levels [7-12]. Particularly, for rural areas, farmers’ incomes are responding considerably to their health. A woman in Tra Vinh province of Vietnam said “Poor peo- ple cannot improve their health status because they live day by day, and if they get sick they are in trouble be- cause they have to borrow money and pay interest” [12, p. 82]. The relationship between health and income is quite complex due to the complexity of sources of income. Liu et al. (2008) [5] divide income of Chinese households into two parts: 1) one calls market earning, which in- cludes wages income, home gardening income, farming income, livestock income, business income and income from subsidies and benefits; 2) and the others are non-market earnings, which includes income from food coupon, housing subsidy, income from other subsidies, income from other sources and income from childcare subsidy. The way of classifying income of those re- searchers is quite similar with the way of [12] when he analyses the relationship between health and income of Vietnamese households. According to him, incomes of farmers come from two sources: 1) earned income, which includes wage income, income from agricultural and family business; and 2) unearned income, which includes gift, remittances and pension. The results be- tween the two researches are quite identical. Individual health has influenced considerably on rural households’ income. Additionally, the endogeneity of health variables regarding to estimation the effect of health on income has been concerned by scholars [5,9]. 2.2. The Effects of Health on Productivity Measuring the contribution of health capital to labor pro- ductivity is attracted a plenty of researchers. They have shown many ways of calculating this relationship. In a series of papers from 1992 to 1994, Robert Fogel meas- ures the effect of workers’ height movement to individu- als’ standard of living in the long-term. Adults in four countries, United States of America (USA), Brazil, Côte d’Ivoire and Vietnam were studied and they found that the differences between the heights of adults in these countries could explain for the diverse of income of them. In addition, this information could be extended for ana- lyzing the wealth and health status differences between four countries. At household level, many research point out the corre- lation between income and health status. [13] showed that the poorest household will have the worst health status. They found that in Brazil “a 1 percent increase in height is associated with an almost 8 percent increase in wages”, while in USA a 1 percent increase in height has led to 1 percent raise in salaries. According to these au- thors, taller men are combined with higher educational attainment in both countries. Moreover, the better health status worker tends to do more efficient, longer hour and productive than the worker who have lower health status. Incorporating with the heights of people, [14] found that shorter men have a larger part than taller men in unem- Open Access TEL  C. T. DO, A. N. T. NGO 330 ployment. For example, “over 10 percent of men who are 154 cm tall were not working at the date of the survey, but among those who are about 167 cm tall, the fraction is only 5 percent”. The similar results are applied for women as well. In contrast, the association connecting ill health and wage has been reported with both sides. In an experi- mental study in Tanzania, [15] found that workers have suffered from schitosomiasis have lower productivity than other workers who do not have this disease, while C. Gateff et al. (1971) (cited in [6]) found that no different between workers who are infected schitosomiasis and who are not infected in an investigational research in Cameroon. The different between two experiments sug- gests that we may not apply this method for analyzing contributions of human health capital to labors’ produc- tivity due to the endogeneity of health. Another disad- vantage of experimental study is the result does not have great power of generalizing due to small and bias sample. Therefore, it is said that non-experimental methods can be a good choice. In non-experimental studies, researchers are often use data from household survey, and then they have only used self-reported data from respondents. This way of thinking has a main downside which is health contains measurement error discussed above. Similar with experi- mental research, non-experimental investigations have mixed results. [16] affirm that Ivorian males show that ill health workers have lower wage than good health work- ers, while [17] conclude that in Indonesia’s rural area, farmers’ productivity has not been affected by ill health farmers. The case of Indonesia can explain that if a farmer cannot work, they will ask their neighbors or rela- tives help them. The situation in Indonesia is quite simi- lar with the case of Vietnamese agriculture sector. 2.3. Economic Effects of Health Studying economic effects of health has differed in the level of aggregation. Some concentrate on individual health status, whereas the others use data at country level. Researchers employ lot methods of measuring the eco- nomic effects of health, but these methods can be catego- rized in: anthropometric variables, survival and mortality variables, morbidity variables, general health and func- tional status variables [5,18,19]. The effect of health on income is varied due to the choice of independent variables. Therefore, we cannot capture economic effects of health on income productiv- ity by only one variable or function. [5] provide a short list of selecting health variable from micro level to macro level. At micro level, households’ income and individual health are the two major variables in their model, while at macro level income per capita and aggregated health variable are the two main variables. Almost studies of this relationship show us a positive relationship between income productivity or income per capita and health. Better health, better nutrition intake will robust the pro- ductivity of laborers and healthier people will willing to participate longer to labor market in some Asian coun- tries. A common methodological concern among these stu- dies is the endogeneity of health in measuring the rate of return to income productivity or income per capita. In order to figure out this issue, intellectuals often employ instrumental variables regression as their major work- horse. In the case of lacking instrumental variables, fixed effect model could be seen as a second best selection [20]. 3. Data and Model 3.1. Data VHLSS is an ongoing survey which is focused on living standard of Vietnamese people. The four waves are con- ducted in 2002, 2004, 2006 and 2008 respectively. In the four surveys, there are number of households whose may appear in the four waves or at least two waves, but due to different purpose of each wave the specific questionnaire on health in 2006 does not appear all in these surveys. The survey in 2006 contained rich source of data related to health indicators. However, in order to compare be- tween years we employ only variables which appear in three dataset, so unfortunately the rich health indicators in VHLSS 2006 could not be employed in this study. The Table 1 reports some basic on the VHLSS 2002, 2004 and 2006. These datasets are used to estimate Equation (1). Dataset at provincial level is constructed from a rich source of data which contains statistical data for 61 provinces in 1999 and 2002, 64 provinces in 2004 (there some provinces have been divided to two provinces). In the dataset, life expectancy for male and female have been provided with information about income per capita and percentage of public spending on health in each province. Therefore, this dataset provides a suitable data for testing second statement of [21] in the context of transition and developing country like Vietnam. Addi- tionally, this dataset is used to estimate Equations (2) and (3). 3.2. Models 3.2.1. Individual Health—Household Income Model In order to analyze the first point, our empirical model employs an income production function. Human health capital stock is measured at individual level, while in- come is observed at household level2. Households in the 2This approach has been employed by [5] for China Health and Nutri- tion survey. Open Access TEL  C. T. DO, A. N. T. NGO Open Access TEL 331 model are agricultural households3. Additionally, to ana- lyze the second point, our empirical model will be based on regression analysis with a linear function which will be discussed further in the next paragraphs. Data for this goal is at provincial level rather than the individual level because the dependent variable is life expectancy. Life expectancy cannot calculate from VHLSS 2002, 2004 and 2006 where these datasets does not include informa- tion about mortality rate at different ages, so we cannot build up life table at individual level. Fortunately, Gen- eral Statistical Office provides a very good dataset which includes income per capita and life expectancy at provin- cial level beside other important variables. Therefore, in order to test second point of [21], we can run a regression based on provided provincial data. The following part will provide a description of models that the paper em- ploys to test first and second points. The first model is individual level model where de- pendent variable is households’ income (sources of household’s income is presented in Table 2). Thus, the basic model can be expressed as linear function with de- pendent variable is natural logarithm of households’ in- come as follows: 0 23 itit it ijtjt ij ln YlnLandH ZTime 1 (1) where, : Household i at the time t; : Individual in the household i at the time ; it : Income of household at the time t; : Endowment wealth of household at the time ; ij jt ijt d t Y iLan iit : Average health status of household measured by health expen- diture per member in the household at the time ; ijt i i t : a vector of controlled variables; : unobserved effect; ij : iid. error term. In fact, individual health variables may respond con- siderably to households’ permanent income rather than temporary income or vice versa. In the case, unobserved individual and household characteristics, such as family background or individual fundamental health gift, might be the cause of endogeneity of individual health variables Table 1. Information of VHLSS 2002, 2004 and 2006. 2002 2004 2006 Field work time: 05-11/2002 05-11/2004 05-11/2006 Households to be interviewed in design: 30,000 9000 9000 Households actually appeared in the VHLSS 2006 29,530 9189 9189 Number of communes in household datasets 2901 3061 3063 Number of district in household datasets 607 630 630 Number of provinces in household datasets 61 64 64 Number of provinces in commune datasets 61 64 64 Source: Author’s calculation. Table 2. Income components. Earning from agricultural activities in the last 12 months First component of agricultural household income Earning from non-agricultural activities in the last 12 months Oversea and domestic remittance from people who are not household members Pension, one-time sickness and job loss allowance Social welfare allowance Income from insurance Interest of savings and the like Income from leasing Total annual Agricultural Household income Second component of agricultural household income Income from charity organizations, associations and firms Souce: Summary from questionnaire of VHLSS in 2002, 2004 and 2006. r 3The reason for selecting this type of households is that agricultural labourers are self-employed and they rely considerably on their health status. When they have got illnesses, they do not have any other source of income. Therefore, the relationship between health and income might stronger than people whose are living in the urban areas.  C. T. DO, A. N. T. NGO 332 in income function [6]. Using cross-sectional dataset may lead to a bias estimated coefficient of individual health status. Providentially, very few of these factors have changed overtime and most of them is driven by fixed observables (ij ). Employing three VHLSS datasets in a fixed effect model, the unobserved variables at individual level could be figured out. Within/fixed effect allows us to control these effects. However, in interpreting model, it needs an explanation with care because the model only catches these effects of individual health status on households’ income in the short-run period of time. Actually, in the short-run period of time, the estimation might have bias coefficient of individual health due to the reflection of household income shock on individual health shock. To my best knowledge, the effects of individual health vari- ables on income are usually dominated by the first com- ponent of household income that describe in Table 2. There are several important points. Firstly, the labor market in Vietnam is new and far from perfect market and rural households have a very small amount of in- come from market wages. Secondly, it is very difficult to separate individual contribution to agricultural household income in the case of Vietnam. This is quite similar with other situation in developing countries (for other example please sees [5]. In the survey, income part, respondents did not report their income for each member of their family. Therefore, in this paper, we calculate agricultural households income based on their report on their family sources of income from agricultural works and non-agri- cultural work. For non-agricultural work, extra earnings from market from trade and working seasonally in urban areas in the leisure after harvest time have been em- ployed to calculate agricultural household incomes. Then, we divide total households income by total working hour per year in order to get average income per hour per worker. Next, agricultural households’ incomes have been deflated by using region and year specific deflators. Thirdly, health status is measured by the number of days that farmers cannot work due to illness or injury and the amount money is spent for treatments or health equip- ments. Finally, our model aims to explain the relation- ship between individual health and income per capita, so this model does not equal to model explains the correla- tion between individual health and individual income. Thus, our individual health-household income model, with specific for Vietnam agricultural households and farmers, is an evidence for estimating the relationship between individual health and individual income produc- tivity. 3.2.2. Life Expectancy—Illiterate Model at Provincial Level In order to analyze the relationship between health and education at provincial level, we use data at provincial level with life expectancy variable is proxied for health and the rate of illiterate people as a proxy for education. The rationale of this relationship is that when people live longer, which is reflected by an increasing of life expec- tancy, they will have more incentive to learn, so the rate of adults who illiterate will be decreased. Additionally, to analyze the different respond between male and female health on education, the baseline and expand models will be estimated by gender. The baseline model is presented as follows: ijtijt it ijt Life Illiterate (2) where, : province i in the time t, i1, 64i , 19992002,2004t 1 , j ; : gender with indicates female, j0j specifies male; ijt : General life ex- pectancy of male/female of province at the time ; ijt Life it lliterate i : the percentage of illiterate of male/female of province at the time ; t : constant; : coefficient; it : the unobservable factors of province at the time , these factors may be cultural background, social co- hesion or other; i t it : error term. The expand model will employ some variables such as natural logarithm of income per capita at provincial level, the percentage of provincial budget spending for health in total provincial budget and two dummy variables in- dicate the province achieving high and medium value of human development index (here after HDI). Income per capita and public spending on health present the specific wellbeing of each province. Positive relationship be- tween them and health means that higher income and public spending on health will lead to the better health for people. Additionally, in order to test the robust effects of high and medium HDI provinces, the model employs two dummy variables call high and medium. High and medium will have value 1 if the province belongs to high or medium HDI group respectively and 0 for others. The expand model, thus, is presented as follows: 12 34 ijtijt it itit it ijt LifeIlliterateln ln Spending Z (3) where the additional variables: it ln ln i : natural logarithm income per capita of prov- ince in the time ; it : Public spending, measured by percentage in total public expenditure, for health of province in the time ; it tSpending ti : Controlled variables which include some geographical characteris- tics of the province i and other indicator variables. There are several important points. Firstly, in Vietnam provinces have partially depended on central government, but the political system in Vietnam is not similar with the federal system of the USA. Secondly, it is very difficult to calculate life expectancy at provincial level in the long period of time because the statistical data collection in Open Access TEL  C. T. DO, A. N. T. NGO 333 Vietnam is still weak and incomplete. Thirdly, it is diffi- cult to calculate average years of schooling at provincial level due to the lacking of available and reliable data. Our model employs the rate of adult illiterate as a proxy for education because when people are healthier they will have more incentive to learn more. Particularly, in Viet- nam, after the Independence War, adults have lost their incentive to study more because the country was in the reconstruction stages, so the illiterate rate was very high. Then, when their economic status is better than before, if they feel their health is good enough they will learn more. Therefore, the percentage of illiterate at provincial level could be seen as a signal of the relationship between health and education. Finally, this model aims to explain the relationship between life expectancy and education at provincial level. Please keep in mind that Vietnam is still low developed country and the fraction of rural people in total population is higher than 65%, so we might employ average life expectancy to stand for rural people and not to lose the general meaning. Therefore, the model life expectancy—illiterate model at provincial level could be seen as an evidence for estimation the relationship be- tween life expectancy and education. 4. Empirical Findings 4.1. Descriptive Statistics The basic descriptive statistics at household level is pro- vided in the Table 3. Obviously, there is a considerable variation of average health expenditure and agricultural income. In order to catch the actual effects of age on the relationship between health and income, individuals whose age from 20 to over 65 have been selected and formed in a panel dataset. The proportion of individuals, whose age from 30 to 64, is close to 75%. This fraction is consistent with the overall population distribution of adults in Viet- nam. The significant increase in agricultural households’ in- come in the sample has reflected the remarkable increase of economic growth in Vietnam during the study period, from nearly 1 million per year in 2002 to 1.3 million in 2006. Associate with the increase of income, health ex- penditure of agricultural households has been increased considerably from 182,000 per year in 2002 to 351,600 in 2006. Actually, the rate of increasing in health expen- diture is higher than the rate of income growth, 24.5% compare to 9.1% annual. In fact, VHLSSs are not a perfect panel dataset. Due to the purpose of each wave, the numbers of households and places have been selected independently. However, there is a small amount of repeated households in the three waves. To estimate the fixed effects at the individ- ual level, it is necessary to have a panel data with the repeated value of individuals in a specific time period. Table 3. Descriptive statistic for household leve l. Variables MeanStandard Deviation Natural logarithm of household income 9.2211.003 Health Status Natural logarithm of household health expenditure per member 5.7811.381 Wealth Endowment Natural logarithm of household agricultural land 8.8681.399 Education Years of schooling 6.7703.283 No school 0.0570.233 Elementary 0.3220.467 Secondary 0.4950.500 High school 0.1240.330 Married Status Married 0.8750.330 Regional Red River Delta 0.2340.423 North East 0.2050.404 North West 0.0620.242 North Central Coast 0.1560.363 South Central Coast 0.0910.288 Central Highlands 0.0650.246 South East 0.0410.199 Age Group Age 1 (20 - 29) 0.0480.214 Age 2 (30 - 39) 0.2570.437 Age 3 (40 - 49) 0.3260.326 Age 4 (50 - 64) 0.2520.434 Age 5 (65+) 0.1150.319 The basic descriptive statistics at provincial level is provided in Table 4. Income per capita, measured by USD, has been increased significantly from approxi- mately 290 USD per year in 1999 to roughly 500 USD in 2004. The increase is also similar with the trend of in- creasing household income in the period of 2002 to 2006 above, but due to lack of data for agricultural income at provincial level there is a difficult to link between health- income relationship at household and provincial levels. The proportions of public spending on health in total available budget are quite similar with the fraction of Open Access TEL  C. T. DO, A. N. T. NGO Open Access TEL 334 Table 4. Descriptive statistic for provincial level. Variables 1999 2002 2004 Percentage of public spending on health (%) 4.61 (1.58) 4.68 (1.07) 4.37 (1.04) Annual personal income (USD) 289.68 (303.31) 368.80 (478.43) 498.65 (798.71) Male life expectancy 66.42 (4.04) 67.53 (3.62) 67.85 (3.40) Female life expectancy 72.90 (3.88) 73.24 (3.29) 73.57 (3.15) Male illiterate rate (%) 7.54 (6.55) 6.77 (5.97) 7.02 (6.71) Female illiterate rate (%) 15.74 (10.43) 13.12 (9.58) 12.98 (10.68) Source: Author’s calculation. Note: Numbers in parentheses are standard deviation, while these others are means. Table 5. Overall sample regression. household spending on health. This characteristic allows us to believe that there is an available link between pub- lic and private health expenditure. However, in order to prove the existence of this connection, we need more detail data. Independent variables OLS Fixed e ffects Natural logarithm of health expenditure 0.028* (0.011) 0.060* (0.013) Natural logarithm of agricultural land 0.309* (0.012) 0.248* (0.012) Years of schooling 0.028* (0.005) - Married status 0.121* (0.045) - Age 1 (20 - 29) −0.212* (0.079) −1.682* (0.209) Age 2 (30 - 39) 0.011 (0.052) −1.216* (0.176) Age 3 (40 - 49) 0.194* (0.050) −0.768* (0.156) Age 4 (50 - 64) 0.201* (0.050) −0.335* (0.131) Red River Delta −0.786* (0.051) - North East −0.794* (0.051) - North West −0.845* (0.068) - North Central Coast −0.975* (0.054) - South Central Coast −0.949* (0.061) - Central Highlands −0.512* (0.067) - South East −0.501* (0.077) - Time effect 0.204* (0.020) - Constant 6.199* (0.133) 7.409* (0.204) Adjusted-R2 0.4647 ρ 0.578 F test that all 0 i (rejected) 1.99 The increasing of income per capita at provincial level is associated with the increasing of life expectancy. Ad- ditionally, there is a negative relation between male and female life expectancy and male and female illiterate rate at provincial level from 1999 to 2004, respectively. To measure the fixed effects of provincial conditions to people health at provincial level, a panel data at the level has been constructed by using several sources of data. However, due to the lacking of available and reli- able data, a panel with only three years periods is con- structed. Thus, our analysis may be restricted and very risky if we apply the conclusion of this period to other period of time. 4.2. Individual Health—household Income Model We begin with estimates over the all sample, which are provided in Table 5 for household sample. Initially, sim- ple ordinary least squares estimates (here after OLS), standard errors have been adjusted for household level, are consistent with our first major hypothesis: individual health is strongly connected with household income. The elasticity of individual health expenditure on agricultural households is significant at 1%. The positive sign of health coefficient implies that the increasing in health will lead to an increasing in income. Particularly, 1% in- crease in health expenditure might increase 2.8% house- hold income. As can be seen from Table 5, both OLS and fixed ef- fects regressions provide a statistical significant estima- tion the elasticity of individual health expenditure on agricultural household income. However, in this circum- stance, fixed effects estimation has more reliable coeffi- cient than OLS approach. By its assumptions, OLS ap- proaches individual health expenditure as an exogenous variable. In order to explore the relationship between Note: *is statistical significant at 1%. Source: Author’s estimation. individual health expenditure and household income, fixed-effects estimation has been employed because this regression technique can figure out the effect of unob- served factors. From the Table 5, it is clear that our first major hypothesis does still hold. Additionally, the elas- ticity of individual health expenditure here is robust, 1%  C. T. DO, A. N. T. NGO 335 increasing in health expenditure will lead to 6% increas- ing in income. The estimation of ρ suggests that just over 50% of variation in agricultural household income is related to the inter-household differences in the income growth. In this case, OLS results are inconsistent because the rejection at 1% of the null hypothesis test which in- dicates the constant terms are equal to all unit. In short, the first major hypothesis has been hold under both OLS and fixed effects estimations, but our conclusion is based on the result of fixed effects estimation because the OLS’s outcome might not reliable. In order to find more about the relationship between individual health and household income, we do fixed- effect regression for each age group. This task can pro- vide further information about the relationship among the groups. The results will be reported in the discussion section. 4.3. Life Expectancy—Education Model at Provincial Level We begin with estimates the baseline model for male and female life expectancy, presented in Table 6. To begin with, OLS regressions have been run for male and female separately. The signs of coefficients in both estimations are negative which imply that the decreasing of male and female illiterate rate will lead to an increasing in male and female life expectancy at provincial level in Vietnam. Male illiterate rate coefficient is 40% higher than the fe- male coefficient. Based on empirical result, 1% decreases in male and female illiterate rate will lead to an increase of male and female life expectancy about roughly 0.4 and 0.2 year old respectively. In order to have a more comprehensive understand about the effect of other unobserved factors such as en- vironment or cultural background, fixed-effects approach has been applied. The result of fixed-effects estimation for male is considerably robust, while the outcome for female changes slightly. The effects of male illiterate on male life expectancy decrease from −0.363 in OLS ap- proach to −0.904 in fixed effects approach (nearly 150%), while this effect for female increase from −0.215 in OLS strategy to −0.188 in fixed-effects strategy (only 12.5%), detail result is provided in Table 6. This result implies the different gender respond to life expectancy and the different in gender unobserved factors. The F test for both regressions in fixed-effects strategy is statistical significant at 1%. This implies that the coef- ficients in OLS approach are biased and the results of OLS estimations are inconsistent. The ρ value in column 2 and 4 mean that just over 95% and roughly 90% of variation of male and female life-expectancy can be ex- plained by inter-provinces differences in male and female life expectancy respectively. In order to have more in- formation about the unobserved effects, Hausman and Taylor instrumental variables (here after HT/IV) regres- sion has been employed in the next sections. HT/IV re- gression is selected because it allows time-variant and time-invariant variables appear together in the same es- timation. Under HT/IV approach, it is expected that the effect of male and female illiterate will be robust. Additionally, in the expand model (Equation (3)), sev- eral variables have been added. This might lead to a bet- ter estimation when error term is smaller. In fact, how- ever, added variables are stand for some characteristics of the provinces. Particularly, the fraction of public spen- ding on health may well present for the economic per- formance of the province where rich province will have larger fund for public health expenditure. 5. Discussion 5.1. Individual Health—Household Income Model This part reports empirical estimates the relationship be- Table 6. Baseline model at provincial level. Dependent variable is male life expectancy Dependent variable is female life expectancy OLS Fixed effects OLS Fixed effects Male illiterate rate −0.363* (0.033) −0.904* (0.142) Female illiterate rate −0.215* (0.018) −0.188* (0.041) Constant 69.866* (0.320) 73.714* (1.013) 76.251* (0.327) 75.865* (0.585) R2 0.3865 0.3898 0.4103 0.4135 ρ 0.9527 0.8920 F test 19.05 Rejected 23.00 Rejected N ote: Numbers in parentheses are standard error. * is statistical significant at 1%. Source: Author’s estimation. Open Access TEL 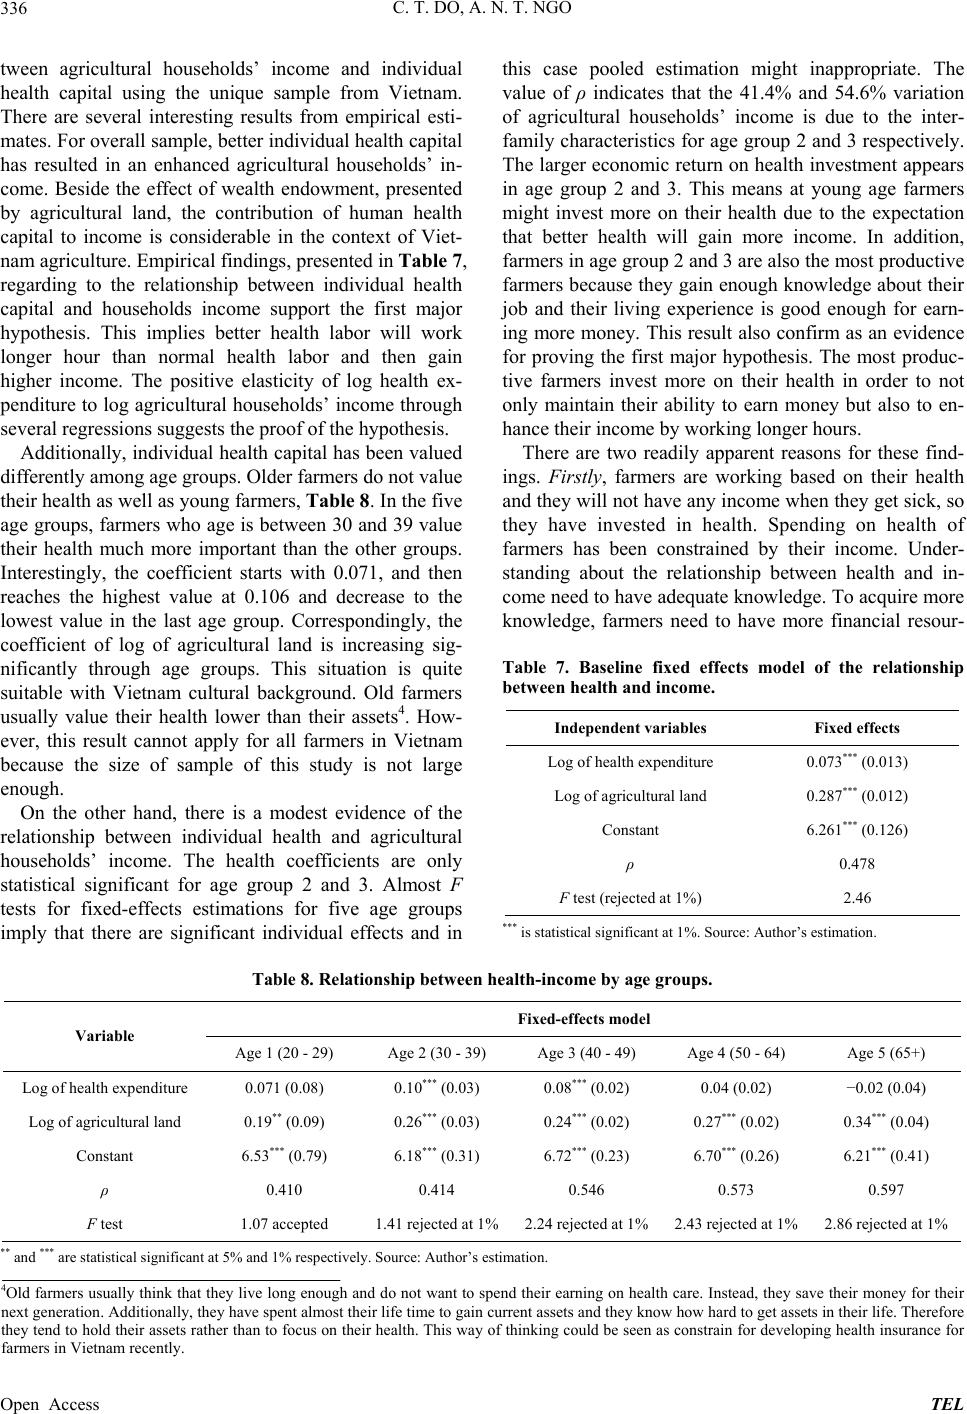 C. T. DO, A. N. T. NGO 336 tween agricultural households’ income and individual health capital using the unique sample from Vietnam. There are several interesting results from empirical esti- mates. For overall sample, better individual health capital has resulted in an enhanced agricultural households’ in- come. Beside the effect of wealth endowment, presented by agricultural land, the contribution of human health capital to income is considerable in the context of Viet- nam agriculture. Empirical findings, presented in Tabl e 7, regarding to the relationship between individual health capital and households income support the first major hypothesis. This implies better health labor will work longer hour than normal health labor and then gain higher income. The positive elasticity of log health ex- penditure to log agricultural households’ income through several regressions suggests the proof of the hypothesis. Additionally, individual health capital has been valued differently among age groups. Older farmers do not value their health as well as young farmers, Table 8. In the five age groups, farmers who age is between 30 and 39 value their health much more important than the other groups. Interestingly, the coefficient starts with 0.071, and then reaches the highest value at 0.106 and decrease to the lowest value in the last age group. Correspondingly, the coefficient of log of agricultural land is increasing sig- nificantly through age groups. This situation is quite suitable with Vietnam cultural background. Old farmers usually value their health lower than their assets4. How- ever, this result cannot apply for all farmers in Vietnam because the size of sample of this study is not large enough. On the other hand, there is a modest evidence of the relationship between individual health and agricultural households’ income. The health coefficients are only statistical significant for age group 2 and 3. Almost F tests for fixed-effects estimations for five age groups imply that there are significant individual effects and in this case pooled estimation might inappropriate. The value of ρ indicates that the 41.4% and 54.6% variation of agricultural households’ income is due to the inter- family characteristics for age group 2 and 3 respectively. The larger economic return on health investment appears in age group 2 and 3. This means at young age farmers might invest more on their health due to the expectation that better health will gain more income. In addition, farmers in age group 2 and 3 are also the most productive farmers because they gain enough knowledge about their job and their living experience is good enough for earn- ing more money. This result also confirm as an evidence for proving the first major hypothesis. The most produc- tive farmers invest more on their health in order to not only maintain their ability to earn money but also to en- hance their income by working longer hours. There are two readily apparent reasons for these find- ings. Firstly, farmers are working based on their health and they will not have any income when they get sick, so they have invested in health. Spending on health of farmers has been constrained by their income. Under- standing about the relationship between health and in- come need to have adequate knowledge. To acquire more knowledge, farmers need to have more financial resour- Table 7. Baseline fixed effects model of the relationship between he alth and income . Independent variables Fixed effects Log of health expenditure 0.073*** (0.013) Log of agricultural land 0.287*** (0.012) Constant 6.261*** (0.126) ρ 0.478 F test (rejected at 1%) 2.46 *** is statistical significant at 1%. Source: Author’s estimation. Table 8. Relationship betwee n health-income by age groups. Fixed-effects mod el Variable Age 1 (20 - 29) Age 2 (30 - 39) Age 3 (40 - 49) Age 4 (50 - 64) Age 5 (65+) Log of health expenditure 0.071 (0.08) 0.10*** (0.03) 0.08*** (0.02) 0.04 (0.02) −0.02 (0.04) Log of agricultural land 0.19** (0.09) 0.26*** (0.03) 0.24*** (0.02) 0.27*** (0.02) 0.34*** (0.04) Constant 6.53*** (0.79) 6.18*** (0.31) 6.72*** (0.23) 6.70*** (0.26) 6.21*** (0.41) ρ 0.410 0.414 0.546 0.573 0.597 F test 1.07 accepted 1.41 rejected at 1%2.24 rejected at 1%2.43 rejected at 1% 2.86 rejected at 1% ** and *** are statistical significant at 5% and 1% respectively. Source: Author’s estimation. 4Old farmers usually think that they live long enough and do not want to spend their earning on health care. Instead, they save their money for their next generation. Additionally, they have spent almost their life time to gain current assets and they know how hard to get assets in their life. Therefore they tend to hold their assets rather than to focus on their health. This way of thinking could be seen as constrain for developing health insurance for farmers in Vietnam recently. Open Access TEL 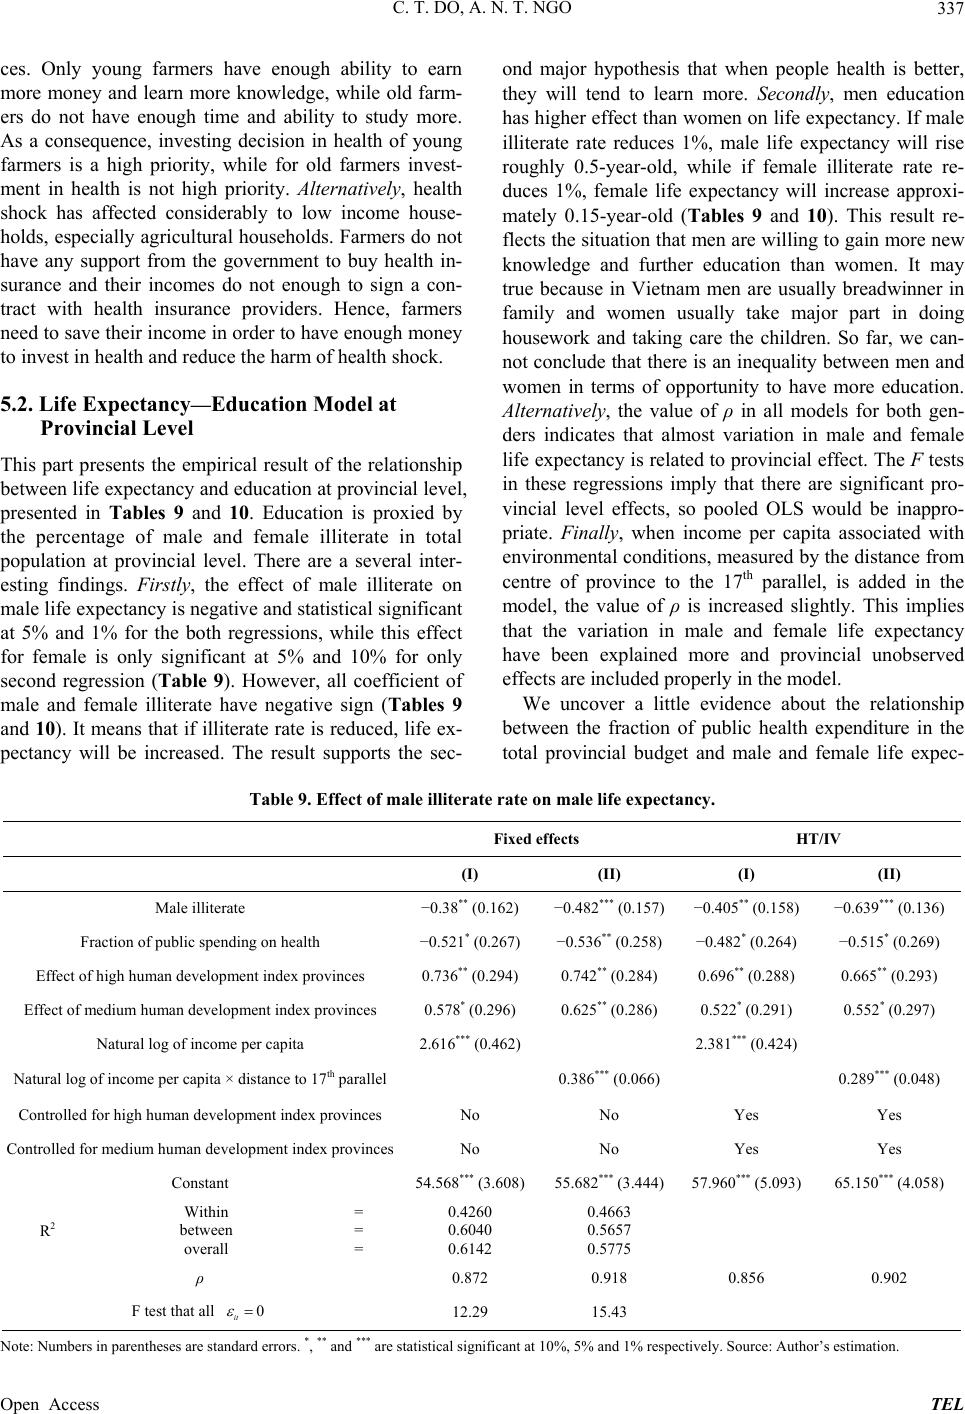 C. T. DO, A. N. T. NGO 337 ces. Only young farmers have enough ability to earn more money and learn more knowledge, while old farm- ers do not have enough time and ability to study more. As a consequence, investing decision in health of young farmers is a high priority, while for old farmers invest- ment in health is not high priority. Alternatively, health shock has affected considerably to low income house- holds, especially agricultural households. Farmers do not have any support from the government to buy health in- surance and their incomes do not enough to sign a con- tract with health insurance providers. Hence, farmers need to save their income in order to have enough money to invest in health and reduce the harm of health shock. 5.2. Life Expectancy—Education Model at Provincial Level This part presents the empirical result of the relationship between life expectancy and education at provincial level, presented in Tables 9 and 10. Education is proxied by the percentage of male and female illiterate in total population at provincial level. There are a several inter- esting findings. Firstly, the effect of male illiterate on male life expectancy is negative and statistical significant at 5% and 1% for the both regressions, while this effect for female is only significant at 5% and 10% for only second regression (Table 9). However, all coefficient of male and female illiterate have negative sign (Tables 9 and 10). It means that if illiterate rate is reduced, life ex- pectancy will be increased. The result supports the sec- ond major hypothesis that when people health is better, they will tend to learn more. Secondly, men education has higher effect than women on life expectancy. If male illiterate rate reduces 1%, male life expectancy will rise roughly 0.5-year-old, while if female illiterate rate re- duces 1%, female life expectancy will increase approxi- mately 0.15-year-old (Tables 9 and 10). This result re- flects the situation that men are willing to gain more new knowledge and further education than women. It may true because in Vietnam men are usually breadwinner in family and women usually take major part in doing housework and taking care the children. So far, we can- not conclude that there is an inequality between men and women in terms of opportunity to have more education. Alternatively, the value of ρ in all models for both gen- ders indicates that almost variation in male and female life expectancy is related to provincial effect. The F tests in these regressions imply that there are significant pro- vincial level effects, so pooled OLS would be inappro- priate. Finally, when income per capita associated with environmental conditions, measured by the distance from centre of province to the 17th parallel, is added in the model, the value of ρ is increased slightly. This implies that the variation in male and female life expectancy have been explained more and provincial unobserved effects are included properly in the model. We uncover a little evidence about the relationship between the fraction of public health expenditure in the total provincial budget and male and female life expec- Table 9. Effect of male illiterate rate on male life expectancy. Fixed effects HT/IV (I) (II) (I) (II) Male illiterate −0.38** (0.162) −0.482*** (0.157)−0.405** (0.158) −0.639*** (0.136) Fraction of public spending on health −0.521* (0.267) −0.536** (0.258)−0.482* (0.264) −0.515* (0.269) Effect of high human development index provinces 0.736** (0.294) 0.742** (0.284) 0.696** (0.288) 0.665** (0.293) Effect of medium human development index provinces 0.578* (0.296) 0.625** (0.286) 0.522* (0.291) 0.552* (0.297) Natural log of income per capita 2.616*** (0.462) 2.381*** (0.424) Natural log of income per capita × distance to 17th parallel 0.386*** (0.066) 0.289*** (0.048) Controlled for high human development index provincesNo No Yes Yes Controlled for medium human development index provincesNo No Yes Yes Constant 54.568*** (3.608) 55.682*** (3.444)57.960*** (5.093) 65.150*** (4.058) R2 Within between overall = = = 0.4260 0.6040 0.6142 0.4663 0.5657 0.5775 ρ 0.872 0.918 0.856 0.902 F test that all 0 it 12.29 15.43 Note: Numbers in parentheses are standard errors. *, ** and *** are statistical significant at 10%, 5% and 1% respectively. Source: Author’s estimation. Open Access TEL 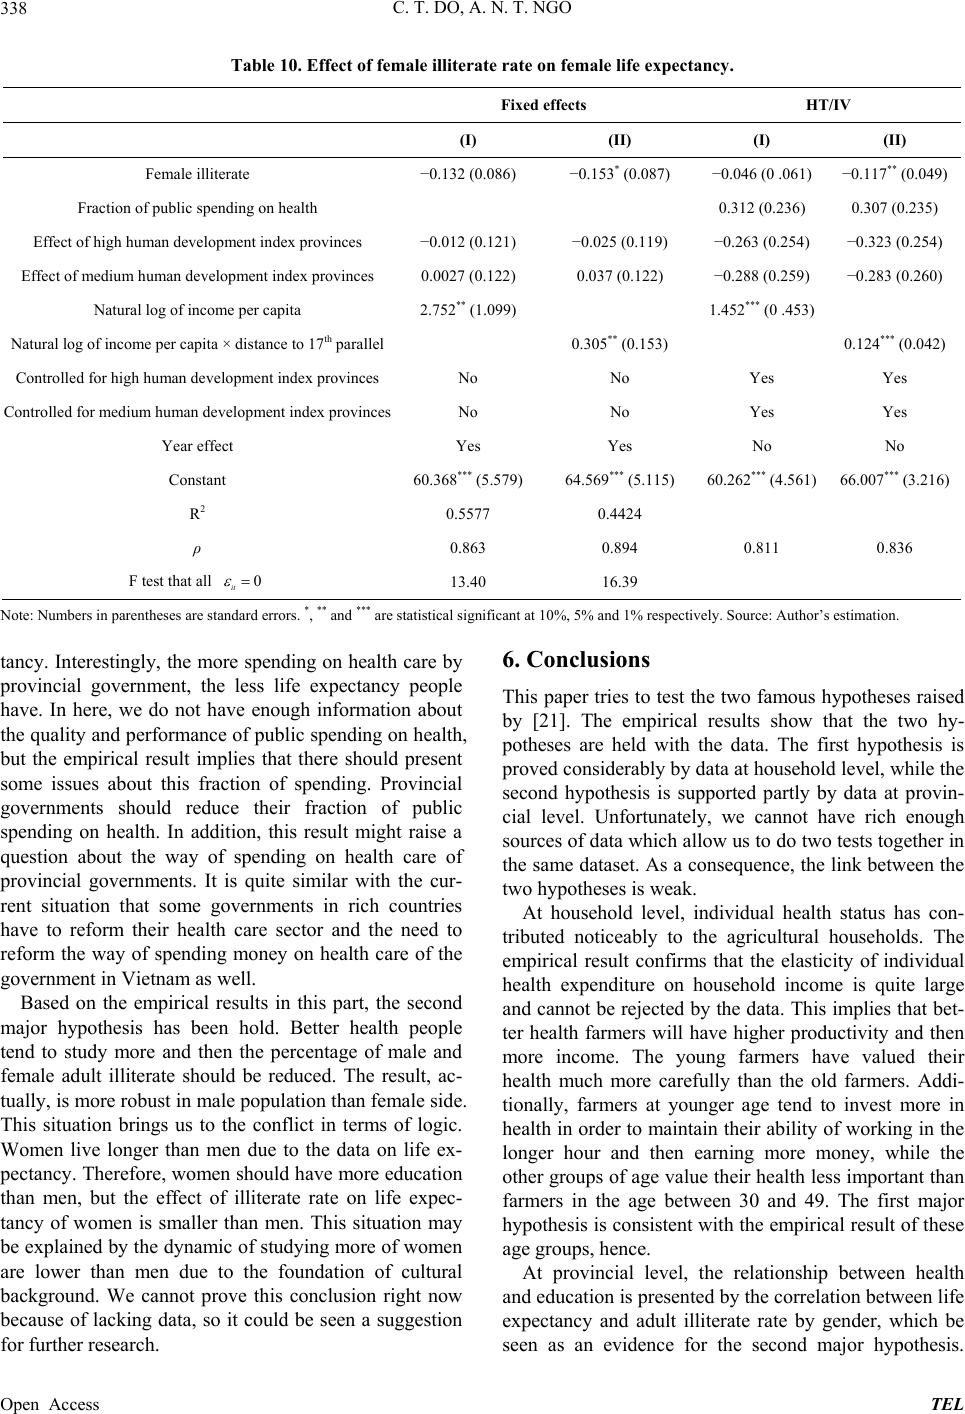 C. T. DO, A. N. T. NGO 338 Table 10. Effect of female illiterate rate on female life expectancy. Fixed effects HT/IV (I) (II) (I) (II) Female illiterate −0.132 (0.086) −0.153* (0.087) −0.046 (0 .061) −0.117** (0.049) Fraction of public spending on health 0.312 (0.236) 0.307 (0.235) Effect of high human development index provinces −0.012 (0.121) −0.025 (0.119) −0.263 (0.254) −0.323 (0.254) Effect of medium human development index provinces 0.0027 (0.122) 0.037 (0.122) −0.288 (0.259) −0.283 (0.260) Natural log of income per capita 2.752** (1.099) 1.452*** (0 .453) Natural log of income per capita × distance to 17th parallel 0.305** (0.153) 0.124*** (0.042) Controlled for high human development index provincesNo No Yes Yes Controlled for medium human development index provincesNo No Yes Yes Year effect Yes Yes No No Constant 60.368*** (5.579) 64.569*** (5.115) 60.262*** (4.561) 66.007*** (3.216) R2 0.5577 0.4424 ρ 0.863 0.894 0.811 0.836 F test that all 0 it 13.40 16.39 Note: Numbers in parentheses are standard errors. *, ** and *** are statistical significant at 10%, 5% and 1% respectively. Source: Author’s estimation. tancy. Interestingly, the more spending on health care by provincial government, the less life expectancy people have. In here, we do not have enough information about the quality and performance of public spending on health, but the empirical result implies that there should present some issues about this fraction of spending. Provincial governments should reduce their fraction of public spending on health. In addition, this result might raise a question about the way of spending on health care of provincial governments. It is quite similar with the cur- rent situation that some governments in rich countries have to reform their health care sector and the need to reform the way of spending money on health care of the government in Vietnam as well. Based on the empirical results in this part, the second major hypothesis has been hold. Better health people tend to study more and then the percentage of male and female adult illiterate should be reduced. The result, ac- tually, is more robust in male population than female side. This situation brings us to the conflict in terms of logic. Women live longer than men due to the data on life ex- pectancy. Therefore, women should have more education than men, but the effect of illiterate rate on life expec- tancy of women is smaller than men. This situation may be explained by the dynamic of studying more of women are lower than men due to the foundation of cultural background. We cannot prove this conclusion right now because of lacking data, so it could be seen a suggestion for further research. 6. Conclusions This paper tries to test the two famous hypotheses raised by [21]. The empirical results show that the two hy- potheses are held with the data. The first hypothesis is proved considerably by data at household level, while the second hypothesis is supported partly by data at provin- cial level. Unfortunately, we cannot have rich enough sources of data which allow us to do two tests together in the same dataset. As a consequence, the link between the two hypotheses is weak. At household level, individual health status has con- tributed noticeably to the agricultural households. The empirical result confirms that the elasticity of individual health expenditure on household income is quite large and cannot be rejected by the data. This implies that bet- ter health farmers will have higher productivity and then more income. The young farmers have valued their health much more carefully than the old farmers. Addi- tionally, farmers at younger age tend to invest more in health in order to maintain their ability of working in the longer hour and then earning more money, while the other groups of age value their health less important than farmers in the age between 30 and 49. The first major hypothesis is consistent with the empirical result of these age groups, hence. At provincial level, the relationship between health and education is presented by the correlation between life expectancy and adult illiterate rate by gender, which be seen as an evidence for the second major hypothesis. Open Access TEL 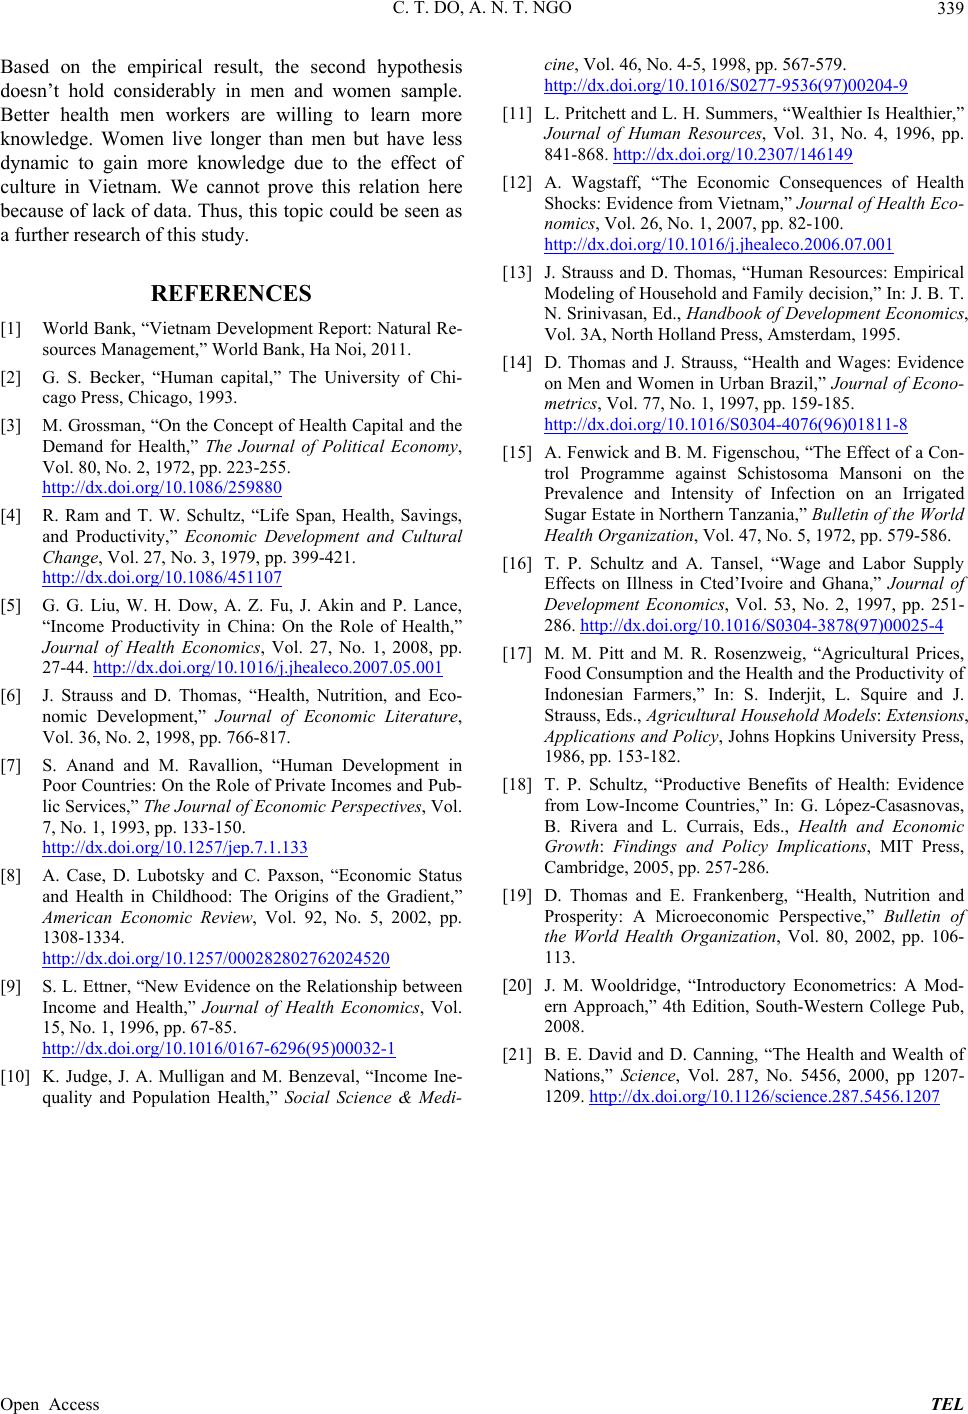 C. T. DO, A. N. T. NGO 339 Based on the empirical result, the second hypothesis doesn’t hold considerably in men and women sample. Better health men workers are willing to learn more knowledge. Women live longer than men but have less dynamic to gain more knowledge due to the effect of culture in Vietnam. We cannot prove this relation here because of lack of data. Thus, this topic could be seen as a further research of this study. REFERENCES [1] World Bank, “Vietnam Development Report: Natural Re- sources Management,” World Bank, Ha Noi, 2011. [2] G. S. Becker, “Human capital,” The University of Chi- cago Press, Chicago, 1993. [3] M. Grossman, “On the Concept of Health Capital and the Demand for Health,” The Journal of Political Economy, Vol. 80, No. 2, 1972, pp. 223-255. http://dx.doi.org/10.1086/259880 [4] R. Ram and T. W. Schultz, “Life Span, Health, Savings, and Productivity,” Economic Development and Cultural Change, Vol. 27, No. 3, 1979, pp. 399-421. http://dx.doi.org/10.1086/451107 [5] G. G. Liu, W. H. Dow, A. Z. Fu, J. Akin and P. Lance, “Income Productivity in China: On the Role of Health,” Journal of Health Economics, Vol. 27, No. 1, 2008, pp. 27-44. http://dx.doi.org/10.1016/j.jhealeco.2007.05.001 [6] J. Strauss and D. Thomas, “Health, Nutrition, and Eco- nomic Development,” Journal of Economic Literature, Vol. 36, No. 2, 1998, pp. 766-817. [7] S. Anand and M. Ravallion, “Human Development in Poor Countries: On the Role of Private Incomes and Pub- lic Services,” The Journal of Economic Perspectives, Vol. 7, No. 1, 1993, pp. 133-150. http://dx.doi.org/10.1257/jep.7.1.133 [8] A. Case, D. Lubotsky and C. Paxson, “Economic Status and Health in Childhood: The Origins of the Gradient,” American Economic Review, Vol. 92, No. 5, 2002, pp. 1308-1334. http://dx.doi.org/10.1257/000282802762024520 [9] S. L. Ettner, “New Evidence on the Relationship between Income and Health,” Journal of Health Economics, Vol. 15, No. 1, 1996, pp. 67-85. http://dx.doi.org/10.1016/0167-6296(95)00032-1 [10] K. Judge, J. A. Mulligan and M. Benzeval, “Income Ine- quality and Population Health,” Social Science & Medi- cine, Vol. 46, No. 4-5, 1998, pp. 567-579. http://dx.doi.org/10.1016/S0277-9536(97)00204-9 [11] L. Pritchett and L. H. Summers, “Wealthier Is Healthier,” Journal of Human Resources, Vol. 31, No. 4, 1996, pp. 841-868. http://dx.doi.org/10.2307/146149 [12] A. Wagstaff, “The Economic Consequences of Health Shocks: Evidence from Vietnam,” Journal of Health Eco- nomics, Vol. 26, No. 1, 2007, pp. 82-100. http://dx.doi.org/10.1016/j.jhealeco.2006.07.001 [13] J. Strauss and D. Thomas, “Human Resources: Empirical Modeling of Household and Family decision,” In: J. B. T. N. Srinivasan, Ed., Handbook of Development Economics, Vol. 3A, North Holland Press, Amsterdam, 1995. [14] D. Thomas and J. Strauss, “Health and Wages: Evidence on Men and Women in Urban Brazil,” Journal of Econo- metrics, Vol. 77, No. 1, 1997, pp. 159-185. http://dx.doi.org/10.1016/S0304-4076(96)01811-8 [15] A. Fenwick and B. M. Figenschou, “The Effect of a Con- trol Programme against Schistosoma Mansoni on the Prevalence and Intensity of Infection on an Irrigated Sugar Estate in Northern Tanzania,” Bulletin of the World Health Organization, Vol. 47, No. 5, 1972, pp. 579-586. [16] T. P. Schultz and A. Tansel, “Wage and Labor Supply Effects on Illness in Cted’Ivoire and Ghana,” Journal of Development Economics, Vol. 53, No. 2, 1997, pp. 251- 286. http://dx.doi.org/10.1016/S0304-3878(97)00025-4 [17] M. M. Pitt and M. R. Rosenzweig, “Agricultural Prices, Food Consumption and the Health and the Productivity of Indonesian Farmers,” In: S. Inderjit, L. Squire and J. Strauss, Eds., Agricultural Household Models: Extensions, Applications and Policy, Johns Hopkins University Press, 1986, pp. 153-182. [18] T. P. Schultz, “Productive Benefits of Health: Evidence from Low-Income Countries,” In: G. López-Casasnovas, B. Rivera and L. Currais, Eds., Health and Economic Growth: Findings and Policy Implications, MIT Press, Cambridge, 2005, pp. 257-286. [19] D. Thomas and E. Frankenberg, “Health, Nutrition and Prosperity: A Microeconomic Perspective,” Bulletin of the World Health Organization, Vol. 80, 2002, pp. 106- 113. [20] J. M. Wooldridge, “Introductory Econometrics: A Mod- ern Approach,” 4th Edition, South-Western College Pub, 2008. [21] B. E. David and D. Canning, “The Health and Wealth of Nations,” Science, Vol. 287, No. 5456, 2000, pp 1207- 1209. http://dx.doi.org/10.1126/science.287.5456.1207 Open Access TEL
|