J. X. SUN ET AL.
Copyright © 2013 SciRes. ENG
soybean oil: 5.6; cellulose compound: 3.2; mineral ele-
ment compound: 6.7; mixed vitamin: 1; protein: 23.2; wa-
ter: 9.8.
The collection of rats’ liver and kidney samples
After 12 h’ fasting, the experimental rats which were
fed for 6 weeks were anaesthetized by 4% pentobarbital
sodium, and the dose was based on 40 mg/kg rats’ weight.
Take about 100 mg rats’ skeletal muscle, renal cortex
and liver, and 10 ml blood. Add 0.9% normal saline for
10 ml/g. Grind tissues to get tissue homogenate, which
was centrifuged at 4˚C, 4000 rpm for 15 min, and take
the supernatant to detect CAT, SOD and GSH-Px en-
zyme activity, an d d e tect MDA [3].
The determination of CAT activity
CAT can resolve H2O2, and this reaction can be rapid-
ly terminated by adding ammonium molybdate. The ex-
tra H2O2, together with ammonium, can form a kind of
faint yellow complex compound, and its quantity of gen-
eration can be detected at 405 nm, so as to calculate CAT
activity. CAT kit used in experiments to detect was
A007-1 (Nanjing Jiancheng Bioengineering Institute). 1
umol H2O2 which was resolved by 1 mg tissue protein
was taken as a unit of activity [4], shown by U/ml.
The determination of SOD activity
The determination of SOD activity with the method of
xanthine oxidase Xanthine and xanthine oxidase reaction
system can produce superoxide anion free radical, which
oxidized hydroxylamine to form nitrite that demonstrated
to be purple when affected by chromogenic agent. The
absorbance was detected at 550 nm to calculate SOD
activity which was shown by U/mg protein. SOD kit used
in experiments was A001-1 (Nanjing Jiancheng Bioengi-
neering Institute).
The determination of GSH-Px activity
Glutathione peroxidase can promote H2O2 to react with
reduced type glutathione for generating oxidized gluta-
thione and water. The activity of glutathione peroxidase
can be shown by enzymatic reaction velocity. By mea-
suring the consumption of reduced type glutathione in
enzymatic reaction, enzyme activity can be obtained. In
reaction system, glutathione concentration decreased by
1 umol/L, which was an activity unit. In the experiment,
GSH-Px kit A005-1 was employed to determine [5]
(Nanjing Jiancheng Bioengineering Institute).
The determination of MDA content
The determination was by means of TBA (Thiobarbi-
turic Acid Test). MDA kit used in the experiments was
A003-1 (Nanjing Ji a ncheng B ioenginee ring Inst itute) .
The determination of total protein content in tis-
sues
By means of Coomassie brilliant blue protein deter-
mination kit A045-2 (Nanjing Jiancheng Bioengineering
Institute), the determination was conducted and shown
by mg/mL.
The statistical analysis
SPSS18.0 was used in statistical analysis, and th e data
was x ± SD, a = 0.05.
3. Results and Conclusion
According to the analysis of oxidization resistance activ-
ity data in vitro of raspberry flavone extraction, among
raspberry flavone crude extraction, raspberry flavone
extract and raspberry flavone purified matters, raspberry
flavone purified matters group has a greater ability in
scavenging hydroxyl, H2O2 and DPPH than the other two
ones. Therefore, raspberry flavone purified matters was
chosen to be the raw material of rats’ in vivo oxidization
resistance experiments to conduct analysis, while the re-
sults are as follows:
The results of rats’ liver oxidization resistance ac-
tivity
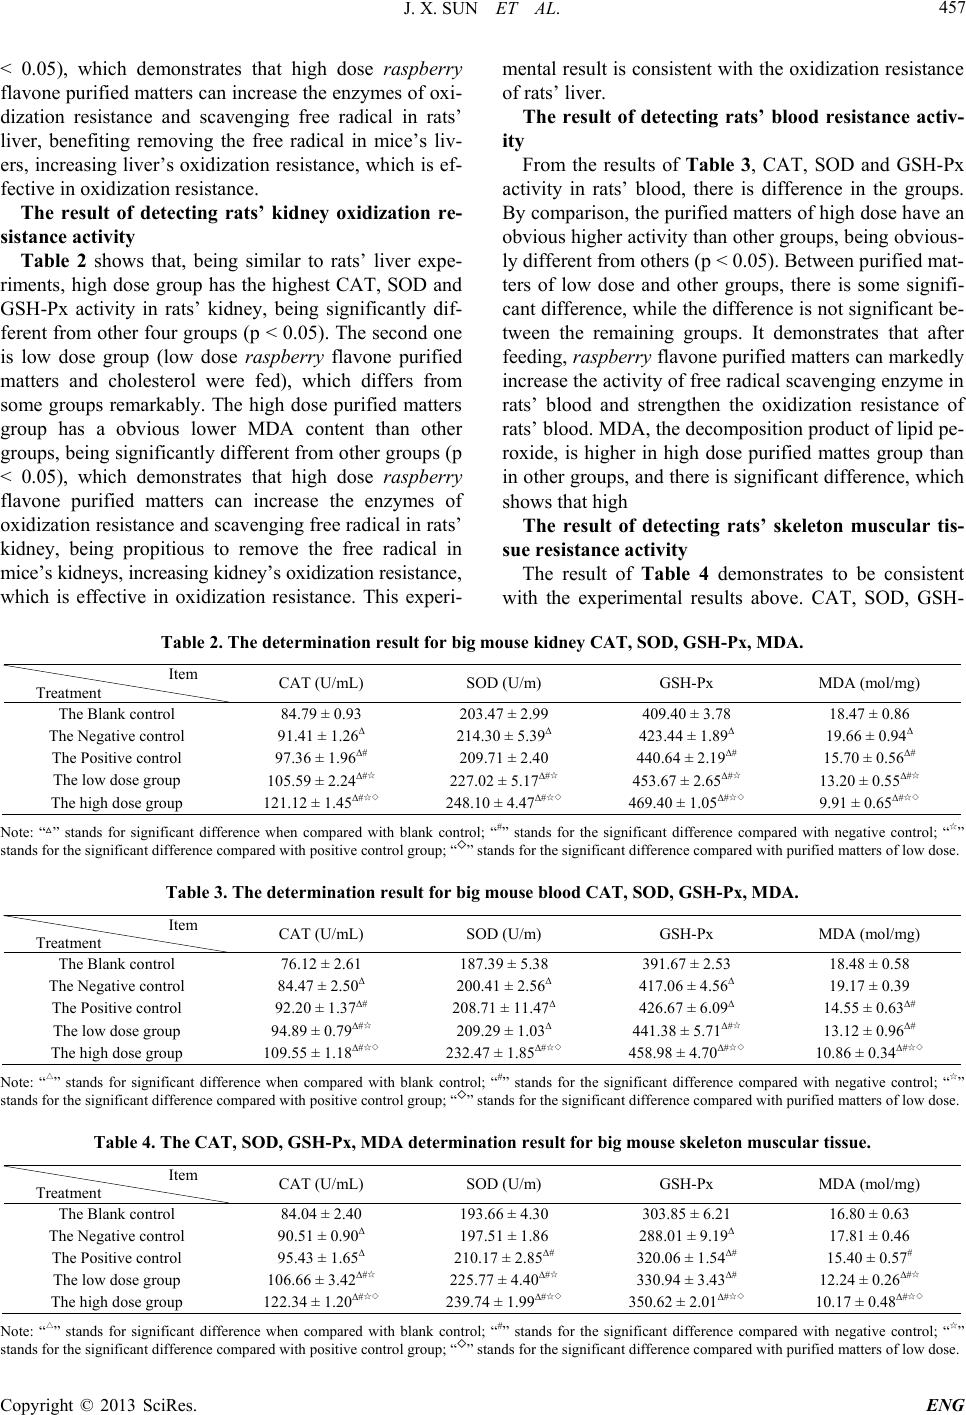
From Table 1, it can be seen that in rats’ liver tissues,
high dose group has the highest CAT, SOD and GSH-Px
activity (cholesterol and high dose raspberry flavon e pu-
rified matters were fed), being significantly different
from other four groups (p < 0.05); the second highest one
is low dose group (low dose raspberry flavone purified
matters and cholesterol were fed), which differs from
some groups remarkably. Between blank, positive and
negative groups, there is also some significance of dif-
ference, which is small. The high dose purified matters
group has an obvious higher MDA content than other
groups, being significantly different from other groups (p
Table 1. The determination result for big mouse liver CAT, SOD, GSH-Px, MDA.
CAT (U/mL) SOD (U/m) GSH-Px MDA (mol/mg)
The Blank control 45.57 ± 1.1 6 204.06 ± 1. 4 7 626.41 ± 5. 34 9.89 ± 0.4 3
The Negative control 53.58 ± 1.60Δ 212.25 ± 1.63Δ 638.70 ± 3.5 4 Δ 12.96 ± 0. 3 9Δ
The Positive control 59.09 ± 1.77Δ# 219. 0 6 ± 1.14Δ# 647.81 ± 3.85Δ# 7.23 ± 0. 2 9 Δ#
The low dose group 61.01 ± 1.55Δ# 229.92 ± 2.3 5Δ# 698.09 ± 4.76Δ# 6 .63 ± 0.08Δ#
The high dose g roup 69.19 ± 1.38Δ#☆◇ 243.75 ± 1.69Δ#☆◇ 718.25 ± 6.70Δ#☆◇ 4.21 ± 0.13Δ#☆◇
Note: “△” stands for the significant difference when compared with blank control; “#” stands for the significant difference compared with negative control; “☆”
stands f o r th e s i gnificant d i fference co mpar ed with p u r i fi ed matters of low dos e; “ ◇” s t an ds for the si gnificant difference compared wi t h purif i ed matt er s of low
dose.