Y.-J. ZHANG ET AL.
Copyright © 2013 SciRes. ENG
423
ence in COG analysis, because this part of data was used
in predicted proteomes analysis but could not be included
in the COGs analysis. Secondly, for His and Glu, the
disagreement might also due to the same reason. For
example, eukaryotic histone proteins possess especially
more His. Histone proteins were included in predicted-
proteome analysis but could not be included in COGs
analysis. Here we thought COGs analysis is relatively
more convincing when considering under macroevolutio-
nary time scale.
Our study gives a trend of charged AAs changes under
macroevolutionary time scale from prokaryotes to euka-
ryotes. More importantly, our findings provide the first
suggestion that total basic AAs and Lys increased on pro-
teins over macroevolutionary time scale to help proteins
carry more information, which lays a material basis for
the evolution of primary sequences and higher structures
complexity for proteins in eukaryotes. This study could
help to bet ter unde rs t a nd prote ins evolution.
5. Acknowledgements
This work was supported by grants from National Natu-
ral Science Foundation of China (No. 31200947), the
National Institute of Health (R01 AI095184), the Key
Scientific and Technological Project of Chongqing
(CSTC2012GG-YYJSB80002) and Par-Eu Scholars
Program.
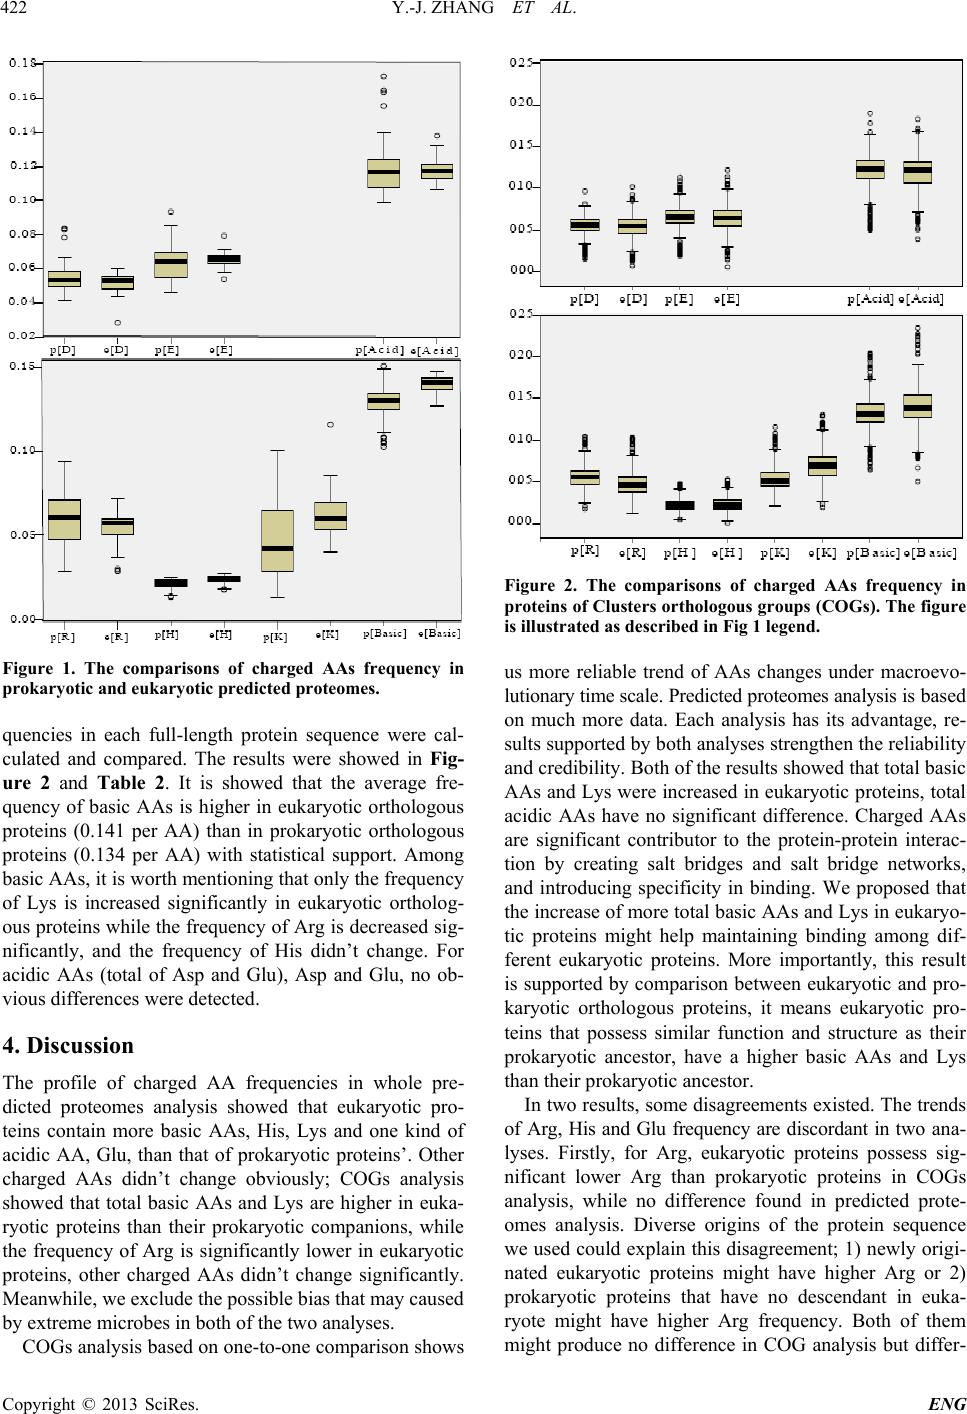
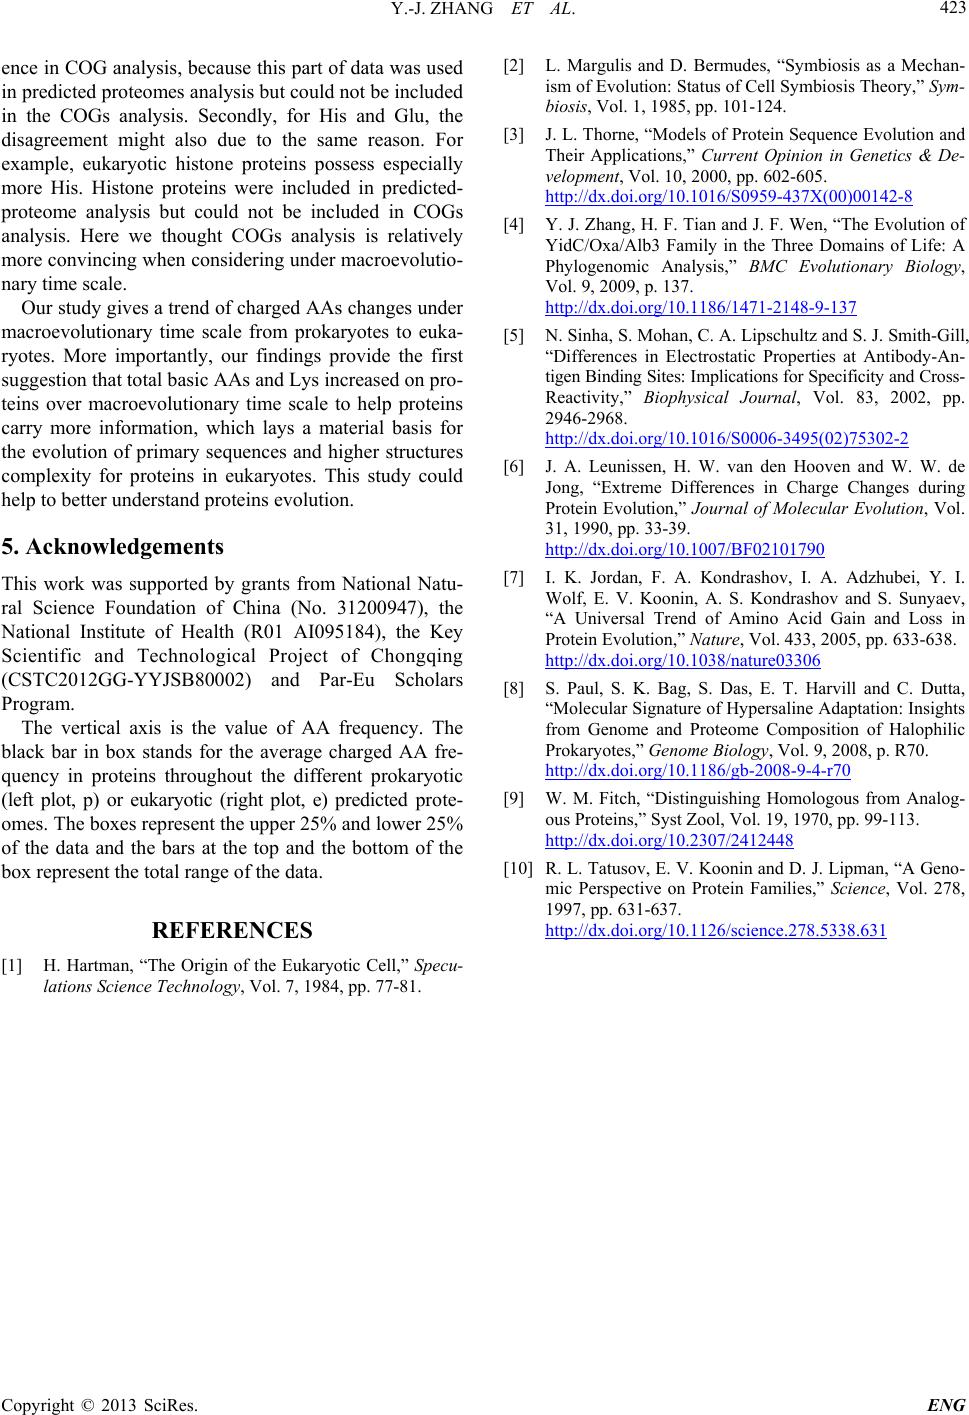
The vertical axis is the value of AA frequency. The
black bar in box stands for the average charged AA fre-
quency in proteins throughout the different prokaryotic
(left plot, p) or eukaryotic (right plot, e) predicted prote-
omes. The boxes rep resen t the upper 25 % and lower 25 %
of the data and the bars at the top and the bottom of the
box repres ent the total ran ge of the data.
REFERENCES
[1] H. Hartman, “The Origin of the Eukaryotic Cell,” Specu-
lations Science Technology, Vol. 7, 1984, pp. 77-81.
[2] L. Margulis and D. Bermudes, “Symbiosis as a Mechan-
ism of Evolution: Status of Cell Symbi osis Theory,” Sym-
biosis, Vol. 1, 1985, pp. 101-124.
[3] J. L. Thorne, “Models of Protein Sequence Evolution and
Their Applications,” Current Opinion in Genetics & De-
velopment, Vol. 10, 2000, pp. 602-605.
http://dx.doi.org/10.1016/S0959-437X(00)00142-8
[4] Y. J. Zhang, H. F. Tian and J. F. Wen, “The Evolution of
YidC/Oxa/Alb3 Family in the Three Domains of Life: A
Phylogenomic Analysis,” BMC Evolutionary Biology,
Vol. 9, 2009, p. 137.
http://dx.doi.org/10.1186/1471-2148-9-137
[5] N. Sinha, S. Mohan, C. A. Lipschultz and S. J. Smith-Gill,
“Differences in Electrostatic Properties at Antibody-An-
tigen Binding Sites: Implications for Specificity and Cross-
Reactivity,” Biophysical Journal, Vol. 83, 2002, pp.
2946-2968.
http://dx.doi.org/10.1016/S0006-3495(02)75302-2
[6] J. A. Leunissen, H. W. van den Hooven and W. W. de
Jong, “Extreme Differences in Charge Changes during
Protein Evolution,” Journal of Molecular Evolution, Vol.
31, 1990, pp. 33-39.
http://dx.doi.org/10.1007/BF02101790
[7] I. K. Jordan, F. A. Kondrashov, I. A. Adzhubei, Y. I.
Wolf, E. V. Koonin, A. S. Kondrashov and S. Sunyaev,
“A Universal Trend of Amino Acid Gain and Loss in
Protein Evolution,” Nature, Vol. 433, 2005, pp. 633-638.
http://dx.doi.org/10.1038/nature03306
[8] S. Paul, S. K. Bag, S. Das, E. T. Harvill and C. Dutta,
“Molecular Signature of Hypersaline Adaptation: Insights
from Genome and Proteome Composition of Halophilic
Prokaryotes,” Genome Biology, Vol. 9, 2008, p. R70.
http://dx.doi.org/10.1186/gb-2008-9-4-r70
[9] W. M. Fitch, “Distinguishing Homologous from Analog-
ous Proteins,” Syst Zool, Vol. 19, 1970, pp. 99-113.
http://dx.doi.org/10.2307/2412448
[10] R. L. Tatusov, E. V. Koonin and D. J. Lipman , “A Geno-
mic Perspective on Protein Families,” Science, Vol. 278,
1997, pp. 631-637.
http://dx.doi.org/10.1126/science.278.5338.631