 American Journal of Analytical Chemistry, 2013, 4, 749-755 Published Online December 2013 (http://www.scirp.org/journal/ajac) http://dx.doi.org/10.4236/ajac.2013.412091 Open Access AJAC Thermal Stability and Decomposition Kinetics of Polysuccinimide Li Zhang, Mingxing Huang, Cairong Zhou 1School of Chemical Engineering and Energy, Zhengzhou University, Zhengzhou, China Email: zhanglizibo@163.com, zhoucairong@zzu.edu.cn Received November 5, 2013; revised December 1, 2013; accepted December 9, 2013 Copyright © 2013 Li Zhang et al. This is an open access article distributed under the Creative Commons Attribution License, which permits unrestricted use, distribution, and reproduction in any medium, provided the original work is properly cited. ABSTRACT The thermal stability and decomposition kinetics of polysuccinimide (PSI) were investigated using analyzer DTG-60 under high purity nitrogen atmosphere at different heating rates (3, 6, 9, 12 K/min). The thermal decomposition mecha- nism of PSI was determined by Coats-Redfern method. The kinetic parameters such as activation energy (E), pre-ex- ponential factor (A) and reaction order (n) were calculated by Flynn-Wall-Ozawa and Kissinger methods. The results show that the thermal decomposition of PSI under nitrogen atmosphere mainly occurs in the temperature range of 619.15 - 693.15 K, the reaction order (n) was 3 4, the activation energy (E) and pre-exponential factor (A) were ob- tained to be 106.585 kJ/mol and 4.644 × 10⁹ min−1, the integral and differential forms of the thermal decomposition mechanism of PSI were found to be 34 ln 1 and 14 41ln1 3 , respectively. The results play an important role in understanding the thermodynamic properties of polysuccinimide. Keywords: Polysuccinimide; Thermal Gravimetric Analysis; Thermal Stability; Decomposition Kinetics 1. Introduction Polyaspartic acid (PASP, CAS181828-06-8) has amino and carboxyl groups, which belongs to the biological macromolecule material and is a kind of polymer of amino acids. Since it has the characteristics of good bio- compatibility and biodegradability, PASP has been widely used in industrial and medical fields as a new type of green chemicals [1]. Polysuccinimide (PSI, CAS6899- 03-2) is the intermediate of PASP. The experimental formula and relative molecular mass of its monomer are C4H3O2N and 97.074 g/mol, respectively. The chemical structure of the monomer can be written as: H2NCH C C CH2 O O N n CH C CH2C O O NCHC CH2C O O OH OH In view of this, PSI is a kind of linear polyimide with high activity and it is easy to open ring changing into poly asparagine with side chains. With the special prop- erty, many kinds of derivatives that were used as drug carriers have been prepared [2]. The thermal stability and decomposition kinetics of Polysuccinimide (PSI) were investigated by TG-DTA method. Kinetic parameters such as activation energy (E) and pre-exponential factor (A) were calculated by Flynn- Wall-Ozawa (F-W-O) and Kissinger methods. The ki- netic mechanism function of thermal decomposition of PSI was established by Coats-Redfern method. Using TG-DTA method to study the stability of drugs has the advantages of less sample dose, short experimental pe- riod and reliable results. These data not only play an ac- tive role in understanding the thermodynamic properties of PSI but also provide a theoretical basis for practical application. 2. Experimental 2.1. Materials and Instruments Polysuccinimide (the mass fraction was higher than 99.5%) was purchased from Henan Xinlianxin Fertilizer Limited 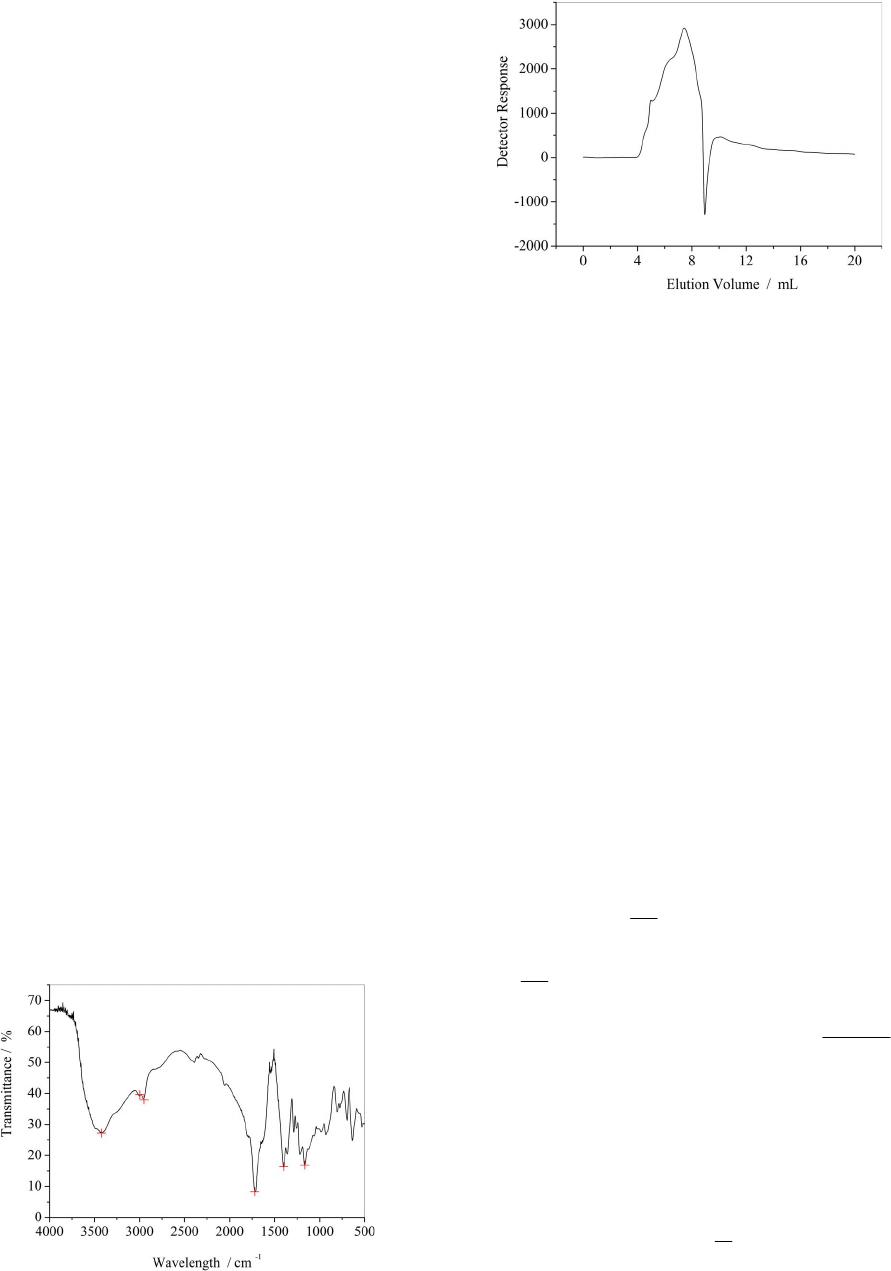 L. ZHANG ET AL. 750 Co. α-Al2O3 (standard material, Shimadu Company in Japan) was used as standard material in the process of thermal analysis. The TG-DTA analyzer (type DTG-60, Shimadzu Cor- poration, Japan) was used to determine the TG-DTA curves of the sample. SPN-500-type nitrogen generator (Hewleet-Packard, Beijing Institute of Technology, China) was used to provide a high purity nitrogen atmosphere for the experimental system of thermal analysis. Fourier Transform Infrared Spectrometer (type WQF, Beijing Beifen-Ruili Analytical Instrument (Group) Co, Ltd) was used to analyze PSI. Gel permeation chromatography (type Agilent1100, Agilent Corporation, America) was used to analyze PSI’s purity and the number-average molecular weight (Mn) and polydispesity index (Mw/Mn). 2.2. Experiment Methods The PSI sample was dried in the vacuum oven at 378.15 K before analysis. The thermogravimetric measurements were carried out at different heating rates (3, 6, 9, 12 K/min) from room temperature to 873.15 K under high purity nitrogen atmosphere (20 ml/min). Mass of each powdered sample was about 4 - 5 mg. 2.3. Characterization of PSI 2.3.1. FTIR Analysis of PSI FTIR spectra of PSI were recorded in the wave number range of 4000 - 500 cm−1. The result is shown in Figure 1. From Figure 1, we can know that the carboxyl group of branched chain in the opened ring appears at 1400 cm−1, the carbon-carbon bond appears at 1165 cm−1, the coupled carbonyl group appears at 1720 cm−1 and the carbonyl group in the ring obviously appears at 1797 cm−1. 2.3.2. Gel Per m eat ion Chromatography A nalysis of PSI The analysis diagram of PSI by gel permeation chroma- tography is shown in Figure 2. The analysis results show Figure 1. FTIR spectra of PSI. Figure 2. The analysis diagram of PSI by gel permeation chromatography. that the number-average molecular weight (Mn) of PSI is 2.7941 × 10⁴ g/mol, the polydispersity index of relative molecular mass (Mw/Mn) of PSI is 21.644 and Polymeri- zation degree of PSI is obtained to be 287.5. 2.4. Theoretical Analysis There are two major categories to study the thermal de- composition kinetics of polymer, which are differential method and integral method. The differential method contains Kissinger [3-5], Caroll-Freeman [6] and Fried- man [7] methods while Coats-Redfern [8-12], Doyle [13] and Flynn-Wall-Ozawa (F-W-O) [14-16] methods belong to the integral method. Coats-Redfern, Flynn-Wall-Ozawa (F-W-O) and Doyle methods are usually used for inves- tigating thermal decomposition kinetics of polymers. In general, the thermal decomposition of a solid poly- mer under inert atmosphere can be summarized as: Bsolid → Csolid + Dgas. Polymer is finally decomposed into solid residue (C) and gaseous matter (D). The kinetic analysis of solid-state sample is usually given by Equation (1) [17] d d rKTf t (1) where d dt is the rates of conversion; is the con- version degree that can be defined as ot of mm mm in which m0 and mf are the initial and final masses of the sample, respectively; mt is the mass of the sample at time t (or temperature T) of the decomposition process, mg. In Equation (1), is the temperature dependent rates constant and is normally assumed to obey the Arrhenius equation: ()kT e T kT A (2) where A is the pre-exponential factor (min−1), E is the Open Access AJAC  L. ZHANG ET AL. Open Access AJAC 751 activation energy (kJ/mol) of the kinetic process, R is the gas constant (8.314 J/(mol·K)) and T is the absolute tem- perature (K). is approximately constant when the values of α are the same at the different heating rates βi, so it is easy to ob- tain values of E by plotting lgβ against 1/T at the certain conversion degree α. Moreover, taking into account the heating rates β = dT/dt under non-isothermal condition, d dt can be de- 2.4.3. Coats- R edfern Method Coats-Redfern method can be described as Equation (7). [8-10,12]: scribed by Equation (3): ddd d ddd d T tTt T (3) 2 lnln c ii i gc RE ERT T (7) Equation (4) can be obtained by combing Equations (1)-(3), which describes the thermal decomposition ki- netics. Based on TGA data, the kinetic parameters can be calculated from Equation (4). [18]: where g(α) comes from one of 34 forms of integral for- mula in the literature which are shown in Table 1 [11]. From Equation (7), the values of both Ec and Ac can be obtained for any selected g(α) and fixed βi (i = 1, 2, 3, 4, even more). The calculating steps in detail are: 1) choose the same αj for each heating rates βi and calculate the corresponding g(αij); 2) give the corresponding tempera- de d E RT aA f t (4) ture Tij according to αij; 3) describe the sketch of 2 ln i g T 2.4.1. Kiss i ng er Method The formula of Kissinger method is given by Equation (5) [3-5]: versus 1/Ti for each fixed βi, and calculate the values of both Ec and ln(Ac) according to the slope and intercept of the line, respectively; 4) determine the mechanism func- tion of the thermal decomposition process. Generally, the selected mechanism functions should meet all the condi- tions, which are: 1) 0 < Ec < 400 kJ/mol; 2) 2 1 ln ln ikk kp pi AR E ERT T i (5) where i = 1, 2, 3, 4 (or even more); Tpi is the peak tem- peratures of different DTA curve at different heating rates. By plotting 2 ln ipi T versus 1/Tpi, the activation energy Ek and pre-exponential factor Ak can be calculated based on its slope (−Ek/R) and intercept ln(AkR/Ek), re- spectively. 00 0.3 c EEE where E0 come from F-W-O method 3) ln lnln0.3 ckc AAA in which ln(Ak) are ob- tained from Kissinger method. If g(α) meet the require- ments mentioned above, g(α) can be regarded as the probable mechanism function for the thermal decomposi- tion process. 2.4.2. Flynn-Wall-Ozawa (F-W-O) Method F-W-O method can be used directly to calculate the acti- vation energy E. The integral formula of F-W-O method [14-16] is showed in Equation (6): lglg2.315 0.4567 E Rg RT E (6) 2.5. Determination of High Temperature Heat-Resistance of PSI In Equation (6), since the value of lg AE Rg The activation energy data obtained by above-mentioned methods can be used to evaluate the high temperature heat-resistance of PSI. The relationship between activa- Table 1. 34 types of thermal decomposition mechanism functions. NO g(α) N O g(α) 1 - 6 111 3 ,,,1,2, 432 2 nn 27 1 11 7 1ln1 28 12 1 8 32 2 11 3 29 2 1 9 - 19 111223 3 ln1, ,, , , ,1, ,2,3,4 2435342 nn 30 - 31 12 1 11 ,2 2 n n 20 - 25 111 11 ,,,2,3,4 432 nn 32 - 33 13 1 11 ,2 2 n n 26 1 1 34 2 13 11 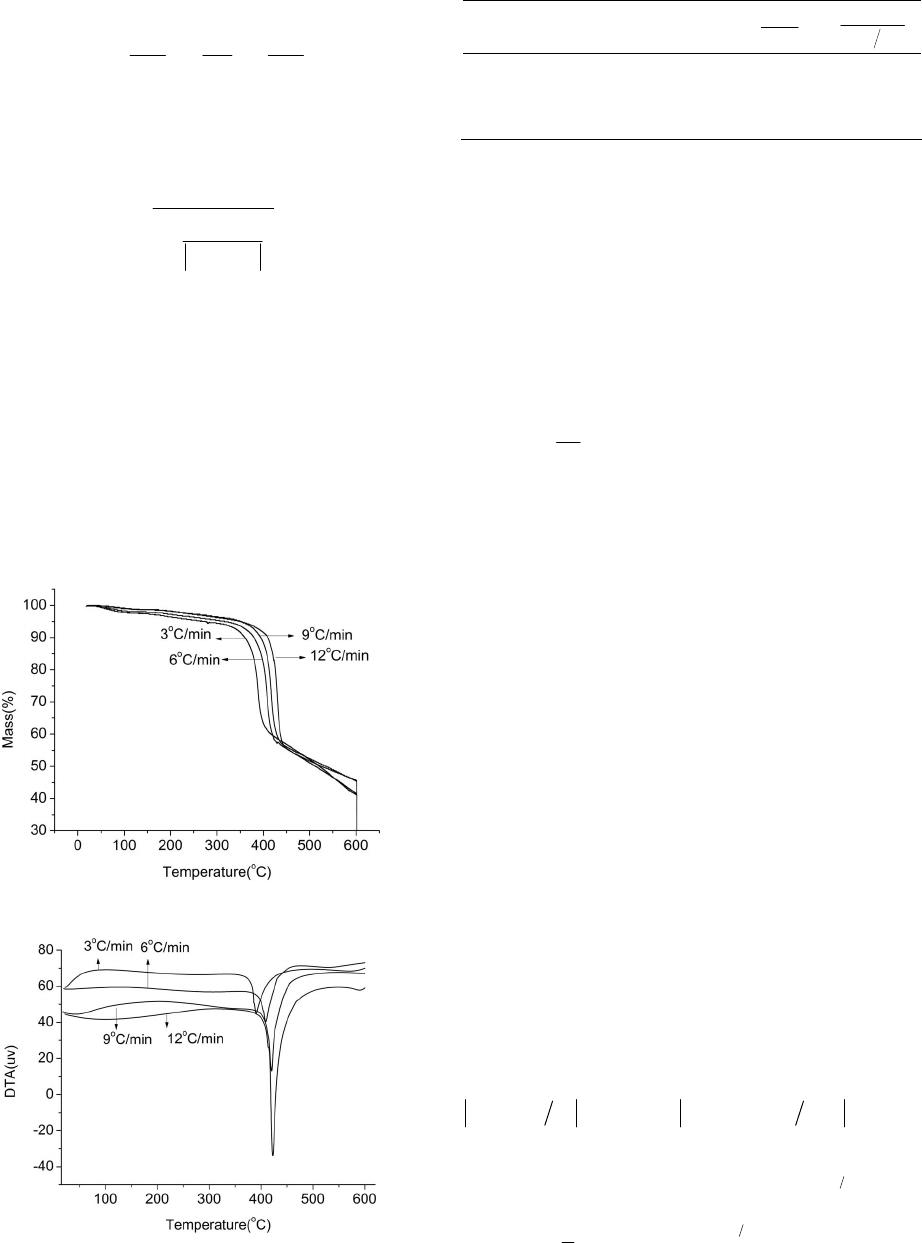 L. ZHANG ET AL. 752 tion energy and lifetime of polymer can be expressed by Equation (8) [19]: ln ln f f EEE tP RTR RT (8) where tf is the lifetime of PSI at the temperature of Tf, Tα is the temperature at the conversion degree α. Combined Equations (4) and (8), Tf can be shown as: 1 ln ln 1 f f ER TAt (9) 3. Results and Discussion 3.1. Thermal Decomposition of PSI TG and DTA curves of PSI sample are shown in Figures 3 and 4. The thermal analysis data are summarized in Table 2. In Figure 3, the thermal decomposition tem- perature at different heating rates increases with the in- creasing of . That indicates the decomposition tem- perature is affected by the heating rate . Besides, each TG curve of PSI under nitrogen atmosphere has an ob- vious mass loss process where percentage of mass loss Figure 3. The TG curves of PSI in nitrogen atmosphere. Figure 4. The DTA curves of PSI in nitrogen atmosphere. Table 2. Basic data of kinetics of PSI from TG. β/(K·min−1)Tp/K (1/Tp)/K−1 FWO ln 2 Kissinger ln p T 3 663.94 0.001516 1.099 −11.898 6 682.76 0.001473 1.792 −11.261 9 693.17 0.001451 2.197 −10.885 12 696.97 0.001444 2.485 −10.609 increases gradually with the increasing of heating rates and TG curve moves toward to the right. From Figures 3 and 4, the thermal decomposition of PSI under nitrogen atmosphere mainly occurs in the temperature range of 619.15 to 693.15 K. Mass loss is accompanied by heat absorption, so thermal decomposi- tion process and solid rearrangement reaction may si- multaneously happen in this process. 3.2. Non-Isothermal Kinetic of PSI Plots of 2 ln T against 1/Tp of PSI by Kissinger method is shown in Figure 5. The values of activation energy Ek and exponential factor ln(Ak) calculated by Kissinger method are 143.874 kJ/mol and 23.897 min1, respec- tively. The linear correlation coefficient (R2) is 0.9852. The activation energies calculated at different conver- sion degree using Flynn-Wall-Ozawa method are shown in Table 3 and the relationship between E0 and conver- sion degree α are showed in Figure 6. The results show that the correlation coefficients (R2) of FWO method is better, the values of activation energy is between 81.509 and 122.205 kJ/mol and increase with the increasing of conversion degree. From Table 3 and Figure 6, the average value of activation energy Eo is 104.202 kJ/mol and the pre-exponential factor lgAo is 9.967. The kinetic parameters calculated by Coats-Redfern method are listed in Table 4. The values of activation energy and exponential factor calculated by Coats-Red- fern method compare respectively with the average value of activation energy calculated using FWO method and the value of pre-exponential factor obtained by Kissinger method, the results are listed in Table 5. The thermal decomposition process of PSI in the tem- perature stage of 619.15 to 693.15 K is consistent with the sequence number 14 in Table 1, this is because Ec and ln(Ac) meet better with the conditions of both 00 0.3 c EEE and ln lnln0.3 ckc AAA than others; besides, the relative coefficients (R2) are much better. The integral and differential forms of the mechanism function are 34 ln 1g and 14 41ln1 3 f , respectively. The Open Access AJAC 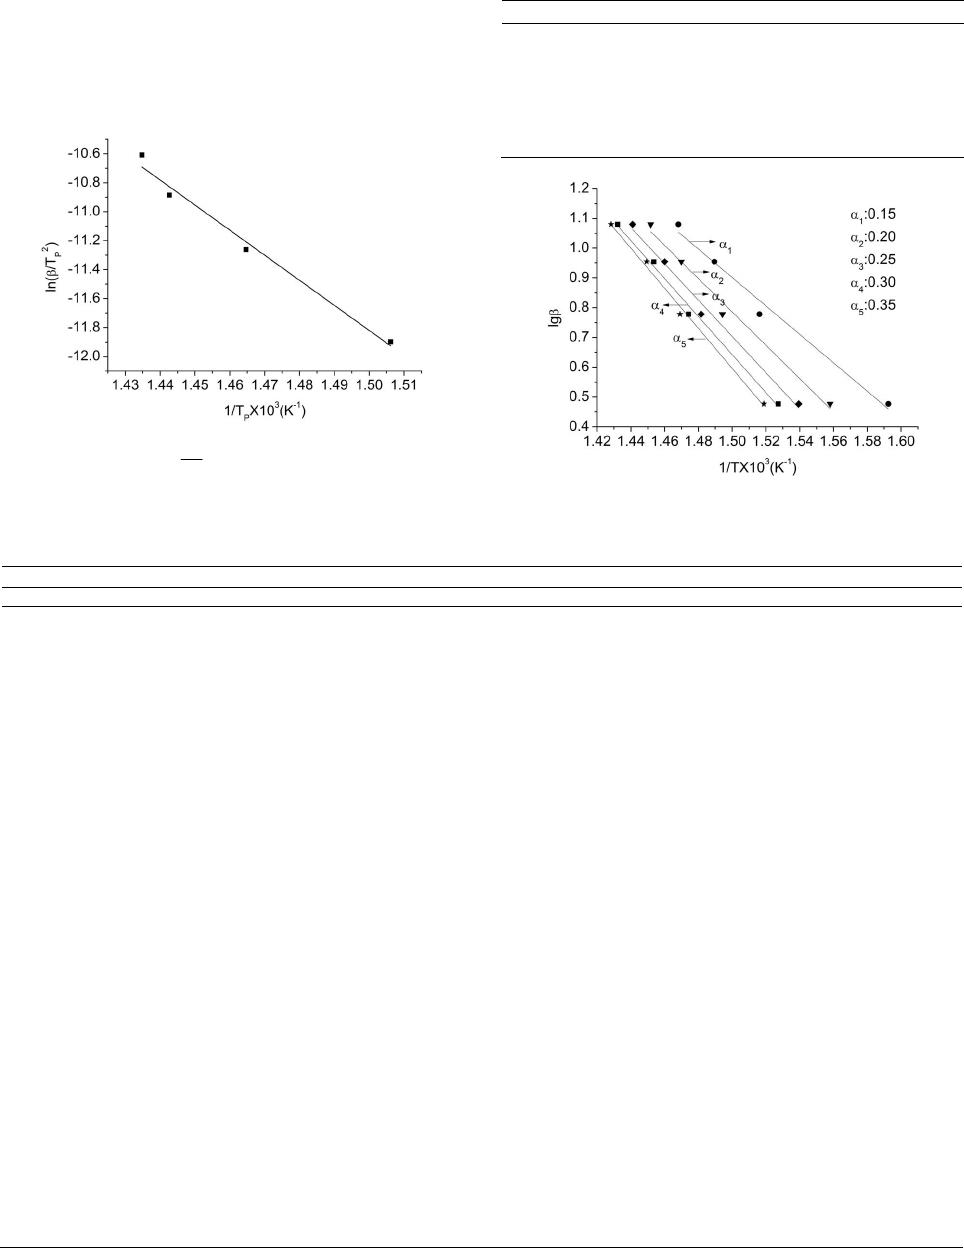 L. ZHANG ET AL. 753 values of Ec and ln(Ac) are obtained to be 108.967 kJ/mol and 16.802 min−1. So the activation energy and pre-ex- ponential factor of thermal decomposition process of PSI can be regarded as 106.585 kJ/mol and 4.644 × 10⁹ min−1 (i.e. average values obtained by the Coats-Redfern and FWO methods). The thermal decomposition kinetic equa- tion of PSI can be described as: Figure 5. Plots of T2 ln and 1/Tp of PSI of Kissinger method. Table 3. The activation energy Eo and exponential factor lgAo of PSI. α E o(kJ/mol) lgAo(min−1) R2 0.15 81.509 8.134 0.9853 0.20 95.987 9.285 0.9895 0.25 106.373 10.131 0.9885 0.30 114.936 10.839 0.9902 0.35 122.205 11.447 0.9912 Mean* 104.202 9.967 0.9889 Figure 6. FWO curves of PSI at different conversion. Table 4. Results of 34 ty pe s of kinetic equations of PSI calculate d with Coats-Redfern method. β = 3 K/min β = 6 K/min β = 9 K/min β = 12 K/min No Ec/(kJ·mol−1) lnAc R2 Ec/(kJ·mol−1) lnAc R2 Ec/(kJ·mol−1)lnAc R2 Ec/(kJ·mol−1) lnAc R2 1 12.759 −2.491 0.926 25.349 0.969 0.94826.880 1.676 0.95131.494 2.782 0.969 2 20.575 −0.678 0.948 37.511 3.417 0.95739.043 4.106 0.95945.789 5.520 0.976 3 36.204 2.558 0.961 61.836 8.030 0.96463.367 8.703 0.96574.378 10.733 0.982 4 83.094 11.400 0.970 134.812 21.146 0.970136.341 21.806 0.970160.144 25.684 0.986 5 176.872 28.178 0.973 280.755 46.555 0.972282.285 47.209 0.972331.679 54.781 0.987 6 129.981 19.859 0.972 207.783 33.917 0.971209.313 34.573 0.971245.912 40.298 0.987 7 185.510 29.230 0.971 294.174 48.401 0.970295.704 49.054 0.970347.600 56.992 0.986 8 71.090 8.701 0.977 116.155 17.352 0.977117.685 18.013 0.977138.012 21.381 0.990 9 43.011 4.068 0.954 72.413 10.150 0.95773.945 10.820 0.95886.931 13.140 0.976 10 16.162 −1.586 0.922 30.638 2.140 0.94132.169 2.837 0.94437.771 4.089 0.964 11 25.112 0.413 0.941 44.563 4.898 0.95046.094 5.581 0.95254.157 7.189 0.971 12 32.272 1.911 0.948 55.703 7.028 0.95457.234 7.704 0.95567.267 9.597 0.974 13 60.910 7.532 0.959 100.267 15.243 0.960101.797 15.907 0.960119.705 18.940 0.979 14 69.859 9.227 0.960 114.193 17.756 0.961115.723 18.418 0.961136.092 21.807 0.979 15 96.708 14.227 0.963 155.962 25.218 0.962157.492 25.876 0.963185.253 30.333 0.981 16 150.400 24.018 0.965 239.518 39.948 0.964241.048 40.603 0.964283.574 47.195 0.982 17 204.100 33.672 0.966 323.065 54.547 0.965324.595 55.201 0.965381.895 63.929 0.983 18 311.492 52.793 0.967 490.168 83.565 0.966491.698 84.218 0.966578.538 97.216 0.983 19 418.884 71.787 0.968 657.272 112.4600.966 658.801 113.1110.966 775.181 130.3780.983 20 93.175 12.110 0.965 150.483 22.778 0.964152.013 23.437 0.965178.743 27.744 0.982 21 92.019 12.158 0.965 148.679 22.720 0.965150.209 23.379 0.965176.606 27.637 0.983 22 89.733 12.089 0.966 145.129 22.442 0.966146.659 23.101 0.966172.383 27.261 0.983 23 70.820 9.515 0.977 115.731 18.140 0.977117.261 18.802 0.977137.522 22.161 0.990 24 59.848 7.583 0.983 98.679 15.209 0.983100.209 15.873 0.983117.319 18.771 0.994 25 50.119 5.764 0.989 83.547 12.505 0.98985.077 13.172 0.99099.419 15.665 0.997 26 17.893 −0.548 0.787 33.271 3.307 0.83334.802 4.001 0.84341.333 5.412 0.876 27 111.674 17.306 0.956 179.217 29.666 0.955180.746 30.323 0.956212.872 35.419 0.976 28 3.604 −4.956 0.378 11.067 −1.911 0.68912.597 −1.133 0.73514.972 −0.329 0.761 29 46.471 6.017 0.861 77.680 12.390 0.87179.211 13.059 0.87594.056 15.685 0.908 30 39.523 2.951 0.957 66.993 8.721 0.96168.525 9.392 0.96180.498 11.564 0.979 31 190.149 29.474 0.970 301.391 49.070 0.968302.921 49.724 0.969356.163 57.858 0.985 32 40.667 3.002 0.956 68.771 8.874 0.95970.302 9.545 0.96082.608 11.765 0.978 33 194.722 29.587 0.969 308.499 49.601 0.967310.029 50.256 0.967364.602 58.585 0.984 34 164.725 23.498 0.975 261.874 40.758 0.974263.404 41.414 0.974309.331 48.480 0.989 Open Access AJAC  L. ZHANG ET AL. 754 Table 5. Calculation of 6 types of kinetics equations for PSI with Coats-Redfern method. Sequence number of mechanism function g β K/mol Ec kJ/mol lnAc min−1 R2 oc o EE E ln ln ln ck k A A 4 3 83.094 11.400 0.970 0.203 0.523 4 6 134.812 21.146 0.970 0.294 0.115 4 9 136.341 21.806 0.970 0.308 0.088 4 12 160.144 25.684 0.986 0.537 0.075 8 3 71.090 8.701 0.977 0.318 0.636 8 6 116.155 17.352 0.977 0.115 0.274 8 9 117.685 18.013 0.977 0.129 0.246 8 12 138.012 21.381 0.990 0.324 0.105 13 3 60.91 7.532 0.959 0.415 0.685 13 6 100.267 15.243 0.960 0.038 0.362 13 9 101.797 15.907 0.960 0.023 0.334 13 12 119.705 18.940 0.979 0.149 0.207 14 3 69.859 9.227 0.960 0.330 0.614 14 6 114.193 17.756 0.961 0.096 0.257 14 9 115.723 18.418 0.961 0.111 0.229 14 12 136.092 21.807 0.979 0.306 0.087 23 3 70.82 9.515 0.977 0.320 0.602 23 6 115.731 18.140 0.977 0.111 0.241 23 9 117.261 18.802 0.977 0.125 0.213 23 12 137.522 22.161 0.990 0.320 0.073 24 3 59.848 7.583 0.983 0.426 0.683 24 6 98.679 15.209 0.983 0.053 0.364 24 9 100.209 15.873 0.983 0.038 0.336 24 12 117.319 18.771 0.994 0.126 0.215 334 9106.585 10 d4.64410 e1 d RT t (10) 3.3. High Temperature Heat-Resistance of PSI Selecting tf = 60 s and α = 15% as the evaluation indexes of the high temperature heat-resistance of the polymer. According to Equation (12), value of Tf of PSI in nitro- gen atmosphere is 259.27˚C. The result shows that the high temperature heat-resistance of PSI is not very well. 4. Conclusion The thermal behavior of polysuccinimide under non- isothermal condition was investigated using TG-DTA method at different heating rates in nitrogen atmosphere. The results show that the thermal decomposition of PSI under nitrogen atmosphere mainly occurs in the tem- perature range of 619.15 - 693.15 K, the reaction order (n) was 3/4, the activation energy (E) and pre-exponential factor (A) were obtained to be 106.585 kJ/mol and 4.644 × 10⁹ min−1, the integral and differential forms of the thermal decomposition mechanism of PSI were found to be 34 ln 1 and 14 41ln1 3 , re- spectively. REFERENCES [1] A. W. Yang, G. P. Cao and M. H. Zhang, “Synthesis of Polysuccinimide and Determination of the Intrinsic Vis- cosity,” Polymer Materials Science & Engineering, Vol. 26, 2010, pp. 4-7. [2] J. H. Jeong, H. S. Kang, S. R. Yang and J. D. Kim, “Polymer Micelle-Like Aggregates of Novel Amphiphilic Biodegradable Poly(Asparagine) Grafted with Poly(Ca- prolactone),” Polymer, Vol. 44, No. 3, 2003, pp. 583-591. http://dx.doi.org/10.1016/S0032-3861(02)00816-9 [3] A. Rotaru, M. Anca, G. Popa, P. Rotaru and E. Segal, “Non-Isothermal Kinetics of 2-Allyl-4-((4-(4-Methylben- zyloxy)Phenyl) Diazenyl) Phenol in Air Flow,” Journal of Thermal Analysis and Calorimetry, Vol. 97, No. 2, 2009, pp. 485-491. http://dx.doi.org/10.1007/s10973-009-0214-1 [4] H. E. Kissinger, “Variation of Peak Temperature with Heating Rate in Different Rate in Differential Thermal Analysis,” Journal of Research of the National Bureau of Standards, Vol. 57, No. 4, 1956, pp. 217-221. http://dx.doi.org/10.6028/jres.057.026 [5] H. E. Kissinger, “Reaction Kinetic in Differential Ther- mal Analysis,” Analytical Chemistry, Vol. 29, No. 11, 1957, pp. 1702-1706. http://dx.doi.org/10.1021/ac60131a045 [6] E. S. Freeman and B. Carroll, “The Application of Ther- moanalytical Technique to Reaction Kinetics,” Journal of Physical Chemistry, Vol. 3, 1958, pp. 394-397. [7] H. L. Friedman, “Kinetics and Gaseous Products of Ther- mal Decomposition of Polymers,” Journal of Macromo- lecular Science: Part A—Chemistry, Vol. 1, No. 1, 1967, pp. 57-59. http://dx.doi.org/10.1080/10601326708053917 [8] A. W. Coats and J. P. Redfern, “Kinetic Parameters from Thermogravimetric Data,” Nature, Vol. 201, 1964, pp. 68-69. http://dx.doi.org/10.1038/201068a0 Open Access AJAC  L. ZHANG ET AL. 755 [9] C. R. Zhou, Q. H. Li and H. F. Wang, “Thermal Analysis for the Thermal Decomposition of Methylsulfonate Tin,” Journal of Chemical Engineering of Chinese Universities, Vol. 20, 2006, pp. 669-672. [10] C. R. Zhou, X. H. Shi, H. F. Wang and D. G. Jiang, “Thermal Decomposition and the Non-Isothermal De- composition Kinetics of DL-2-Naproxen,” Journal of Chemical Engineering of Chinese Universities, Vol. 25, 2011, pp. 442-446. [11] L. G. Lu, Q. Zhang, X. N. Xu, X. L. Dong and D. W. Wang, “Thermal Degradation Kinetics of Novel Intu- mescent Flame Retardant Polypropylene,” China Plastics, Vol. 23, 2009, pp. 53-60. [12] C. Y. Ou, C. H. Zhang, S. D. Li, L. Yang and J. J. Dong, “Thermal Degradation Kinetics of Chitosan-Cobalt Com- plex as Studied by Thermogravimetric Analysis,” Car- bohydrate Polymers, Vol. 82, No. 4, 2010, pp. 1284-1289. http://dx.doi.org/10.1016/j.carbpol.2010.07.010 [13] C. D. Doyle, “Kinetic Analysis of Thermogravimetric Data,” Journal of Applied Polymer Science, Vol. 5, No. 15, 1961, pp. 285-292. http://dx.doi.org/10.1002/app.1961.070051506 [14] T. Ozawa, “Kinetic Analysis of Derivative Curves in Thermal Analysis,” Journal of Thermal Analysis, Vol. 2, No. 3, 1970, pp. 301-310. http://dx.doi.org/10.1007/BF01911411 [15] F. X. Chen, C. R. Zhou and G. P. Li, “Study on Thermal Decomposition and the Non-Isothermal Decomposition Kinetics of Glyphosate,” Journal of Thermal Analysis and Calorimetry, Vol. 109, No. 3, 2012, pp. 1457-1462. [16] Q. F. Wang, L. Wang, X. W. Zhang and Z. T. Mi, “Ther- mal Stability and Kinetic of Decomposition of Nitrated HTPB,” Journal of Hazardous Materials, Vol. 172, No. 2-3, 2009, pp. 1659-1664. http://dx.doi.org/10.1016/j.jhazmat.2009.08.040 [17] C. D. Gamlin, N. K. Dutta, N. R. Choudhury, D. Kehoe and J. Matisons, “Evaluation of Kinetic Parameters of Thermal and Oxidative Decomposition of Base Oils by Conventional, Isothermal and Modulated TGA, and Pres- sure DSC,” Thermochimica Acta, Vol. 392-393, 2002, pp. 357-369. http://dx.doi.org/10.1016/S0040-6031(02)00121-1 [18] X. Y. Li, Y. Q. Wu, D. H. Gu and F. X. Gan, “Thermal Decomposition Kinetics of Nickel(II) and Cobalt(II) Azo Barbituric Acid Complexes,” Thermochimica Acta, Vol. 493, No. 1-2, 2009, pp. 85-89. http://dx.doi.org/10.1016/j.tca.2009.04.010 [19] Z. W. Zhou and Q. X. Wu, “Studies on Thermal Proper- ties of Poly(Phenylene Sulfide Amide),” Journal of Ap- plied Polymer Science, Vol. 66, No. 7, 1997, pp. 1227- 1230. http://dx.doi.org/10.1002/(SICI)1097-4628(19971114)66: 7<1227::AID-APP2>3.0.CO;2-I Open Access AJAC
|