H. de la FUENTE-MELLA ET AL.
Open Access
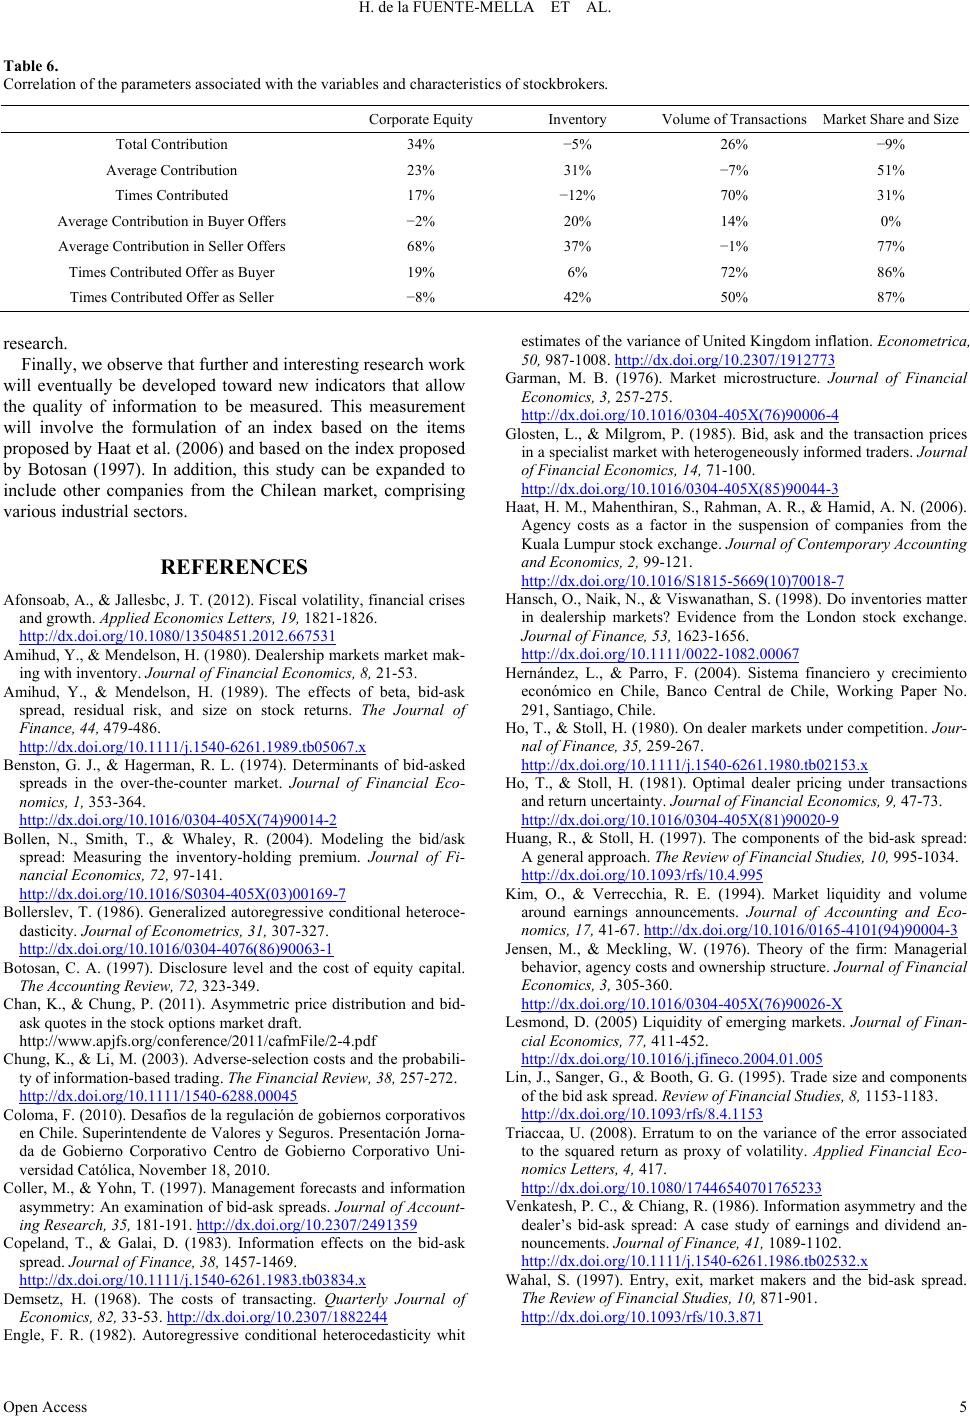
Table 6.
Correlation of the parameters associated with the variables and characteristics of stockbrokers.
Corporate Equity Inventor y Volume of Transactions Market Share and Size
Total Contribution 34% −5% 26% −9%
Average Contributi on 23% 31% −7% 51%
Times Contributed 17% −12% 70% 31%
Average Contributi on in Buyer O f fers −2% 20% 14% 0%
Average Contributi on in Seller Off ers 68% 37% −1% 77%
Times Contributed Offer as Buyer 19% 6% 72% 86%
Times Contributed Offer as Seller −8% 42% 50% 87%
research.
Finally, we observe that further and interesting research work
will eventually be developed toward new indicators that allow
the quality of information to be measured. This measurement
will involve the formulation of an index based on the items
proposed by Haat et al. (2006) and based on the index proposed
by Botosan (1997). In addition, this study can be expanded to
include other companies from the Chilean market, comprising
various industrial sectors.
REFERENCES
Afonsoab, A., & Jallesbc, J. T. (2012). Fiscal volatility, finan cial crises
and growth. Applied Economics Letters, 19, 1821-1826.
http://dx.doi.org/10.1080/13504851.2012.667531
Amihud, Y., & Mendelson, H. (1980). Dealership markets market mak-
ing with inventory. Journal of Financial Economics, 8, 21-53.
Amihud, Y., & Mendelson, H. (1989). The effects of beta, bid-ask
spread, residual risk, and size on stock returns. The Journal of
Finance, 44, 479-486.
http://dx.doi.org/10.1111/j.1540-6261.1989.tb05067.x
Benston, G. J., & Hagerman, R. L. (1974). Determinants of bid-asked
spreads in the over-the-counter market. Journal of Financial Eco-
nomics, 1, 353-364.
http://dx.doi.org/10.1016/0304-405X(74)90014-2
Bollen, N., Smith, T., & Whaley, R. (2004). Modeling the bid/ask
spread: Measuring the inventory-holding premium. Journal of Fi-
nancial Economics, 72, 97-141.
http://dx.doi.org/10.1016/S0304-405X(03)00169-7
Bollerslev, T. (1986). Generalized autoregressive conditional heteroce-
dasticity. Journal of Econometrics, 31, 307-327.
http://dx.doi.org/10.1016/0304-4076(86)90063-1
Botosan, C. A. (1997). Disclosure level and the cost of equity capital.
The Accounting Review, 72, 323-349.
Chan, K., & Chung, P. (2011). Asymmetric price distribution and bid-
ask quotes in the stock options market draft.
http://www.apjfs.org/conference/2011/cafmFile/2-4.pdf
Chung, K., & Li, M. (2003). Adv erse-selection costs and th e probabili-
ty of information-based trading. The Financial Review, 38, 257-272.
http://dx.doi.org/10.1111/1540-6288.00045
Coloma, F. (2010). Desafíos de la regulación de gobiernos corporativos
en Chile. Superintend ente de Valores y Seguros. P resentación Jorna-
da de Gobierno Corporativo Centro de Gobierno Corporativo Uni-
versidad Católica, Novem ber 18, 2010.
Coller, M., & Yohn, T. (1997). Management forecasts and information
asymmetry: An examination of bid-ask spreads. Journal of Account-
ing Research, 35, 181-191. http://dx.doi.org/10.2307/2491359
Copeland, T., & Galai, D. (1983). Information effects on the bid-ask
spread. Journal of Finance, 38, 1457-1469.
http://dx.doi.org/10.1111/j.1540-6261.1983.tb03834.x
Demsetz, H. (1968). The costs of transacting. Quarterly Journal of
Economics, 82, 33-53. http://dx.doi.org/10.2307/1882244
Engle, F. R. (1982). Autoregressive conditional heterocedasticity whit
estimates of the variance of United Kingdom inflation. Econometrica,
50, 987-1008. http://dx.doi.org/10.2307/1912773
Garman, M. B. (1976). Market microstructure. Journal of Financial
Economics, 3, 257-275.
http://dx.doi.org/10.1016/0304-405X(76)90006-4
Glosten, L., & Milgrom, P. (1985). Bid, ask and the transaction prices
in a specialist mark et with h eterog eneously informed traders. Journal
of Financial Economics, 14, 71-100.
http://dx.doi.org/10.1016/0304-405X(85)90044-3
Haat, H. M., Mahenthiran, S., Rah man, A. R., & Hamid, A. N. (200 6).
Agency costs as a factor in the suspension of companies from the
Kuala Lumpur stock exchange. Journal of Contemporary Accounting
and Economics, 2, 99-121.
http://dx.doi.org/10.1016/S1815-5669(10)70018-7
Hansch, O., Naik, N., & Viswanathan , S. (1998). Do inven tories matter
in dealership markets? Evidence from the London stock exchange.
Journal of Finance, 53, 1623-1656.
http://dx.doi.org/10.1111/0022-1082.00067
Hernández, L., & Parro, F. (2004). Sistema financiero y crecimiento
económico en Chile, Banco Central de Chile, Working Paper No.
291, Santiago, Chile.
Ho, T., & Stoll, H. (1980). On dealer markets under competition . Jour-
nal of Finance, 35, 259-267.
http://dx.doi.org/10.1111/j.1540-6261.1980.tb02153.x
Ho, T., & Stoll, H. (1981). Optimal dealer pricing under transactions
and return uncertainty. Journal of Financial Economics, 9, 47-73.
http://dx.doi.org/10.1016/0304-405X(81)90020-9
Huang, R., & Stoll, H. (1997). The components of the bid-ask spread:
A general approach. The Review of Financial Studies, 10, 995-1034.
http://dx.doi.org/10.1093/rfs/10.4.995
Kim, O., & Verrecchia, R. E. (1994). Market liquidity and volume
around earnings announcements. Journal of Accounting and Eco-
nomics, 17, 41-67. http://dx.doi.org/10.1016/0165-4101(94)90004-3
Jensen, M., & Meckling, W. (1976). Theory of the firm: Managerial
behavior, agency costs and ownership structure. Journal of Financial
Economics, 3, 305-360.
http://dx.doi.org/10.1016/0304-405X(76)90026-X
Lesmond, D. (2005) Liquidity of emerging markets. Journal of Finan-
cial Economics, 77, 411-452.
http://dx.doi.org/10.1016/j.jfineco.2004.01.005
Lin, J., Sanger , G., & Booth, G. G. (1995). Trade size and components
of the bid ask sprea d. Review of Financial Studies, 8, 1153-1183.
http://dx.doi.org/10.1093/rfs/8.4.1153
Triaccaa, U. (2008). Erratum to on the variance of the error associated
to the squared return as proxy of volatility. Applied Financial Eco-
nomics Letters, 4, 417.
http://dx.doi.org/10.1080/17446540701765233
Venkatesh, P. C., & Chiang, R. (1986). Information asymmetry and the
dealer’s bid-ask spread: A case study of earnings and dividend an-
nouncements. Journal of Finance, 41, 1089-1102.
http://dx.doi.org/10.1111/j.1540-6261.1986.tb02532.x
Wahal, S. (1997). Entry, exit, market makers and the bid-ask spread.
The Review of Financial Studies, 10, 871-901.
http://dx.doi.org/10.1093/rfs/10.3.871