 Vol.5, No.12, 1983-1992 (2013) Health http://dx.doi.org/10.4236/health.2013.512268 Association between obesity and self-reported diseases: Population-based study among adults in southern Brazil Frederico Manoel Marques1, Marco Aurélio Peres2, Giana Zarbato Longo3, Patricia Alves de Souza1 1Universidade do Planalto Catarinense (UNIPLAC), Lages, Brazil; passpb@gmail.com 2Universidade Federal de Santa Catarina (UFSC), Florianópolis, Brazil 3Universidade Federal de Viçosa (UFV), Viçosa, Brazil Received 15 October 2013; revised 21 November 2013; accepted 2 December 2013 Copyright © 2013 Frederico Manoel Marques et al. This is an open access article distributed under the Creative Commons Attribu- tion License, which permits unrestricted use, distribution, and reproduction in any medium, provided the original work is properly cited. ABSTRACT Introduction: There are few population-based studies conducted in Brazil outside the major urban centers, the prevalence of overweight, obesity and associated factors in the up country cities remains not noticed. Particularly, the cha- racteristics of this phenomenon are unknow n in the mountain regions of Santa Catarina (state of the southern region), which concentrate the lowest economic and social development of the state, where culture, dietary habits and climate are quite peculiar. Objective: To estimate the prevalence of nutritional status and its associa- tion with self-reported diseases in adult s of Lages, Santa Catarina. Methods: A cross sectional study including adults was conducted (n = 2022). De- mographic information was collected as well as anthropometric measurements, through a num- ber of interviews and physical examinations. The outcome of the study was the body mass index (BMI). The descriptive statistic was per- formed, as well as simple associations between BMI and the independent variables by sex. Cor- relations between BMI, abdominal circumfer- ence and self-reported diseases for men and women were tested separately. Results: The pre- valence of normal weight, overweight and obe- sity among men was 41%, 39% and 19% respec- tively. Among women, the prevalence rates w ere 43%, 31% and 26%. It was observed that the obesity increase is correlated with low levels of education. The greater the BMI the more nega- tive was the self-assessment of health. It was found a positive correlation between BMI and abdominal circumference, with diabetes mellitus and high blood pressure levels. Conclusions: There was a high prevalence of overweight and obesity in Lages, SC. Strategies involving the various sectors of the community should be considered to reverse this process. Keywords: Nutritional Assessment; Ri sk Factors; BMI; Population Surveys; Epidemiology 1. INTRODUCTION Obesity is being considered the most important nutria- tional disorder in developed and developing countries [1] and represents a significant change in the profile of health and disease in the world in recent years. In the most-recently published statistics, over one-third of the US population and 10% of the population in poor coun- tries are currently classified as overweight. In the Ameri- cas, research shows a high level of obesity for both sexes. Obesity is less prevalent in African countries. In Asia, the prevalence is higher in urban population. In econo- mically more advanced regions, the prevalence patterns of obesity may be as high as in industrialized countries [2]. The increasing prevalence of obesity at preschool age, the early occurrence of adiposity and a rapid weight gain are some risk factors that can increase the development of obesity in more advanced ages [3]. In Brazil, there are studies demonstrating the clearly decline in malnutrition—especially in children under five years, and a significant increase in overweight and obe- sity in all age groups. Historically, malnutrition was the Copyright © 2013 SciRes. OPEN ACCESS 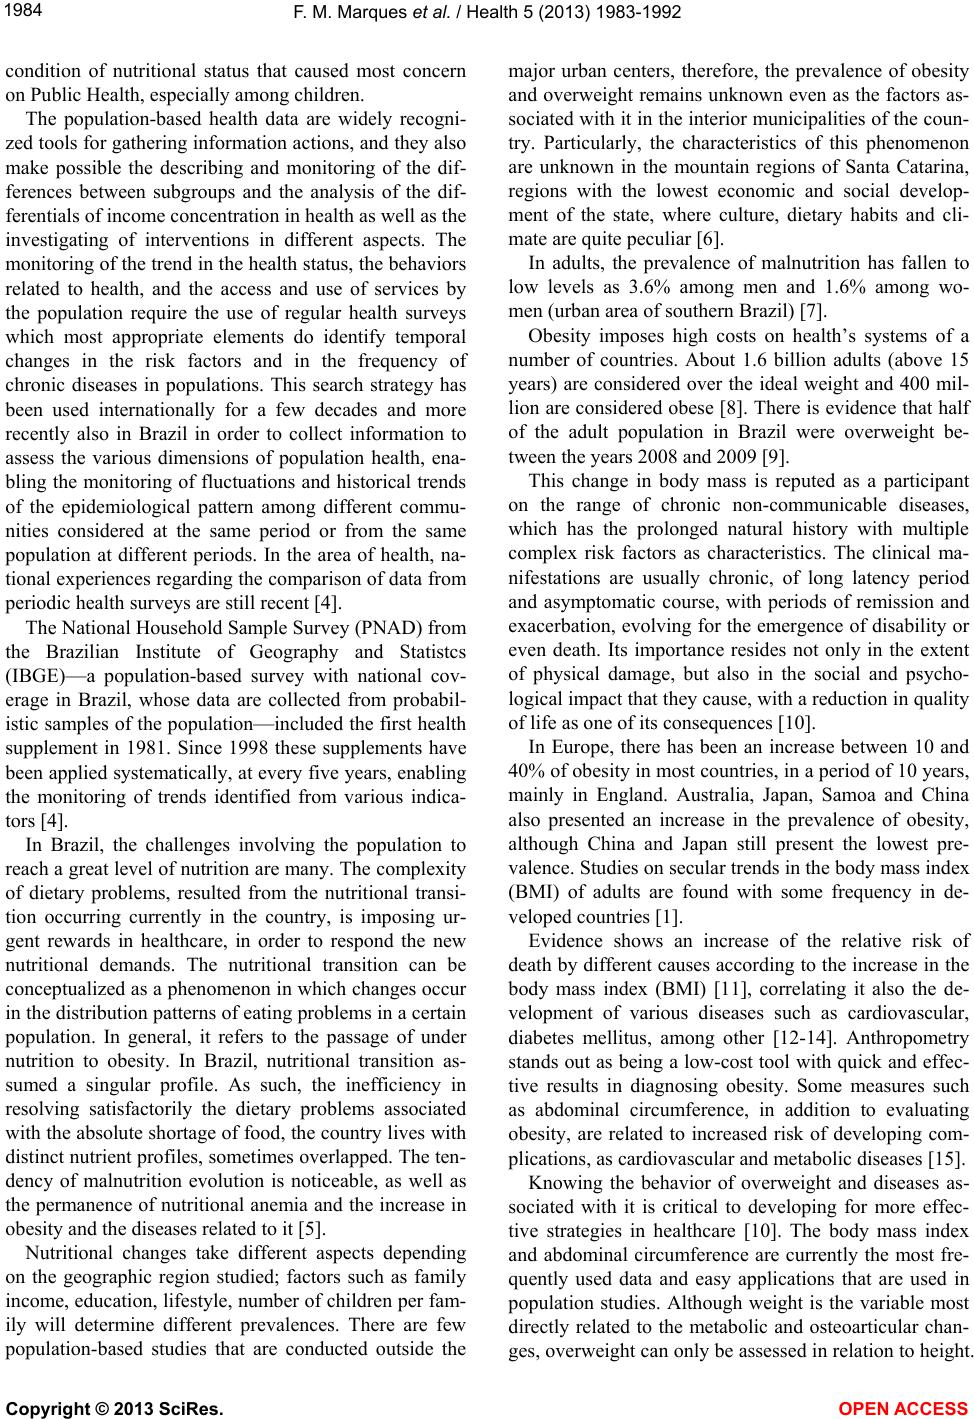 F. M. Marques et al. / Health 5 (2013) 1983-1992 1984 condition of nutritional status that caused most concern on Public Health, especially among children. The population-based health data are widely recogni- zed tools for gathering information actions, and they also make possible the describing and monitoring of the dif- ferences between subgroups and the analysis of the dif- ferentials of income concentration in health as well as the investigating of interventions in different aspects. The monitoring of the trend in the health status, the behaviors related to health, and the access and use of services by the population require the use of regular health surveys which most appropriate elements do identify temporal changes in the risk factors and in the frequency of chronic diseases in populations. This search strategy has been used internationally for a few decades and more recently also in Brazil in order to collect information to assess the various dimensions of population health, ena- bling the monitoring of fluctuations and historical trends of the epidemiological pattern among different commu- nities considered at the same period or from the same population at different periods. In the area of health, na- tional experiences regarding the comparison of data from periodic health surveys are still recent [4]. The National Household Sample Survey (PNAD) from the Brazilian Institute of Geography and Statistcs (IBGE)—a population-based survey with national cov- erage in Brazil, whose data are collected from probabil- istic samples of the population—included the first health supplement in 1981. Since 1998 these supplements have been applied systematically, at every five years, enabling the monitoring of trends identified from various indica- tors [4]. In Brazil, the challenges involving the population to reach a great level of nutrition are many. The complexity of dietary problems, resulted from the nutritional transi- tion occurring currently in the country, is imposing ur- gent rewards in healthcare, in order to respond the new nutritional demands. The nutritional transition can be conceptualized as a phenomenon in which changes occur in the distribution patterns of eating problems in a certain population. In general, it refers to the passage of under nutrition to obesity. In Brazil, nutritional transition as- sumed a singular profile. As such, the inefficiency in resolving satisfactorily the dietary problems associated with the absolute shortage of food, the country lives with distinct nutrient profiles, sometimes overlapped. The ten- dency of malnutrition evolution is noticeable, as well as the permanence of nutritional anemia and the increase in obesity and the diseases related to it [5]. Nutritional changes take different aspects depending on the geographic region studied; factors such as family income, education, lifestyle, number of children per fam- ily will determine different prevalences. There are few population-based studies that are conducted outside the major urban centers, therefore, the prevalence of obesity and overweight remains unknown even as the factors as- sociated with it in the interior municipalities of the coun- try. Particularly, the characteristics of this phenomenon are unknown in the mountain regions of Santa Catarina, regions with the lowest economic and social develop- ment of the state, where culture, dietary habits and cli- mate are quite peculiar [6]. In adults, the prevalence of malnutrition has fallen to low levels as 3.6% among men and 1.6% among wo- men (urban area of southern Brazil) [7]. Obesity imposes high costs on health’s systems of a number of countries. About 1.6 billion adults (above 15 years) are considered over the ideal weight and 400 mil- lion are considered obese [8]. There is evidence that half of the adult population in Brazil were overweight be- tween the years 2008 and 2009 [9]. This change in body mass is reputed as a participant on the range of chronic non-communicable diseases, which has the prolonged natural history with multiple complex risk factors as characteristics. The clinical ma- nifestations are usually chronic, of long latency period and asymptomatic course, with periods of remission and exacerbation, evolving for the emergence of disability or even death. Its importance resides not only in the extent of physical damage, but also in the social and psycho- logical impact that they cause, with a reduction in quality of life as one of its consequences [10]. In Europe, there has been an increase between 10 and 40% of obesity in most countries, in a period of 10 years, mainly in England. Australia, Japan, Samoa and China also presented an increase in the prevalence of obesity, although China and Japan still present the lowest pre- valence. Studies on secular trends in the body mass index (BMI) of adults are found with some frequency in de- veloped countries [1]. Evidence shows an increase of the relative risk of death by different causes according to the increase in the body mass index (BMI) [11], correlating it also the de- velopment of various diseases such as cardiovascular, diabetes mellitus, among other [12-14]. Anthropometry stands out as being a low-cost tool with quick and effec- tive results in diagnosing obesity. Some measures such as abdominal circumference, in addition to evaluating obesity, are related to increased risk of developing com- plications, as cardiovascular and metabolic diseases [15]. Knowing the behavior of overweight and diseases as- sociated with it is critical to developing for more effec- tive strategies in healthcare [10]. The body mass index and abdominal circumference are currently the most fre- quently used data and easy applications that are used in population studies. Although weight is the variable most directly related to the metabolic and osteoarticular chan- ges, overweight can only be assessed in relation to height. Copyright © 2013 SciRes. OPEN ACCESS 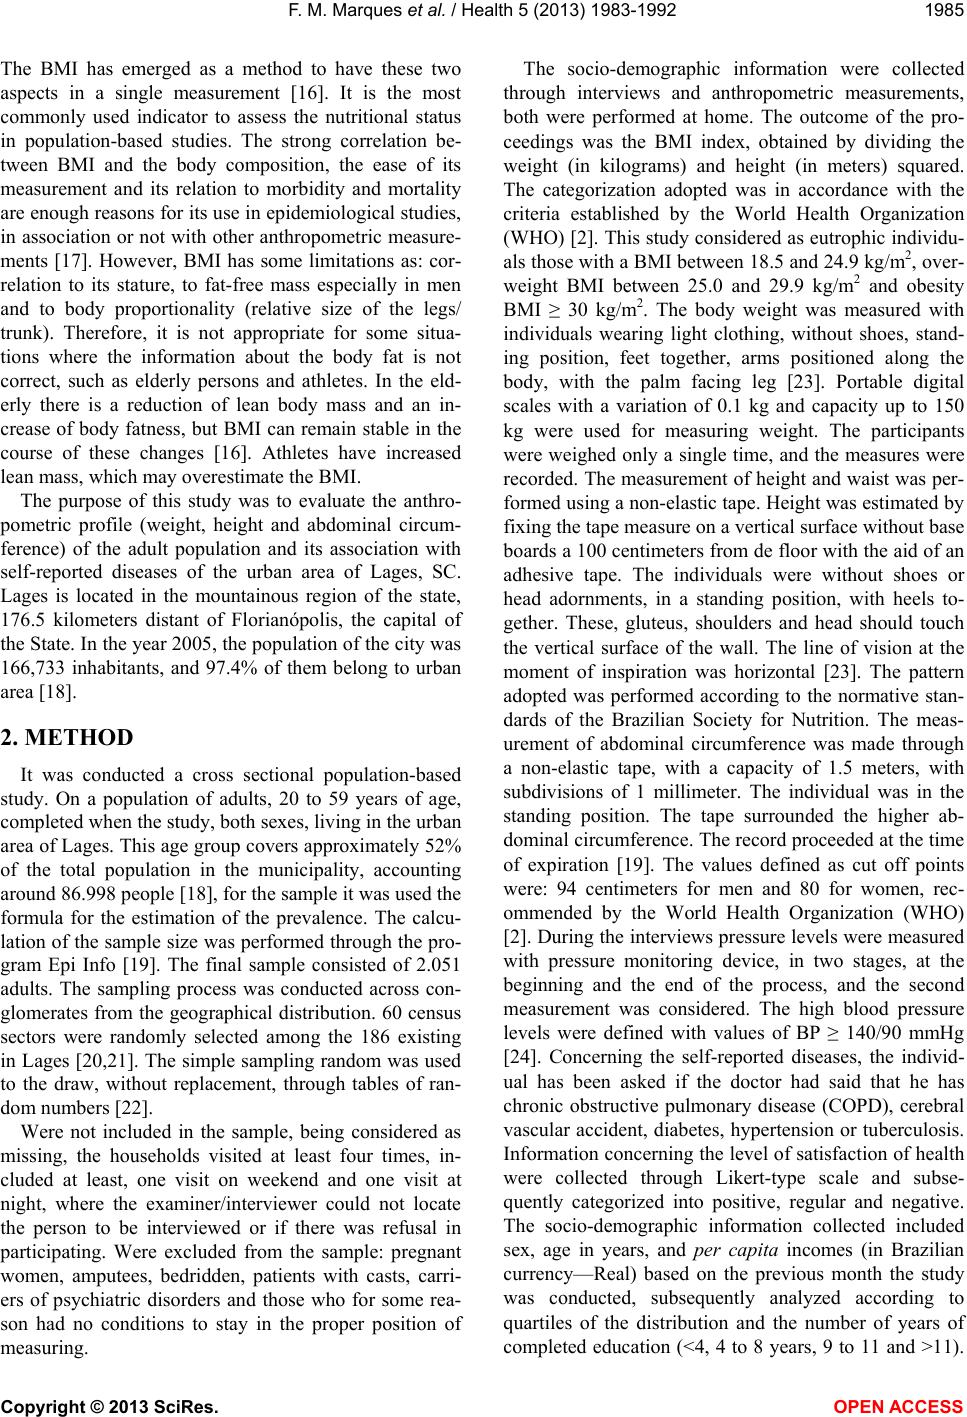 F. M. Marques et al. / Health 5 (2013) 1983-1992 1985 The BMI has emerged as a method to have these two aspects in a single measurement [16]. It is the most commonly used indicator to assess the nutritional status in population-based studies. The strong correlation be- tween BMI and the body composition, the ease of its measurement and its relation to morbidity and mortality are enough reasons for its use in epidemiological studies, in association or not with other anthropometric measure- ments [17]. However, BMI has some limitations as: cor- relation to its stature, to fat-free mass especially in men and to body proportionality (relative size of the legs/ trunk). Therefore, it is not appropriate for some situa- tions where the information about the body fat is not correct, such as elderly persons and athletes. In the eld- erly there is a reduction of lean body mass and an in- crease of body fatness, but BMI can remain stable in the course of these changes [16]. Athletes have increased lean mass, which may overestimate the BMI. The purpose of this study was to evaluate the anthro- pometric profile (weight, height and abdominal circum- ference) of the adult population and its association with self-reported diseases of the urban area of Lages, SC. Lages is located in the mountainous region of the state, 176.5 kilometers distant of Florianópolis, the capital of the State. In the year 2005, the population of the city was 166,733 inhabitants, and 97.4% of them belong to urban area [18]. 2. METHOD It was conducted a cross sectional population-based study. On a population of adults, 20 to 59 years of age, completed when the study, both sexes, living in the urban area of Lages. This age group covers approximately 52% of the total population in the municipality, accounting around 86.998 people [18], for the sample it was used the formula for the estimation of the prevalence. The calcu- lation of the sample size was performed through the pro- gram Epi Info [19]. The final sample consisted of 2.051 adults. The sampling process was conducted across con- glomerates from the geographical distribution. 60 census sectors were randomly selected among the 186 existing in Lages [20,21]. The simple sampling random was used to the draw, without replacement, through tables of ran- dom numbers [22]. Were not included in the sample, being considered as missing, the households visited at least four times, in- cluded at least, one visit on weekend and one visit at night, where the examiner/interviewer could not locate the person to be interviewed or if there was refusal in participating. Were excluded from the sample: pregnant women, amputees, bedridden, patients with casts, carri- ers of psychiatric disorders and those who for some rea- son had no conditions to stay in the proper position of measuring. The socio-demographic information were collected through interviews and anthropometric measurements, both were performed at home. The outcome of the pro- ceedings was the BMI index, obtained by dividing the weight (in kilograms) and height (in meters) squared. The categorization adopted was in accordance with the criteria established by the World Health Organization (WHO) [2]. This study considered as eutrophic individu- als those with a BMI between 18.5 and 24.9 kg/m2, over- weight BMI between 25.0 and 29.9 kg/m2 and obesity BMI ≥ 30 kg/m2. The body weight was measured with individuals wearing light clothing, without shoes, stand- ing position, feet together, arms positioned along the body, with the palm facing leg [23]. Portable digital scales with a variation of 0.1 kg and capacity up to 150 kg were used for measuring weight. The participants were weighed only a single time, and the measures were recorded. The measurement of height and waist was per- formed using a non-elastic tape. Height was estimated by fixing the tape measure on a vertical surface without base boards a 100 centimeters from de floor with the aid of an adhesive tape. The individuals were without shoes or head adornments, in a standing position, with heels to- gether. These, gluteus, shoulders and head should touch the vertical surface of the wall. The line of vision at the moment of inspiration was horizontal [23]. The pattern adopted was performed according to the normative stan- dards of the Brazilian Society for Nutrition. The meas- urement of abdominal circumference was made through a non-elastic tape, with a capacity of 1.5 meters, with subdivisions of 1 millimeter. The individual was in the standing position. The tape surrounded the higher ab- dominal circumference. The record proceeded at the time of expiration [19]. The values defined as cut off points were: 94 centimeters for men and 80 for women, rec- ommended by the World Health Organization (WHO) [2]. During the interviews pressure levels were measured with pressure monitoring device, in two stages, at the beginning and the end of the process, and the second measurement was considered. The high blood pressure levels were defined with values of BP ≥ 140/90 mmHg [24]. Concerning the self-reported diseases, the individ- ual has been asked if the doctor had said that he has chronic obstructive pulmonary disease (COPD), cerebral vascular accident, diabetes, hypertension or tuberculosis. Information concerning the level of satisfaction of health were collected through Likert-type scale and subse- quently categorized into positive, regular and negative. The socio-demographic information collected included sex, age in years, and per capita incomes (in Brazilian currency—Real) based on the previous month the study was conducted, subsequently analyzed according to quartiles of the distribution and the number of years of completed education (<4, 4 to 8 years, 9 to 11 and >11). Copyright © 2013 SciRes. OPEN ACCESS  F. M. Marques et al. / Health 5 (2013) 1983-1992 1986 The construction of the database and the double entry were performed thorugh the statistical package Epi Info version 6.0 [19]. Descriptive statistics with the use of averages and proportions was performed. Simple asso- ciations between BMI and the independent variables for each sex were tested through the Pearson Qui-squared test for linear tendency. The Pearson’s linear correlation was used to assess the level of correlation between BMI and abdominal circumference according to sex and self- reported diseases. The value of p < 0.05 was considered for statistical significance. All analyzes were performed with STATA 9 [25]. The project was submitted and ap- proved by the Ethics in Research Committee of UNI- PLAC—number 001 - 007. If it were any health prob- lems observed with the respondent, the interviewers sub- mitted them to the nearest Health Care Unit. 3. RESULTS AND DISCUSSION A total of 2.022 adults aged between 20 and 59 years which corresponds to a response rate of 98.6% were in- terviewed. The sample consisted of 61.4% females and 38.6% males. Regarding to the nutritional state, most of the respon- dents were eutrophic in both sexes; however, among those with excess weight, there was a prevalence of over- weight among men and the opposite occurred regarding obesity demonstrating a higher percentage among wo- men. Comprehensive data come from national health and nutrition surveys performed in the United States between 1960 and 1994. These surveys documented a progressive increase in the prevalence of obese adults, and in the period of 1976 to 1994 there was an increase in obesity among men, in the proportion of 12.3% to 19.9%, and among women from 16.9% to 24.9% [2]. Most eutrophic belonged to the lower age groups, those with overweight in intermediate ages between 30 and 39 years, while the obese were distributed more fre- quently in the higher age groups (Table 1). It was ob- served in this study, a frequency of BMI below 18.5; less than 2%, indicating the absence of energy deficits adult population in urban Lages. As a result, the group of un- derweight was added to those with normal weight status in all analyzes. The highest frequency of eutrophic was in the third income quartile, while those with excess weight were in the lowest quartiles. The lower the BMI, the more posi- tive was the perception of health (Table 1). It was ob- served a linear relation between obesity and the levels of education (p < 0.001). In respect of the self-reported diseases, diabetes mel- litus showed a higher distribution for male and among those overweight, followed by the obese (p = 0.001). For females there was a positive relation of diabetes with BMI, with the highest prevalence observed among obese individuals (p < 0.001). In men, it was found a larger percentage in high tension levels (blood pressure above the normal settings), among those overweighed, followed by the obese (p < 0.001). For females, the higher the BMI, the higher the incidence in high blood pressure (p < 0.001). The prevalence of cerebral vascular accident was 1.43%. The greatest distribution was found among the overweighed in both sexes, but without statistical sig- nificance (p = 0.496). With reference to bronchitis, to both sexes, the highest prevalence was found among eu- trophic individuals, with p = 0.849, also not statistically significant (Table 2). Figure 1 shows the positive correlation between BMI and abdominal circumference for both sexes (p < 0.001). Studies conducted in several centers have shown a cor- relation between BMI and abdominal or visceral fat (ab- dominal circumference). The abdominal fat has its im- portance on cardiovascular diseases because of its fre- quently association with dyslipidemia, hypertension and insulin resistance [26]. Although abdominal circumfer- ence was classified, according to cut-off points suggested by the World Health Organization as 94 cm for men and 80 cm for women, as a measure of metabolic risk in- creased, few studies in Brazil evaluated the appropriate- ness of the use of this indicator, as well as the most ap- propriate cut-off points for the Brazilian population [27]. Study conducted in Cuiabá, Mato Grosso—Brazil, shows that these cut-off points as measures of metabolic risk are lower than that recommended by the World Health Or- ganization [19]. The results of this study are quite statis- tically consistent, but further researches are needed to better define the cut-off points for the Brazilian popula- tion and rather in different age groups. It is possible that in the future it may have only one single measure, using a very low cost solution as the tape measure, a high ac- curacy tool as a predictor of metabolic diseases. Figures 2 and 3 show a positive correlation with ab- dominal circumference with self-reported diabetes mel- litus and high blood pressure for males and females, re- spectively (p < 0.001). The results of this study show the high percentages of overweight and obesity, but it would be precipitate to say that overeat is replacing the food shortage problem, as this study has a cross-sectional design and was the only one held in the region, not satisfying the requirement of temporality between the possible cause and the presumed effect so that it can make such an inference. The high prevalence of overweight is not unique to Lages, as found by the process of nutritional transition, taking place throughout the country and also in other develop- ing countries, especially Latin America and China, whose transformation phenomenon closely resembles the Brazilian one [28]. Copyright © 2013 SciRes. OPEN ACCESS 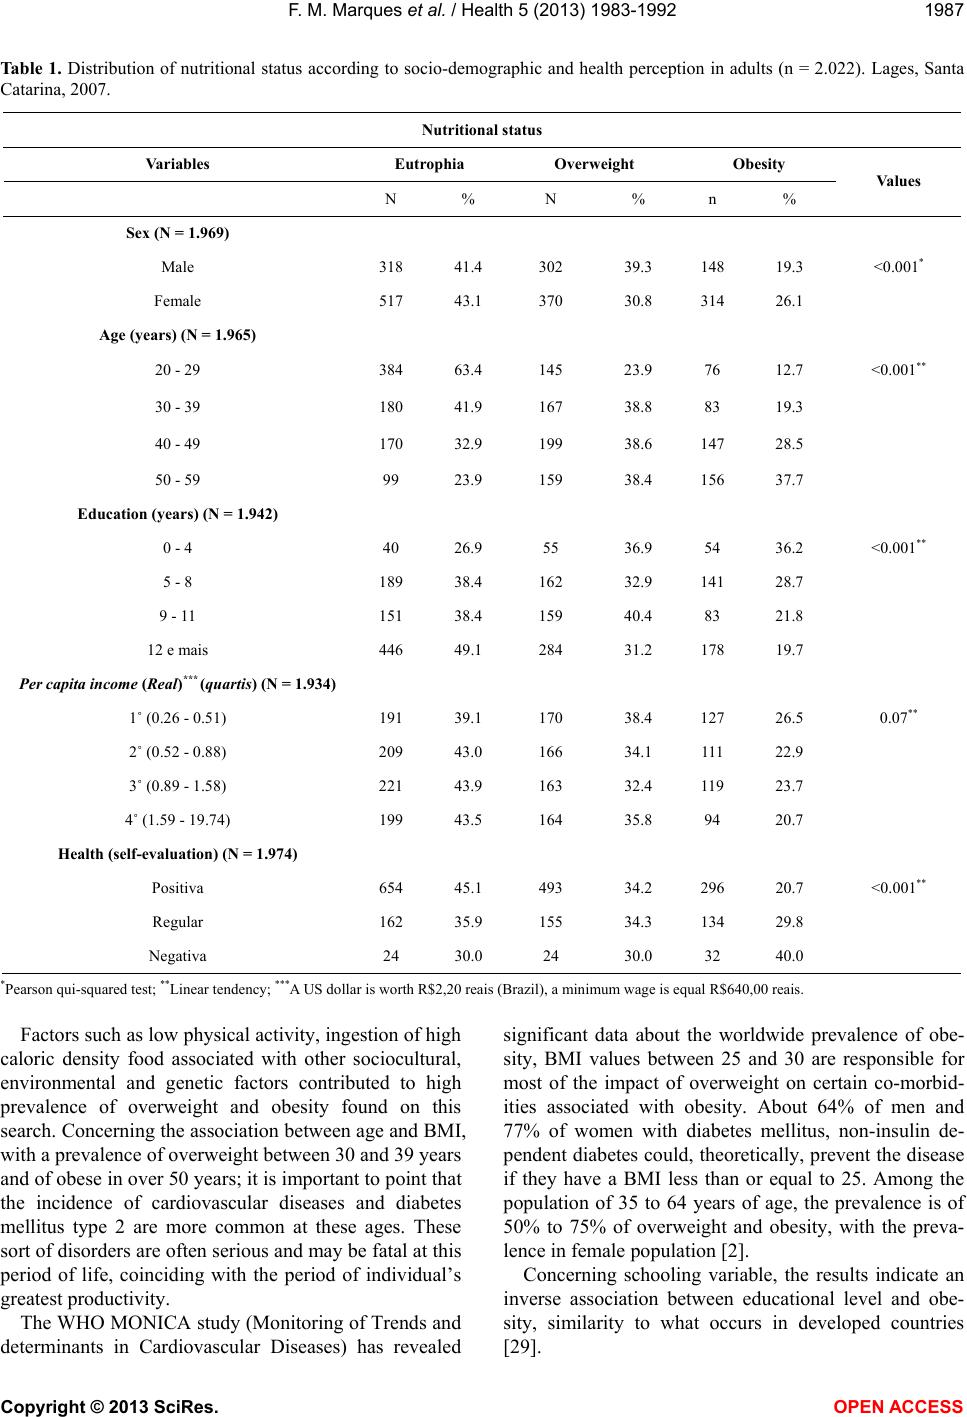 F. M. Marques et al. / Health 5 (2013) 1983-1992 Copyright © 2013 SciRes. OPEN ACCESS 1987 Table 1. Distribution of nutritional status according to socio-demographic and health perception in adults (n = 2.022). Lages, Santa Catarina, 2007. Nutritional status Variables Eutrophia Overweight Obesity N % N % n % Values Sex (N = 1.969) Male 318 41.4 302 39.3 148 19.3 <0.001* Female 517 43.1 370 30.8 314 26.1 Age (years) (N = 1.965) 20 - 29 384 63.4 145 23.9 76 12.7 <0.001** 30 - 39 180 41.9 167 38.8 83 19.3 40 - 49 170 32.9 199 38.6 147 28.5 50 - 59 99 23.9 159 38.4 156 37.7 Education (years) (N = 1.942) 0 - 4 40 26.9 55 36.9 54 36.2 <0.001** 5 - 8 189 38.4 162 32.9 141 28.7 9 - 11 151 38.4 159 40.4 83 21.8 12 e mais 446 49.1 284 31.2 178 19.7 Per capita income (Real)*** (quartis) (N = 1.934) 1˚ (0.26 - 0.51) 191 39.1 170 38.4 127 26.5 0.07** 2˚ (0.52 - 0.88) 209 43.0 166 34.1 111 22.9 3˚ (0.89 - 1.58) 221 43.9 163 32.4 119 23.7 4˚ (1.59 - 19.74) 199 43.5 164 35.8 94 20.7 Health (self-evaluation) (N = 1.974) Positiva 654 45.1 493 34.2 296 20.7 <0.001** Regular 162 35.9 155 34.3 134 29.8 Negativa 24 30.0 24 30.0 32 40.0 *Pearson qui-squared test; **Linear tendency; ***A US dollar is worth R$2,20 reais (Brazil), a minimum wage is equal R$640,00 reais. Factors such as low physical activity, ingestion of high caloric density food associated with other sociocultural, environmental and genetic factors contributed to high prevalence of overweight and obesity found on this search. Concerning the association between age and BMI, with a prevalence of overweight between 30 and 39 years and of obese in over 50 years; it is important to point that the incidence of cardiovascular diseases and diabetes mellitus type 2 are more common at these ages. These sort of disorders are often serious and may be fatal at this period of life, coinciding with the period of individual’s greatest productivity. The WHO MONICA study (Monitoring of Trends and determinants in Cardiovascular Diseases) has revealed significant data about the worldwide prevalence of obe- sity, BMI values between 25 and 30 are responsible for most of the impact of overweight on certain co-morbid- ities associated with obesity. About 64% of men and 77% of women with diabetes mellitus, non-insulin de- pendent diabetes could, theoretically, prevent the disease if they have a BMI less than or equal to 25. Among the population of 35 to 64 years of age, the prevalence is of 50% to 75% of overweight and obesity, with the preva- lence in female population [2]. Concerning schooling variable, the results indicate an inverse association between educational level and obe- sity, similarity to what occurs in developed countries [29]. 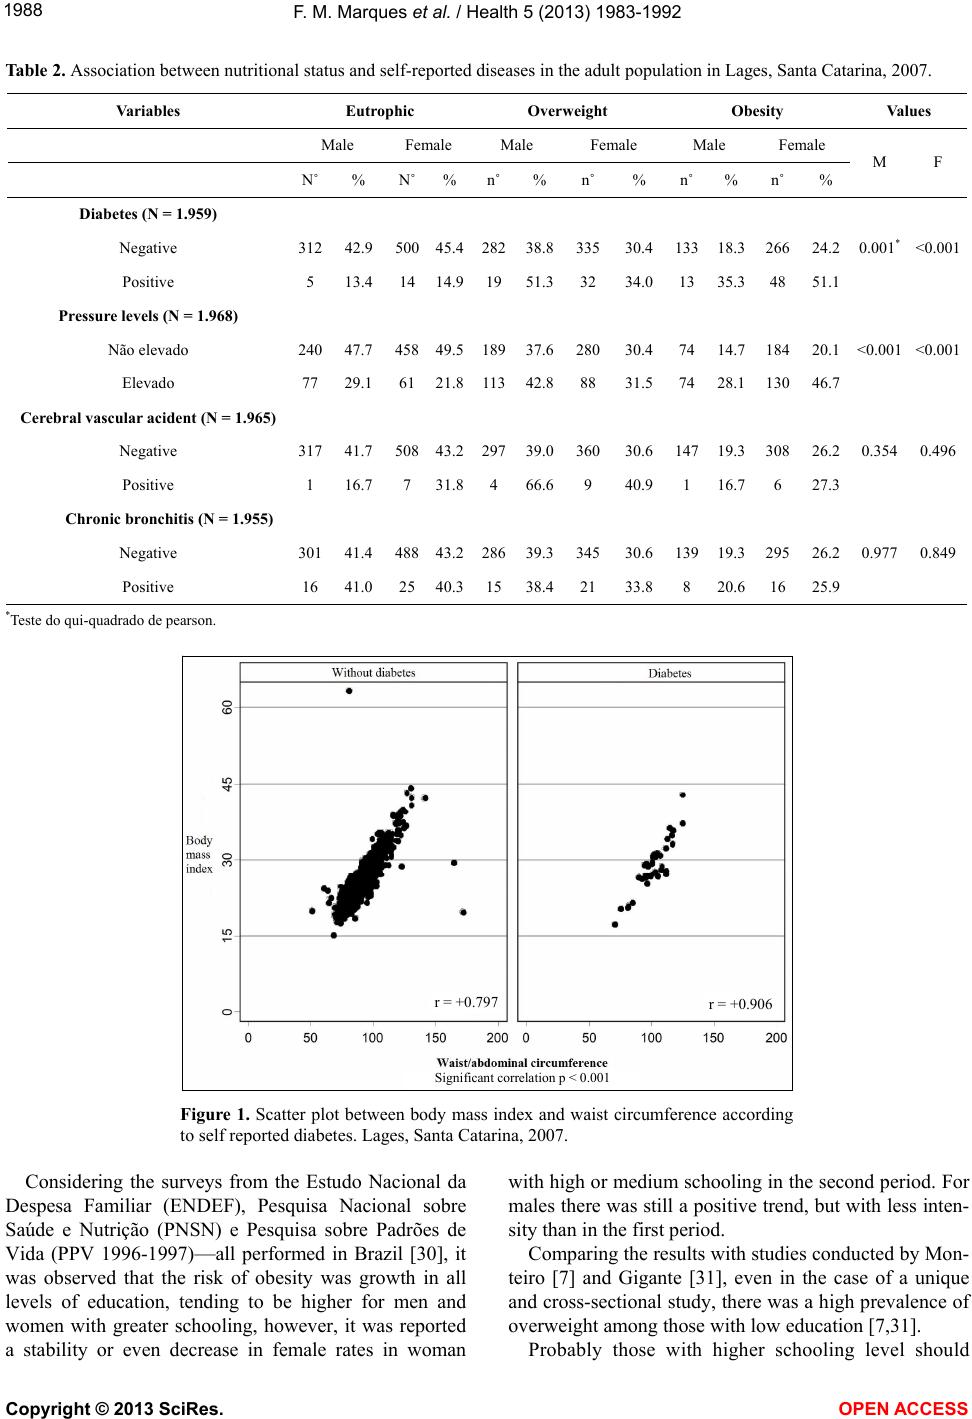 F. M. Marques et al. / Health 5 (2013) 1983-1992 1988 Table 2. Association between nutritional status and self-reported diseases in the adult population in Lages, Santa Catarina, 2007. Variables Eutrophic Overweight Obesity Values Male Female Male Female Male Female N˚ % N˚ %n˚ %n˚ % n˚ % n˚ % M F Diabetes (N = 1.959) Negative 312 42.9 50045.4 282 38.8 335 30.4133 18.3 266 24.2 0.001*<0.001 Positive 5 13.4 14 14.9 19 51.3 32 34.0 13 35.3 48 51.1 Pressure levels (N = 1.968) Não elevado 240 47.7 45849.5 189 37.6 280 30.4 74 14.7 184 20.1 <0.001<0.001 Elevado 77 29.1 61 21.8 113 42.8 88 31.5 74 28.1 130 46.7 Cerebral vascular acident (N = 1.965) Negative 317 41.7 50843.2 297 39.0 360 30.6 147 19.3 308 26.2 0.3540.496 Positive 1 16.7 7 31.8 4 66.6 9 40.9 1 16.7 6 27.3 Chronic bronchitis (N = 1.955) Negative 301 41.4 48843.2 286 39.3 345 30.6 139 19.3 295 26.2 0.9770.849 Positive 16 41.0 25 40.3 15 38.4 21 33.88 20.6 16 25.9 *Teste do qui-quadrado de pearson. r = +0.797r = +0.906 Significant correlation p < 0.001 Figure 1. Scatter plot between body mass index and waist circumference according to self reported diabetes. Lages, Santa Catarina, 2007. Considering the surveys from the Estudo Nacional da Despesa Familiar (ENDEF), Pesquisa Nacional sobre Saúde e Nutrição (PNSN) e Pesquisa sobre Padrões de Vida (PPV 1996-1997)—all performed in Brazil [30], it was observed that the risk of obesity was growth in all levels of education, tending to be higher for men and women with greater schooling, however, it was reported a stability or even decrease in female rates in woman with high or medium schooling in the second period. For males there was still a positive trend, but with less inten- sity than in the first period. Comparing the results with studies conducted by Mon- teiro [7] and Gigante [31], even in the case of a unique and cross-sectional study, there was a high prevalence of overweight among those with low education [7,31]. Probably those with higher schooling level should Copyright © 2013 SciRes. OPEN ACCESS 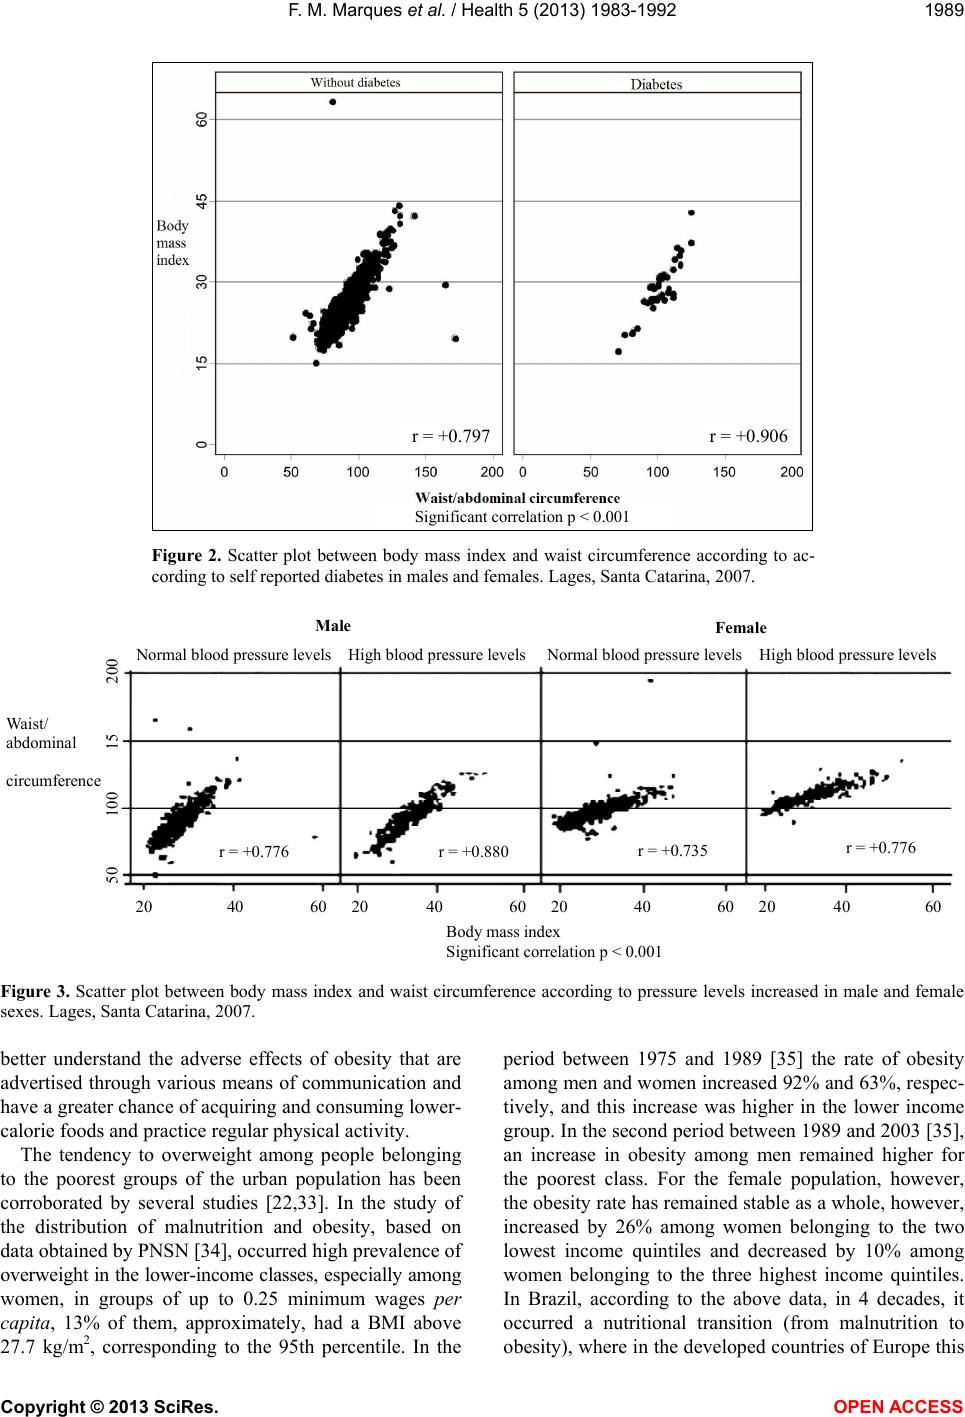 F. M. Marques et al. / Health 5 (2013) 1 98 3-1992 1989 r = +0.797 Significant correlation p < 0.001 r = +0.906 Figure 2. Scatter plot between body mass index and waist circumference according to ac- cording to self reported diabetes in males and females. Lages, Santa Catarina, 2007. Body mass index Significant correlation p < 0.001 20 40 60 20 40 60 20 40 60 20 40 60 r = +0.776 r = +0.880r = +0.735r = +0.776 Male Female ormal blood pressure levels High blood pressure levels 50 100 15 200 Waist/ abdominal circumference ormal blood pressure levels High blood pressure levels Figure 3. Scatter plot between body mass index and waist circumference according to pressure levels increased in male and female sexes. Lages, Santa Catarina, 2007. better understand the adverse effects of obesity that are advertised through various means of communication and have a greater chance of acquiring and consuming lower- calorie foods and practice regular physical activity. The tendency to overweight among people belonging to the poorest groups of the urban population has been corroborated by several studies [22,33]. In the study of the distribution of malnutrition and obesity, based on data obtained by PNSN [34], occurred high prevalence of overweight in the lower-income classes, especially among women, in groups of up to 0.25 minimum wages per capita, 13% of them, approximately, had a BMI above 27.7 kg/m2, corresponding to the 95th percentile. In the period between 1975 and 1989 [35] the rate of obesity among men and women increased 92% and 63%, respec- tively, and this increase was higher in the lower income group. In the second period between 1989 and 2003 [35], an increase in obesity among men remained higher for the poorest class. For the female population, however, the obesity rate has remained stable as a whole, however, increased by 26% among women belonging to the two lowest income quintiles and decreased by 10% among women belonging to the three highest income quintiles. In Brazil, according to the above data, in 4 decades, it occurred a nutritional transition (from malnutrition to obesity), where in the developed countries of Europe this Copyright © 2013 SciRes. OPEN ACCESS  F. M. Marques et al. / Health 5 (2013) 1 98 3-1992 1990 nutritional transition took a century. Despite uncertain causes that justify the world’s in- crease in obesity, three hypotheses are objects of study. One of them proposes the possibility of populations pre- sent themselves genetically more susceptible to obesity, which associated with certain environmental factors, should increase the chances of this happens. This hy- pothesis would explain the rise in obesity in low-income populations, linked to a supposed “economic genotype”, it means that in cases of food shortages the genes related to obesity would be a guarantee of survival, however, in periods of excess, such genes would become would be- come detrimental. The second hypothesis, the most stud- ied, attributes the increasing trend of obesity in devel- oped and developing countries to the decline of energy expenditure of individuals. The lower energy expenditure would be associated with occupations that would require less physical efforts. Dietary factors such as lower fiber intake and increased consumption of fats and sugars would also be considered [36]. A third hypothesis would result in a protein-energy malnutrition in early life stages, in this case, obesity would be a sequel of malnutrition. The energy and protein restriction would cause changes in the central nervous system in order to facilitate pri- marily the accumulation of body fat, causing a tendency to positive energy balance, when the easy access to food occurred [37]. The presence in this search of a high prevalence of overweight in low-income populations is very similar to other population-based studies conducted in other re- gions of the country [27,31]. Facing this reality that affects adults from impoveri- shed segments of society, deprived by the assistance of the private sector and depending on the public health system, constitutes a new challenge to public health, changing olds paradigms which showed the highest pre- valence of obesity among people with greater incomes. The health’s satisfaction variable shows how those with higher BMI have difficulty in perceiving their health. It is possible that eating disorders may influence the perception of health, but it is plausible that the con- cern with body image also assisted in its evaluation. In this aspect, there is the influence of the means of com- munication that emphasize thinness as the ideal model of social representation to be achieved. A significant association between BMI and self-re- ported diabetes mellitus and blood pressure levels was identified. These values, however, must be interpreted with caution, not eliminating the possibility of reverse causation bias, inherent in cross-sectional studies. Even though, the biological plausibility as well as the magni- tude of the results suggests that the results may be inter- preted as potential causal factors. This association per- sisted regardless of the genre. 4. FINAL CONSIDERATIONS Undoubtedly, the overcoming of eating problems in the country involves intricate aspects. In this context, the proposal of health promotion suggests a promising path for food and nutrition areas. Primarily because it is a strategy that articulates different sectors and social indi- viduals where there are issues such as: health model un- der the approach of completeness; articulation of techni- cal and popular knowledge; empowering and enabling individuals, partnerships in action; sectors division of public and private agencies, strengthening of community action; popular education; citizenship; public ethics; among others [5]. With these results, the multiplication of initiatives that are still incipient in the country is proposed, focusing on the nutritional reality aiming to reverse this process in- terrupting the cycle of a high prevalence of overweight and its association with chronic non-communicable dis- eases. Suggestions among other measures are: optimizing health activities in essential care (a free service to the public by the Unified Health System (SUS—is the health care system that is free to the entire population of Bra- zil)), providing nutritional counseling training to all members with more effective participation of health agents; implementation of community gardens, creating awareness of the importance of micronutrients and fiber in healthy eating; incorporating these programs with their local university courses in health, social sciences and technology, integrating them in a multidisciplinary, but mostly interdisciplinary; using the space in schools and health unities for the construction of gyms with extended hours of use, including weekends and school holidays, aimed at all ages, with monitors and adequate health care. Associated with those, the use of all means of mass com- munication in the country for disseminating educational actions that reproduce the harmful consequences of obe- sity can help people realize the importance of changing eating habits and increasing physical activity. This search showed that Lages has a high prevalence of overweight in adults in the urban region, associated with high blood pressure and self-reported diabetes. Fur- ther epidemiological studies are needed for monitoring this population of nutritional risk, aiming at an adequate caring, offering scientific topics for both public and pri- vate sectors, based on their reality. Also, it defines the priorities of the population. Taking into consideration regional aspects and providing health education actions are important steps for successful pre- vention and control of obesity [10]. This apparent “health status”, with high prevalence rates of overweight and obesity, hides a new challenge to public health that could jeopardize the entire health sys- tem, damaging the society, family and the individual Copyright © 2013 SciRes. OPEN ACCESS  F. M. Marques et al. / Health 5 (2013) 1 98 3-1992 1991 which may have lower quality and life expectancy. REFERENCES [1] Tardido A.P. and Falcão M.C. (2006) O impacto da modernização na transição nutricional e obesidade. Re- vista Brasileira de Nutrição Clínica, 21, 117-124. [2] World Health Organization (1997) Obesity: Preventing and managing the global epidemic of obesity. Report of the Who consultation of obesity, Geneva. [3] Lanigan J. and Singhal A. (2009) Early nutrition and long-term health: A practical approach. Proceedings of the Nutrition Society, 68, 422-429. http://dx.doi.org/10.1017/S002966510999019X [4] Francisco, P.M.S.B., Barros, M.B.A., Segri, N.J., Alves, M.C.G.P., César, C.L.G., Carandina, L. and Goldbaun, M. (2013) Comparação das estimativas de prevalência de indicadores de saúde no Município de Campinas, São Paulo, Brasil, nos anos de 2001/2002 (ISA-SP) e 2008/ 2009 (ISA-Camp). Cadernos de Saúde Pública, Rio de Janeiro, 29, 1149-1160. [5] Ferreira, V.A. and Magalhães, R. (2007) Nutrição e pro- moção da saúde: Perspectivas atuais. Cadernos de Saúde Pública, Rio de Janeiro, 23, 1674-1681. [6] Marques, F.M. (2009) Prevalência do estado nutricional na população adulta da Região Urbana de Lages, SC. Dissertação de Mestrado, Universidade do Planalto Ca- tarinense, UNIPLAC. [7] Monteiro, C.A. (2000) Velhos e novos males da saúde no Brasil: A evolução do país e suas doenças. 2nd Edition, Hucitec, Nupens/USP, São Paulo. [8] Pêgo-Fernandes, P.M., Bibas, B.J. and Deboni, M. (2011) Obesity: The greatest epidemic of the 21stcentury? Sao Paulo Medical Journal, 129, 283-284. http://www.scielo.br/scielo.php?pid=S0021-75572013000 200012&script=sci_arttext http://dx.doi.org/10.1590/S1516-31802011000500001 [9] Brasil. Ministério do Planejamento, Orçamento e Gestão. Instituto Brasileiro de Geografia e Estatística (2010) Pes- quisa de Orçamentos Familiares (POF) 2008-2009: An- tropometria e Estado Nutricional de Crianças, Adole- scentes e Adultos no Brasil. Rio de Janeiro: IBGE. [10] Swarowsky, I., Reuter, E.M., Ferreira, C., Priebe, P., Paiva, D.N. and Pohl, H.H. (2012) Obesidade e fatores associados em Adultos. Cinergis, 13, 64-71. [11] Calle, E.E., Thun, M.J., Petrelli, J.M., Rodríguez, C. and Heath, C. (1999) Body-mass. Index and mortality in a prospective cohort of U. S. adults. New England Journal of Medici ne, 341, 1097-1110. http://dx.doi.org/10.1056/NEJM199910073411501 [12] Corrada, M.M., Kawas, C.H., Mozaffar, F. and Hill, A.P. (2006) Association of body mass index and weight change with all-cause mortality in the elderly. American Journal of Epidemiology, 163, 938-949. http://dx.doi.org/10.1093/aje/kwj114 [13] Jousilahti, P., Tuomilehto, J., Vartiainen, E., Pekkanen, J. and Puska, P. (1996) Body mass index and incident ische- mic heart disease in South Korean men and women. Cir- culation, 93, 1372-1379. http://dx.doi.org/10.1161/01.CIR.93.7.1372 [14] Jee, S.H., Barriuso, R.P., Appel, L.J., Suh, L.L., Miller, E.R. and Guallar, E. (2005) Body mass index and incident ischemic heart disease in South Korean men and women. American Journal of Epidemiology, 162, 42-48. http://dx.doi.org/10.1093/aje/kwi166 [15] Lamounier, J.A. and Parizzi, M.R. (2007) Obesidade e saúde pública. Cad Saúde Pública, 23, 1497-1499. http://www.scielo.br/scielo.php?pid=S0102-311X200700 0600027&script=sci_arttext [16] Morales, A.J.R. (year) Manual de diagnóstico e trata- mento das dislipidemias. Atha Comunicação e Editora, São Paulo. [17] Olinto, M.T.A., Nacul, L.C., Gigante, D.P., Costa, J.S.D., Menezes, A.M.B. and Macedo, S. (2003) Waist circum- ference as a determinant of hypertension and diabetes in Brazilian women: A population-based study. Public Health Nutrition, 7, 629-635. [18] IBGE (2007) Instituto brasileiro de geografia e estatística. http://www.ibge.gov.br [19] Dean, A.G., Dean, J.A., Colombier, D., Brendel, K.A., Smith, D.C., Burton, A.H., et al. (1994) Epi Info, version 6: A word processing, database, and statistics program for epidemiology on microcomputers. Centers for Disease Control and Prevention, Atlanta. [20] Barros, F.C. and Victora, C.G. (1998) Epidemiologia da saúde infantil. Um manual para diagnósticos comuni- tários. Hucitec/UNICEF, São Paulo. [21] Bennett, S., Woods, T., Liyanage, W.M. and Smith, D.L. (1991) A simplified general method for cluster-sample surveys of health in developing countries. World Health Statistics Quarterly, 44, 98-106. [22] Silva, N.N. (1998) Amostragem probabilística. Um curso introdutório. EDUSP, São Paulo. [23] Waitzberg, D.L. and Ferrini, M.T. (2002) Exame físico e antropometria. In: Waitzberg, D.L., Ed., Nutrição oral, enteral e parenteral na prática clínica. 3rd Edition, Atheneu, São Paulo, 260-263. [24] Chobanian, A.V., Bakris, G.J., Black, H.R., Cushman, W.C., Lee, A., Green, L.A., et al. (2003) The seventh re- port of the joint national committee on prevention, detec- tion, evaluation, and treatment of high blood pressure: The JNC 7 report. JAMA, 289, 2560-2572. http://dx.doi.org/10.1001/jama.289.19.2560 [25] STATA Corp (2001) Stata estatical software release 9.0. STATA Corporation, Colege Station. [26] Ferreira, M.G., Valente, J.G., Gonçalves-Silva, R.M.V. and Sichieri, R. (2006) Acurácia da circunferência da cintura e da relação cintura/quadril como preditores de dislipidemias em estudo transversal de doadores de san- gue de Cuiabá, mato Grosso, Brasil. Cad Saúde Pública, 22, 307-314. http://dx.doi.org/10.1590/S0102-311X2006000200008 [27] Pena, M. and Bacallao, J. (2006) Obesidade e pobreza: Um novo desafio de saúde pública. Roca, São Paulo, 77-89. [28] Popkin, B.M., Kim, S. and Moon, S. (2000) The nutrition Copyright © 2013 SciRes. OPEN ACCESS  F. M. Marques et al. / Health 5 (2013) 1 98 3-1992 Copyright © 2013 SciRes. OPEN ACCESS 1992 transition in south Korea. American Journal of Clinical Nutrition, 71, 44-53. [29] Sobal, J. and Stunkard, A.J. (1989) Socioeconomic status and obesity: A review of the literature. Psychological Bulletin, 105, 260-275. http://dx.doi.org/10.1037/0033-2909.105.2.260 [30] Monteiro, C.A., Conde, W.L. and Castro, I.R.R. (2003) A tendência cambiante da relação entre escolaridade e risco de obesidade no Brasil (1975-1997). Cadernos de Saúde Pública, Rio de Janeiro, 19, 567-575. [31] Gigante, D.P., Barros, F.C., Post, C.L.A. and Olinto, M.T.A. (1997) Prevalência de obesidade em adultos e seus fatores de risco. Rev Saúde Pública, 31, 236-246. http://dx.doi.org/10.1590/S0034-89101997000300004 [32] Monteiro, C. (2006) Transição epidemiológica no Brasil. In: Pena, M. and Bacallao, J., Eds., Obesidade e pobreza: Um novo desafio de saúde pública. Roca, São Paulo, 77-89. [33] Delpeuch, F. and Maire B. (1997) Obesity and developing countries of the South. Medecine Tropicale, 57, 380-388. [34] Martins, I.S., Meléndez-Velásques, C.G. and Cervato, A.M. (1999) Estado nutricional de grupamentos sociais da área metropolitana de São Paulo. Cadernos de Saúde Pública, 15, 71-78. http://dx.doi.org/10.1590/S0102-311X1999000100008 [35] Monteiro, C.A., Conde, W.L. and Popkin B.M. (2007) Income-specific trends in obesity in Brazil: 1975-2003. American Journal of Public Heath, 97, 1808-1812. http://dx.doi.org/10.2105/AJPH.2006.099630 [36] Mondini, L. (1996) Desnutrição e obesidade no Brasil: Relevância epidemiológica e padrões de distribuição intra-familiar em diferentes estratos econômicos e re- gionais São Paulo. Faculdade de Saúde Pública, USP. [37] Sawaya, A.L., Grillo, L.P., Verreschi, I., Silva, A.C. and Roberts, S.B. (1998) Mild stunting is associated with higher susceptibility to the effects of high fat diets: Stud- ies in a shantytown population in São Paulo, Brazil. Journal of Nutrition, 128, 415-420.
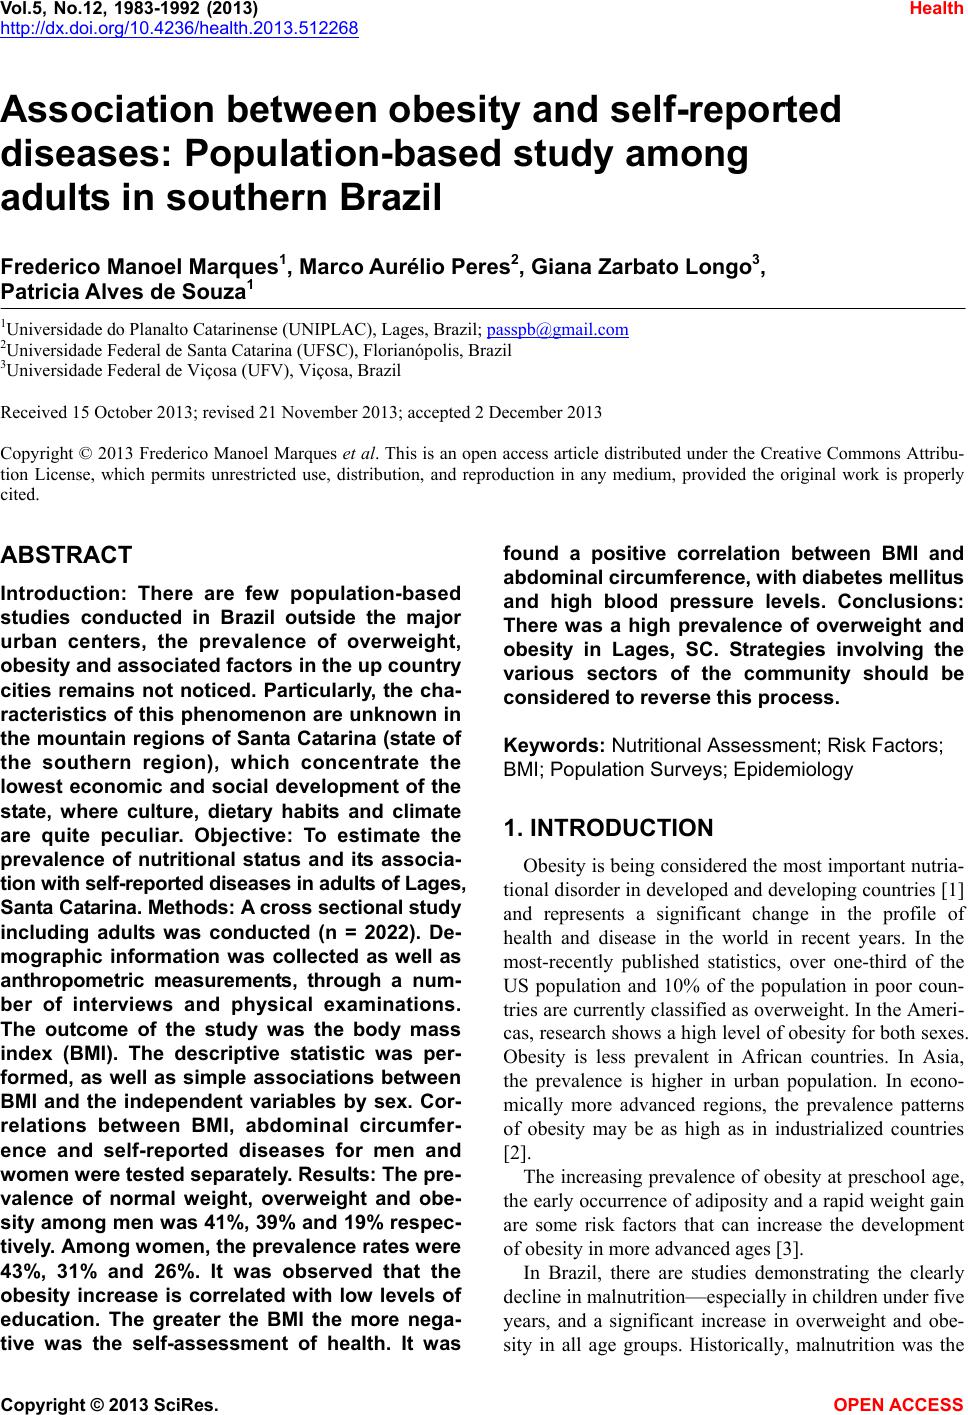
|