 Current Urban Studies 2013. Vol.1, No.4, 92-101 Published Online December 2013 in SciRes (http://www.scirp.org/journal/cus) http://dx.doi.org/10.4236/cus.2013.14010 Open Access 92 Urban Amenities and the Development of Creative Clusters: The Case of Brazil Ana Flávia Machado, Rodrigo Ferreira Simões, Sibelle Cornélio Diniz Centro de Desenvolvimento e Planejamento Regional, Universidade Federal de Minas Gerais, Belo Horizonte, Brasil Email: afmachad@cedeplar.ufmg.br Received May 28th, 2013; revised July 5th, 2013; accepted July 13th, 2013 Copyright © 2013 Ana Flávia Machado et al. This is an open access article distributed under the Creative Commons Attribution License, which permits unrestricted use, distribution, and reproduction in any medium, provided the origina l w o rk is properly cited. This paper describes the creative potential of Brazilian territories, including aspects pointed as cities’ comparative advantages in terms of creativity: cultural facilities, labor market and public expenditures in culture. The paper uses clustering analysis, applied to secondary data from the Brazilian Demographic Census (IBGE), Survey of Basic Municipal Information (MUNIC/IBGE) and municipal expenditures in culture from National Treasury (FINBRA). Among the six clusters which were created, three are well de- fined and the others are quite mixed. Cluster 1 includes the two largest and most developed cities in Brazil, São Paulo and Rio de Janeiro. Cluster 2 is composed of capitals of important states in Brazil and cities where large universities are located. We named this cluster as creative university centers. Cluster 3 com- prises 99 municipalities and can be named as centers of cultural and ecological tourism. Keywords: Urban Amenities; Crative Clusters; Brasil Introduction Amenities are an old theme in Economics, particularly in Ur- ban Economics. Its definition has gotten new dimensions. Technically, amenities are understood as the set of public and private goods and services which generate positive externalities for the resident and visiting population. Until the mid-twentieth century, transportation infrastructure and water and sewage treatment systems were the most important amenities in the conformation of industrial cities. Nowadays, given the occur- rence of several economic transformations, and especially the process of globalization, the most valued amenities include cul- tural and entertainment activities. In this context, the presence of coffee shops and art galleries, parks and cultural institutions, as well as buildings of architec- tural importance, are all emphasized as fundamental urban amenities in the conformation of the so-called creative cities. The term creative cities comes from this concern, either be- cause they may enhance local development by means of small- scale production based on creativity, or because they may be- come locus of recovery of “obsolete” spaces in large urban cen- ters. These cities are urban complexes which present various cul- tural activities and high concentration of creative employment. Creativity would perform a fundamental role in urban dyna- mism, the sector’s contribution being measured by its share in the level of production, in employment generation, besides in- direct effects, such as expenditures by tourists visiting the city. Creative cities are defined according to the presence of com- parative advantages in terms of cultural production. These ad- vantages can be a combination of two or more conditions, such as: significant presence of a creative class; existence of cultural facilities; tradition in popular celebrations; high average income of the population; high average schooling of the population; presence of universities; previously adopted policies to foster cultural activities and an environment of high “social self-es- teem”, and “open minds” to innovation and to different demo- graphic groups. Given these concepts, the goal of this paper is to describe the creative potential of Brazilian territories, including aspects pointed as cities’ comparative advantages in terms of creativity: existence of cultural facilities, tradition in popular celebrations, “open minds” to innovation and to different demographic groups, average schooling of the population, labor market and public expenditures in culture. The paper uses clustering analy- sis, applied to secondary data from the Brazilian Demographic Census (IBGE), in order to measure the size of the creative labor force; Survey of Basic Municipal Information (MUNIC/ IBGE) for the supply of cultural facilities; and municipal ex- penditures in culture from FINBRA, a report by the National Treasury based on information about expenditures and revenues of each Brazilian municipality. The use of clustering analysis can be justified as like Lazzer- etti (2012: 5): “Creative Economies are those external agglom- eration economies that can be explained in terms of both diver- sity and specialization… Clustering also affects creative indus- tries (…) and it is important to understand the reasons behind it, and to single out the appropriate methods for the identification and mapping clusters”. The paper is divided in five sections, including this brief in- troduction. In the second section, the literature on amenities is presented. Next, we present the methodology and the data sources. In the fourth section, the clusters results are presented  A. F. MACHADO ET AL. and, lastly, the fifth section presents some considerations about this study. Amenities and the Formation of Creative Clusters This paper’s main goal is to identify which elements (ameni- ties) might contribute to transform productive agglomerations into creative clusters, and hence describe the amenities with the potential of creating creative clusters in Brazil. In spite of the fact that the idea of creative cities has taken hold of the public policies agenda, academic research has paid it insufficient at- tention. Recently, there has been an increasing consideration of urban amenities as a determinant of both residential (Smith et al., 1988) and productive locational decisions (Gottlieb, 1994, 1995; Granger & Blomquist, 1999), as well as of aspects associated with urban and regional growth and development. Sivitanidou & Sivitanides (1995) relate amenities to the intracity distribu- tion of R&D activities; Malecki (1984), Markusen et al. (1986) and Angel (1989) identify amenities as a key factor in the at- traction of qualified migrants, particularly scientists; Herzog & Schlottmann (1993) and Blomquist et al. (1988) take amenities as determinants of quality of life and even of the scale of urban centers; Knapp & Graves (1989) analyze the relation between amenities, migration and regional development. Clark & Kahn (1988), in turn, tried to define the social benefits of particularly cultural urban amenities. Vandell & Lane (1989) aim to identify the influence of design and architecture in the dynamism and valorization of urban areas. Glaeser et al. (2001) relate higher rates of urban growth with the presence of high amenities in selected urban regions. Recently, Clark (2004) edited a book with a suggestive title (“The city as an entertainment machine”), in which several authors deal with the topic of entertainment industry taken as the main contemporary urban amenity, and also discuss the limits and possibilities of taking amenities as a drive for development. McGranahan & Wojan (2007) associate regional development to the presence of cultural density (crea- tive class as in Florida, 2002) and natural amenities. Ahlfeldt & Maennig (2010) found a strong relation between housing prices, quality of life and proximity to cultural amenities, particularly to historic heritage sites. In Brazil, there are few studies which address the relation between urban amenities and development. Macedo & Simões (1989) related urban amenities to the conformation of intracity spatial structures and their growth potential. Silveira Neto & Azzoni (2004) relate regional development and regional ameni- ties. Hermann & Haddad (2011) associate urban amenities to real estate quality and valorization. Rocha & Magalhães (2011) aim to evaluate urban amenities, particularly natural amenities, and associate them to quality of life in an intercity approach. Golgher (2008 and 2011) analyzes, without using the concept of amenities, the relation between “vibrant cities” and the pres- ence of a creative class in Brazilian municipalities, starting from the construction of clusters. Due to these large movements, the city is no longer just an agglomeration where the individual looks for jobs, and it be- came the space of consumption of goods and, mostly, of ser- vices. Individuals decide to live in cities because this is where they find their source of income, by means of regular employ- ment. However, they try also to reconcile this demand with quality of life. According to Clark et al. (2004: 297) “There is a relative decline in the explanatory variables affecting the eco- nomic base, like distance, transportation costs, local labor costs, and proximity to natural resources and markets—since air travel, fax, the Internet, and associated changes have drastically facilitated contacts among physically distant persons, globally. This shifts the mix of inputs for location of households and firms, increasing the importance of more subtle distinctions in taste, quality of life concerns, and related considerations”. Clark (2004) stresses that public managers, entrepreneu rs and community leaders now recognize culture, entertainment and urban amenities as important factors for people to choose their places for living and for tourism. Several large cities, such as London, New York and Chicago, present these activities as their main sources of revenues and of employment and income generation. On the other hand, the enhancement of cultural and creative activities may promote the recognition of local values and tra- ditions, favoring a cultural legitimation which encourages com- munity identity, self-expression, respect to diversity and vitality, by means of characteristics and cultural practices which define the locality and its population (Cwi, 1980; Bille & Schulze, 2008). As Bille and Schulze (2008) point out, art and culture can play a prominent role in regional and urban development, and even a wider role if we expand the definition of development. Cultural development needs to be accompanied by a compre- hensive strategy of regional and urban development, which will use the complementarities among its different areas. Methodology As highlighted in this article’s objectives, we hereby intend to build a typology of Brazilian municipalities in terms of their cultural attributes—which comprise goods, equipment, services, qualified and specialized labor etc. This is justified by the fact that there are few works, in Brazil, that try to quantify this this ever more relevant sector, which increasingly assumes a lead- ing role in the global urban scenario. There are, in Brazil, mas- sive regional and urban inequalities. They are not restricted to income or human development-related indicators, but also en- compass, to a strong extent, the development of urban hierar- chies, attributes and amenities. These disparities ground the attempt to develop a taxonomy of the Brazilian municipalities (5570), in order to better understand their specificities, by cre- ating categories of urban nuclei homogeneous in regard to the creative sector. To this purpose, we employed an exploratory multivariate analysis that combines two complementary meth- ods—namely, Cluster Analysis and Discriminant Analysis. The former creates categories of urban centers that are homogene- ous in terms of the cultural sector. However, as the great num- ber of municipalities and their internal differences tends to create unbalanced clusters—viz., some well-defined ones and others with a certain amount of heterogeneity—, we also per- formed a Discriminant Analysis. The latter allows us to assess each individual’s (in our case, municipalities) belonging to, or how well he fits in, each category defined in the Cluster Analy- sis. Garcia & Simões (2012) were the authors to initially pro- pose this combination of multivariate methods, in an assess- ment of the Brazilian urban network and its hierarchies. Later, Monteiro et al. (2013) also employed it to characterize the pos- sible changes to the urban network of the oriental section of the Open Access 93  A. F. MACHADO ET AL. Brazilian Amazon. Cluster Analysis The clustering methods may be characterized as any statisti- cal procedure which, using a finite and multidimensional in- formation set, classifies its elements in restricted, internally homogeneous groups, allowing the generation of significant aggregate structures and the development of analytical typolo- gies. The technique used for obtaining the clusters was the k- means non-hierarchical method. In the k-means method, each sample element is allocated with the cluster which centroid (vector of sample means) is the closest to the vector of ob- served values for the respective element. The partition process is performed considering k initial centroids, with which each sample element is compared. k = 5 and k = 6 were tested, and at the end we decided for six groups or clusters. By construction, the definition of the initial centroids is ran- dom and, after that, the algorithm grouped the elements ac- cording to their proximity to the centroids. New centroids are defined taking into account the new clusters which are formed, and the process is repeated until no relocation is needed, i.e. all the sample elements are “well allocated”. There are various dissimilarity measurements which can be used in the generation of clusters. The basic rule is that it should follow the specificities of the data set, the statistical characteristics of the variables and the classification purposes, and it can be based on one or multiple features of the munici- palities. In our case the measurement used was the Euclidian distance, i.e., a multidimensional geometric distance: 2 1 ,p ij jf f dij x (1) Hence, the classification of municipalities into homogeneous groups allows for the creation of taxonomies, typologies, re- ducing the number of dimensions to be analyzed and allowing for a more direct understanding of the inherent characteristics of the information. Discriminant Analysis1 Discriminant Analysis is a statistical technique to differenti- ate groups. By using a rule of derivation/discrimination, it is possible to optimally designate a new object into the pre-exist- ing classes; in other words, once the analysis groups have been established and the characteristics of an individual are known, the probability of this individual belonging to the pre-deter- mined groups can be estimated. The technique can be used to examine differences between groups and/or classify new groups. The objective is to find one or more dimensions that maxi- mize the distinction between mutually exclusive groups, esti- mating one or more discriminant functions that make it possible to classify the observations into groups. The discriminant func- tions are linear functions that combine the variables used. In addition, they are equivalent to a reduction in the study size, related to the analysis of the main components and to the ca- nonic correlation. They are formally represented by the follow- ing expression: 011 22kmkmkmp pkm uuX uXuX (2) Here, fkm is equal to the score of the canonic discriminant function for use in case m in group k; Xikm is equal to the value of variable Xi for the case m in group k; and ui are coefficients that produce the desired characteristics of the function. The assumptions for application of this technique require that the number of independent variables be less than the number of observations, and the discriminating power increases as the number of observations expands (provided that the number of independent variables remains constant). The independent vari- ables should have normal distribution in the populations of each group. However, empirical evidence shows that the analysis continues to be robust if there are small deviations in normality in relatively large samples. In addition, the internal variability of the groups should be similar; in other words, the variance and covariance matrixes should be homogenous (to guarantee this homogeneity, it is sufficient to identify and remove the outliers from the analysis). After defining the dependent variable and the explanatory variables (whether discrete or continuous), the discriminant functions should be estimated. The results of this estimation provide a matrix with the averages of each group and the intra and inter group sums, which should be used to compare the differences between the coefficients estimated. The correlation (or covariance) matrix is used to evaluate how much each in- dependent variable can be discriminated among the groups. It should be emphasized that it is essential to standardize these coefficients to avoid problems of scale among the independent variables, which could lead to interpretation errors. In our case, an objective discriminant variable—the hard cluster analysis categories, is used as a parameter for reclassifi- cations, making feasible the identification of individuals (in this case, municipalities) that are likely to be classified at higher or lower levels in the hierarchy of creative cities. The underlying idea is that municipalities belonging to a typological category and that have elements that allow, through a pre-established rule of belonging, for example, 50% or 75% of likelihood of belonging above their hard/crisp category, reclassify them into another typology are differentiated in terms of creative potential from those that were well defined previously. Simultaneously, the municipalities that have potential attributed that give them characteristics of lower levels in the creative ranking can be the object of policies to avoid the loss of incipient power to in- crease dynamics provided by the creative sector. Data Sources This study uses various data sources. The most important one is the 2010 Demographic Census, which informs the following indicators for all of the 5595 municipalities in Brazil: loca- tional quotient of workers in the creative sector; proportion of resident adults who finished high school; proportion of house- holds in which the residents declare a conjugal union with indi- viduals of the same sex2; proportion of households with Internet access; proportion of households with sewage systems; resident population. These indicators are collected from the Sample of the Census, done every ten years by the Brazilian Institute of 2Like Florida (2002), we built a proxy for the index of presence of homo- sexuals among the resident population with an indication of social openness that is, a lower presence of prejudice, insofar as this information results from self-declaration. 1This part is based on Mingoti (2007) and Simões et al. ( 20 12). Open Access 94 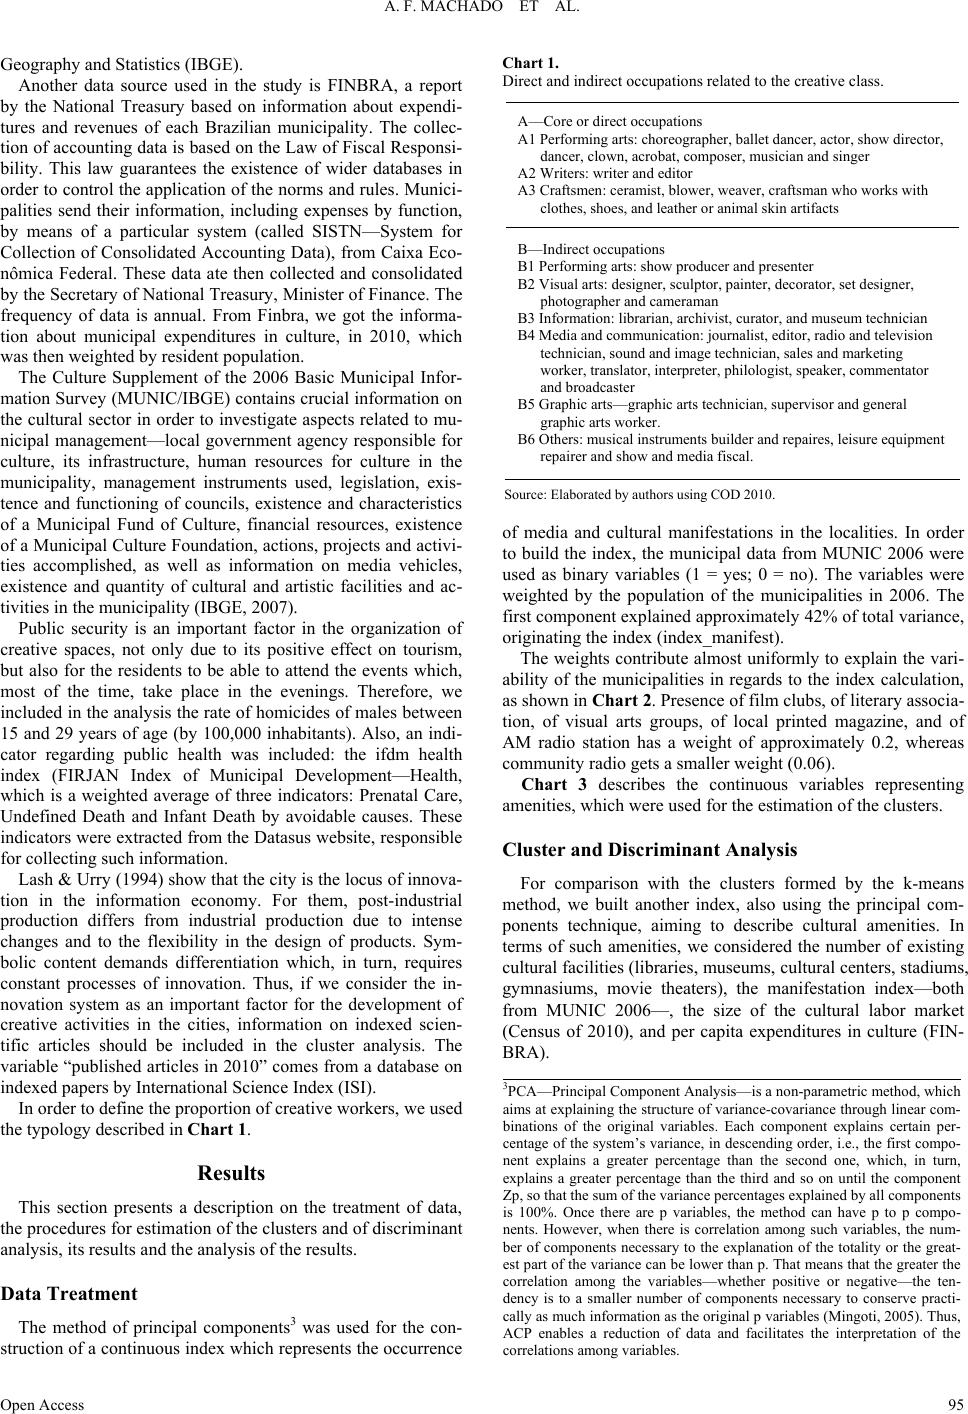 A. F. MACHADO ET AL. Geography and Statisti cs (IBGE). Another data source used in the study is FINBRA, a report by the National Treasury based on information about expendi- tures and revenues of each Brazilian municipality. The collec- tion of accounting data is based on the Law of Fiscal Responsi- bility. This law guarantees the existence of wider databases in order to control the application of the norms and rules. Munici- palities send their information, including expenses by function, by means of a particular system (called SISTN—System for Collection of Consolidated Accounting Data), from Caixa Eco- nômica Federal. These data ate then collected and consolidated by the Secretary of National Treasury, Minister of Finance. The frequency of data is annual. From Finbra, we got the informa- tion about municipal expenditures in culture, in 2010, which was then weighted by resident population. The Culture Supplement of the 2006 Basic Municipal Infor- mation Survey (MUNIC/IBGE) contains crucial information on the cultural sector in order to investigate aspects related to mu- nicipal management—local government agency responsible for culture, its infrastructure, human resources for culture in the municipality, management instruments used, legislation, exis- tence and functioning of councils, existence and characteristics of a Municipal Fund of Culture, financial resources, existence of a Municipal Culture Foundation, actions, projects and activi- ties accomplished, as well as information on media vehicles, existence and quantity of cultural and artistic facilities and ac- tivities in the municipality (IBGE, 2007). Public security is an important factor in the organization of creative spaces, not only due to its positive effect on tourism, but also for the residents to be able to attend the events which, most of the time, take place in the evenings. Therefore, we included in the analysis the rate of homicides of males between 15 and 29 years of age (by 100,000 inhabitants). Also, an indi- cator regarding public health was included: the ifdm health index (FIRJAN Index of Municipal Development—Health, which is a weighted average of three indicators: Prenatal Care, Undefined Death and Infant Death by avoidable causes. These indicators were extracted from the Datasus website, responsible for collecting such information. Lash & Urry (1994) show that the city is the locus of innova- tion in the information economy. For them, post-industrial production differs from industrial production due to intense changes and to the flexibility in the design of products. Sym- bolic content demands differentiation which, in turn, requires constant processes of innovation. Thus, if we consider the in- novation system as an important factor for the development of creative activities in the cities, information on indexed scien- tific articles should be included in the cluster analysis. The variable “published articles in 2010” comes from a database on indexed papers by International Science Index (ISI). In order to define the proportion of creative workers, we used the typology described in Chart 1. Results This section presents a description on the treatment of data, the procedures for estimation of the clusters and of discriminant analysis, its results and the analysis of the results. Data Treatment The method of principal components3 was used for the con- struction of a continuous index which represents the occurrence Chart 1. Direct and indirect occupati o ns related to the creative class. A—Core or direct occupations A1 Performing arts: choreographer, ballet dancer, actor, show dir ector, dancer, clown, acrobat, com p os er, musician and singer A2 Writers: writer and editor A3 Craftsmen: ceramist, blower, weaver, craftsman who works with clothes, shoes, and leather or animal sk i n artifacts B—Indirect occupatio ns B1 Performing arts: show producer and presenter B2 Visual arts: designer, sculptor, painter, decorator, set de s igner, photographer and cameraman B3 Information: libra ri an, archivist, curator, and museum t e c h n i cian B4 Media and communication: journalist, editor, radio and televisio n technician, sound and image te chnician , sales and marketing worker, translator, interpreter, philologist, speaker, commentator and broadcaster B5 Graphic arts—graphic arts tec h ni cian, supe rvisor and general graphic arts worker. B6 Others: musical instruments builde r and repaires, leisure equipment repairer a n d show and media fiscal. Source: Elaborated by authors using COD 2010. of media and cultural manifestations in the localities. In order to build the index, the municipal data from MUNIC 2006 were used as binary variables (1 = yes; 0 = no). The variables were weighted by the population of the municipalities in 2006. The first component explained approximately 42% of total variance, originating the index (index_manifest). The weights contribute almost uniformly to explain the vari- ability of the municipalities in regards to the index calculation, as shown in Chart 2. Presence of film clubs, of literary associa- tion, of visual arts groups, of local printed magazine, and of AM radio station has a weight of approximately 0.2, whereas community radio gets a smaller weight (0.06). Chart 3 describes the continuous variables representing amenities, which were used for the estimation of the clusters. Cluster and Discriminant Analysis For comparison with the clusters formed by the k-means method, we built another index, also using the principal com- ponents technique, aiming to describe cultural amenities. In terms of such amenities, we considered the number of existing cultural facilities (libraries, museums, cultural centers, stadiums, gymnasiums, movie theaters), the manifestation index—both from MUNIC 2006—, the size of the cultural labor market (Census of 2010), and per capita expenditures in culture (FIN- BRA). 3PCA—Principal Component Analysis—is a non- arametric method, which aims at expl aining the st ructure of var iance-covari ance through l inear com- binations of the original variables. Each component explains certain per- centage of the system’s variance, in descending order, i.e., the first compo- nent explains a greater percentage than the second one, which, in turn, explains a greater percentage than the third and so on until the com onent Zp, so that the sum of the variance percentages explained by all components is 100%. Once there are p variables, the method can have p to p compo- nents. However, when there is correlation among such variables, the num- ber of components necessary to the explanation of the totality or the great- est part of the v ariance c an be lo wer than p . That means that the great er the correlation among the variables—whether positive or negative—the ten- dency is to a smaller number of components necessary to conserve practi- cally as much in format io n as the o rig inal p var iab les (Mingo ti , 20 05) . Thus , ACP enables a reduction of data and facilitates the interpretation of the correlations among variables. Open Access 95  A. F. MACHADO ET AL. Chart 2. Variables and weights used in t h e construction of the f irst component. Variable Weight School, workshop, or r egular cou rse for formation in typical culture activities—existence 0.1534 Contests—existence of at least one (Cinema, Dance, Photography, Litera ture, Music, Theater, Video, Other) 0.1177 Festivals—existence of at least one (Cinema, Dance, Gastronomy, Music, Theater, Folk traditional manifestations, Video, O t her) 0.1298 Fair—existence of a least one (Arts and crafts, books, fashion) 0.1511 Exhibitions—existence of at least one (Fine arts, visual arts, handicraft, historic collection, photography) 0.1668 Theater company—existence 0.1923 Folk traditional manifestation—existenc e 0.1377 Film club—existence 0.2004 Dance company—existence 0.1670 Music group—existence 0.1689 Orchestra—existence 0.1828 Band—existence 0.1576 Chorus—existence 0.1704 Literary asso ciation—e xist ence 0.2240 Capoeira g ro up—existence 0.1546 Circus—existence 0.1868 Samba school—existence 0.1936 Carnival group—existence 0.1453 Drawing and painting group—existence 0.1818 Fine arts and visual arts group—existence 0.2102 Handicraf t group—existence 0.1684 Other groups—existenc e 0.0958 Local printed d iary—existence 0.1879 Local printed magazine—existe nce 0.2128 Local AM radio—e xistence 0.2014 Local FM radio—existence 0.1702 Community radio—e xi st ence 0.0674 Community TV—existence 0.1457 TV Channel—existence 0.1743 Internet provider 0.1399 Colleges and universities—existence 0.1672 Video store—existence 0.1683 Discs, CDs, tapes and DVDs store—existence 0.1708 Bookstores—existence 0.1909 Clubs and recreational associations—exist ence 0.1599 In this case, the first component explained 49% of total data variance. The weights of the variables included in the first component, which originated the index, are presented in Chart 4. It can be noticed that only expenditures in culture, the num- ber of stadiums and gymnasiums and the Locational Quotient of creative workers (Ql_creative) did not present weight equal or above 0.4 in the index calculation. Among the six clusters which were created, three are quite clear, and the others are quite mixed. Cluster 1 is formed by the cities of São Paulo and Rio de Janeiro, whereas Cluster 2 is formed by Curitiba, Brasília, Salvador, Ribeirão Preto, For- taleza, Porto Alegre, Goiânia, Florianópolis, Santa Maria, Mar- ingá, Piracicaba, Recife, Belo Horizonte, Viçosa, Campinas, Lavras, Botucatu, São Carlos. Cluster 1 includes the two largest and most developed cities in Brazil. For that reason, these cities host a large portion of creative industry such as audiovisual and publishing. Therefore, they are well served in terms of cultural facilities and they show higher proportions of creative workers. Source: authors’ elaboration. According to Table 1, which shows average and standard error of the variables used in the construction of the clusters, we observe that São Paulo and Rio de Janeiro present 53% of the population having completed high school; they have on average 4394 published articles and they are well above the average of the other clusters in terms of number of libraries and museums (22), stadiums and gymnasiums (20), movie theaters (16.5), and concentrate most of the workers in the creative sector (higher QL, equal to 2.71) and of the greater presence of declaration of homosexual unions (0.29% of the households). In terms of sewage systems coverage, an indicator which differentiates basic urban infrastructure in Brazil, over 90% of the households are covered—a percentage which is higher than the observed in the other clusters. On the other hand, the rate of homicides among the youth is high (5731), although it is lower than the rate in cluster 2. Given this configuration, cluster 1 may be termed large Bra zilian creative centers . Cluster 2, in turn, is composed of capitals of important states in Brazil—Curitiba, Brasília, Salvador, Fortaleza, Porto Alegre, Goiânia, Florianópolis, Recife, Belo Horizonte—and cities like Ribeirão Preto, Santa Maria, Maringá, Piracicaba, Viçosa, Campinas, Lavras, Botucatu, São Carlos, where large universi- ties are located. The indicators, although lower than the ones in cluster 1, are the closest ones to those. However, the indicator which refers to crime is much worse, since the homicide rate among young males is the highest one among all the six clus- ters, due to the presence of Belo Horizonte, Curitiba, Recife, Salvador e Florianópolis. We will name this cluster as creative university centers. In cluster 3, which comprises 99 municipalities, it is notice- able the high per capita expenditure in culture (R$326.30), even higher than the one in cluster 1, of the large creative centers. Paulínia is one of the municipalities in this cluster, and has the highest per capita expenditure in culture in Brazil. The city hosts important cultural events such as a Movie Festival4. Guaramiranga, in Ceará, is another municipality in this cluster, and also hosts important festivals (jazz and blues, puppet thea- tre, gastronomy). Other cities such as Araçaí and Catas Altas, in Minas Gerais, are well-known for their stimulus to cultural tourism based on music groups and handicraft, in the first case, nd on historical heritage, in the second case. Cipó/BA, Arroio a 4It is a concern that the local government is questioning the continuity o the aforementioned Movie Festival. Open Access 96 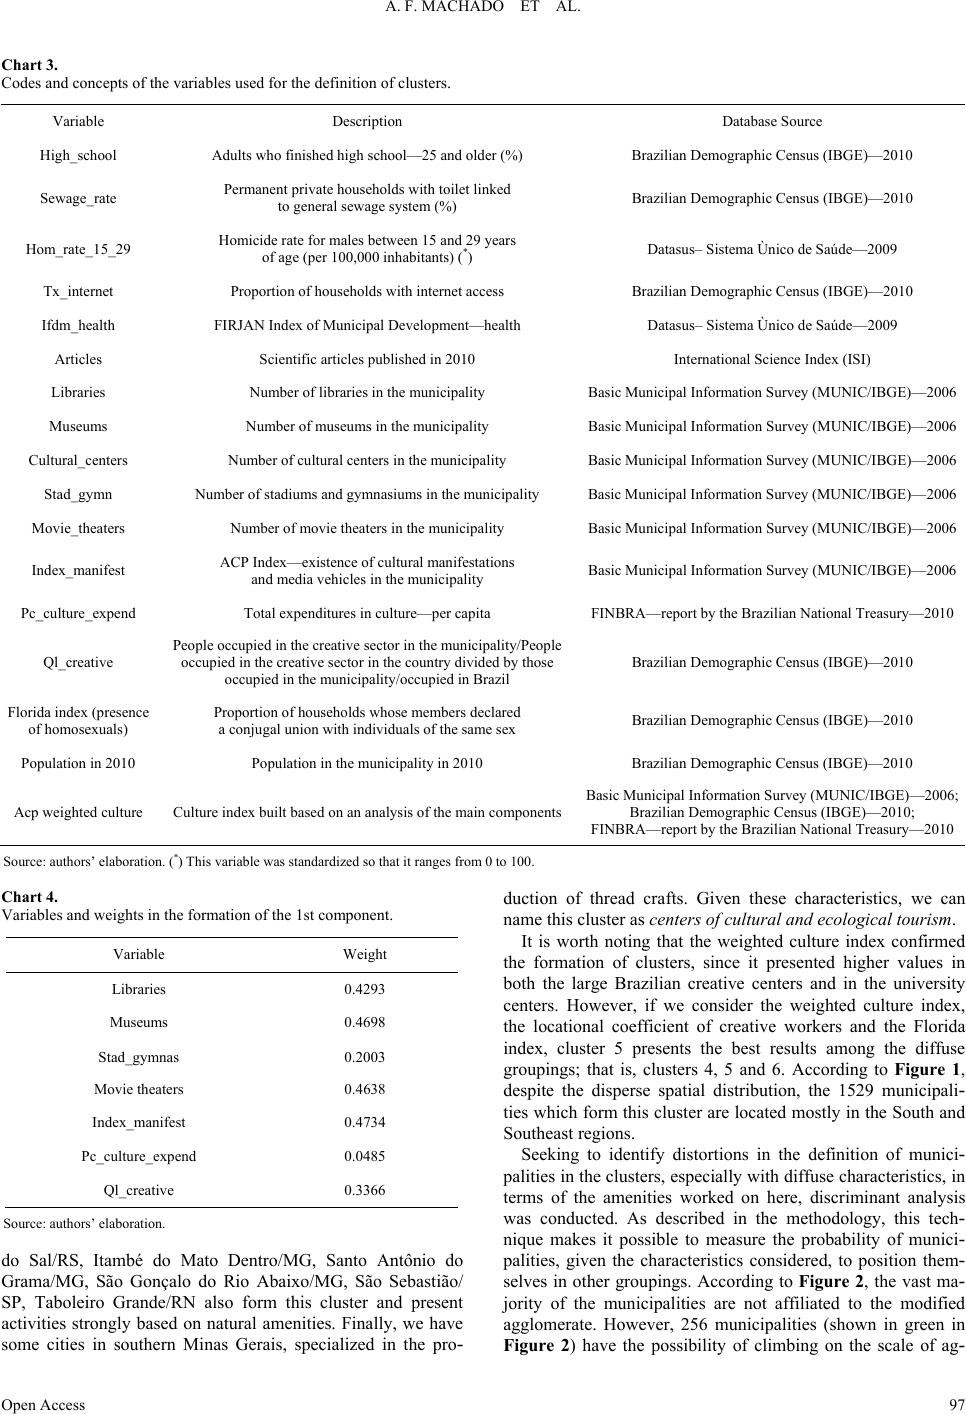 A. F. MACHADO ET AL. Open Access 97 Chart 3. Codes and concepts of t h e variables used for t he de f i ni t ion of clusters. Variable Description Database Source High_school Adults who finished hig h s chool—25 and older (%) Brazilian Demographic Census (IBGE)—2010 Sewage_rate Permanent private households with toilet l inked to general sew age system (%) Brazilian Demographic C ensus (IBGE)—2010 Hom_rate_15_29 Homicide r ate for males between 15 a nd 29 years of age (per 100,000 inhabitants) (*) Datasus– Sistema Ùnico de Saúde—2009 Tx_internet Proportion of households with internet access Brazilian Demographic Census (IBGE)—2010 Ifdm_healt h FIRJAN Index of Municipal Development—he alth Datasus– Sistema Ùnico de Sa úd e—2009 Articles Scientific art icles publish ed in 2010 International Science Index (ISI) Libraries Number of libraries in the municipali t y Basic Munic i p al Information Survey ( M U N I C/IBGE)—2006 Museums Number of museums in the munic i pality Basic Municipal Information Survey (MUNIC/IBGE )—2006 Cultural_centers Number of cultural centers in the mun i cipality Basic Municipal Information Survey (MUNIC/IBGE)—200 6 Stad_gymn Number of stadiums and gymnasiums i n t he municipality Basic Munici p al Information Survey (M U NI C/IBGE)—2006 Movie_theaters Number of movie theaters in the municipality Basic Munici p al Information Survey (M U NI C/IBGE)—2006 Index_manifest ACP Index—existence of cultura l manifestations and medi a vehicles in the municipality Basic Municipal I nformation Survey (MUNIC/IBGE)—200 6 Pc_culture_expend Tot al expenditures in culture—per capita FINBRA—report by th e Brazilian National Treasury—2010 Ql_creative People occupied in the creative secto r in the municipality/People occupied in the creative sector in the country divided by t hose occupied in the municipality/occupied in Brazil Brazilian Demographic Census (IBGE)—20 1 0 Florida index (presence of homosex uals) Proportion of househo lds whose members declared a conjugal union with i ndividuals of the s a me sex Brazilian Demographic C ensus (IBGE)—2010 Population in 2010 Popula tion in the municipality in 2010 Brazilian Demographic Census (IBGE)—2010 Acp weighted cultur e Culture index built bas ed on an analysis of the main components Basic Municipal Information Survey (MUN IC/IBGE)—2006; Brazilian Demographic Census (IBGE)—2010; FINBRA—report by the Brazi li an National Treasury—2010 Source: authors’ elaboration. (*) This variable was standardized so that it ranges from 0 to 100. Chart 4. Variables and weights in the for mation of the 1st component. Variable Weight Libraries 0.4293 Museums 0.4698 Stad_gymnas 0.2003 Movie theaters 0.4638 Index_manifest 0.4734 Pc_culture_expend 0.0485 Ql_creative 0.3366 Source: authors’ elaboration. do Sal/RS, Itambé do Mato Dentro/MG, Santo Antônio do Grama/MG, São Gonçalo do Rio Abaixo/MG, São Sebastião/ SP, Taboleiro Grande/RN also form this cluster and present activities strongly based on natural amenities. Finally, we have some cities in southern Minas Gerais, specialized in the pro- duction of thread crafts. Given these characteristics, we can name this cluster as centers of cultural and ecological tourism. It is worth noting that the weighted culture index confirmed the formation of clusters, since it presented higher values in both the large Brazilian creative centers and in the university centers. However, if we consider the weighted culture index, the locational coefficient of creative workers and the Florida index, cluster 5 presents the best results among the diffuse groupings; that is, clusters 4, 5 and 6. According to Figure 1, despite the disperse spatial distribution, the 1529 municipali- ties which form this cluster are located mostly in the South and Southeast regions. Seeking to identify distortions in the definition of munici- palities in the clusters, especially with diffuse characteristics, in terms of the amenities worked on here, discriminant analysis was conducted. As described in the methodology, this tech- nique makes it possible to measure the probability of munici- palities, given the characteristics considered, to position them- selves in other groupings. According to Figure 2, the vast ma- jority of the municipalities are not affiliated to the modified agglomerate. However, 256 municipalities (shown in green in igure 2) have the possibility of climbing on the scale of ag- F 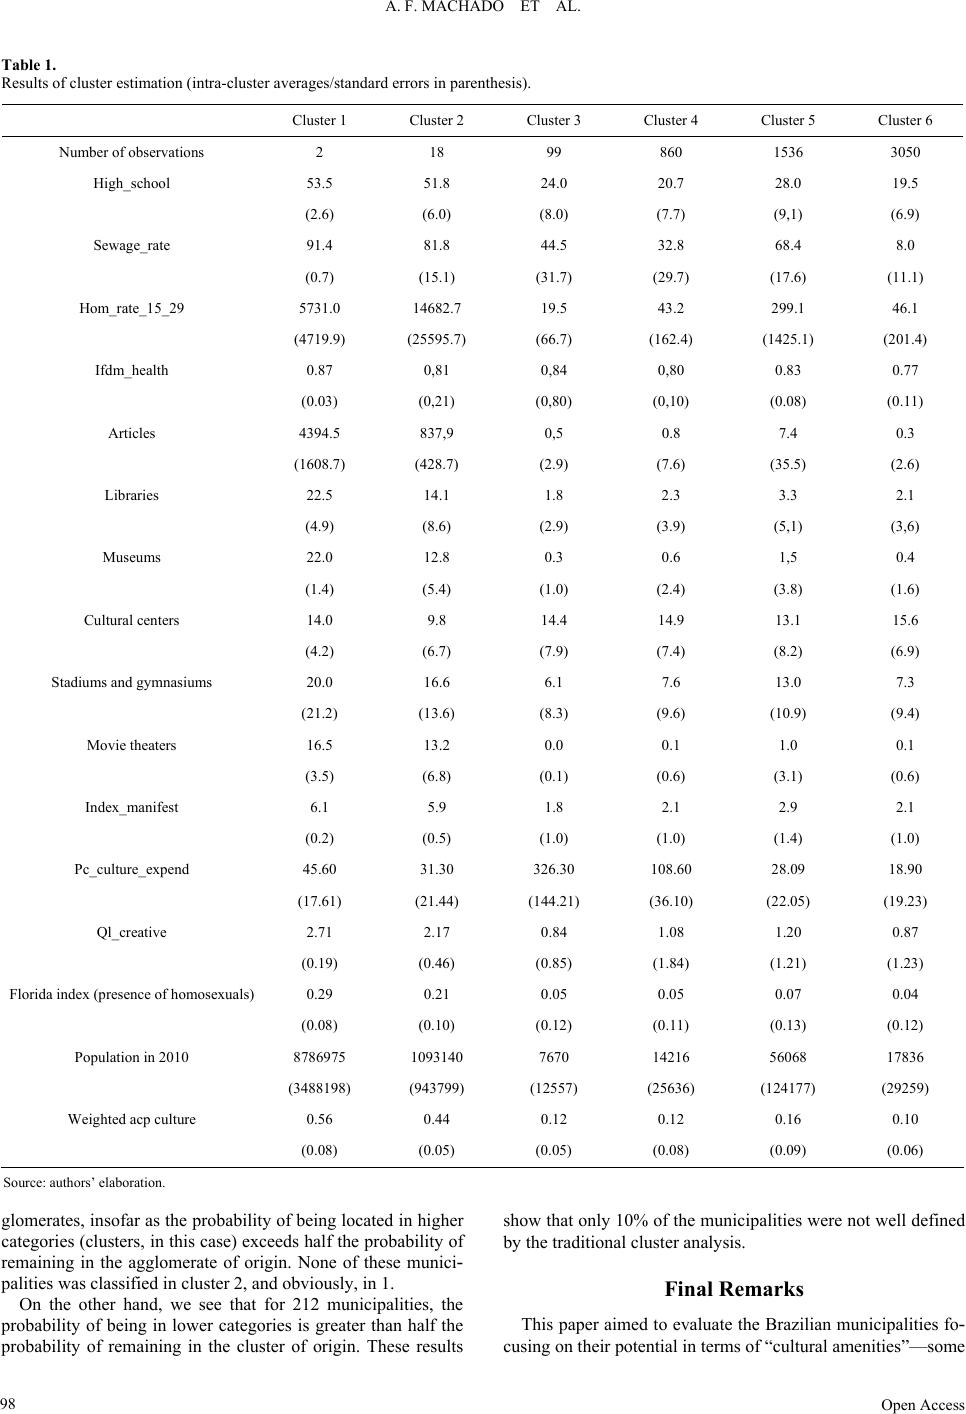 A. F. MACHADO ET AL. Table 1. Results of cluster estimat i o n (intra-cluster averages/standard errors in parenthesis). Cluster 1 Cluster 2 Cluster 3 Cluster 4 Cluster 5 Cluster 6 Number of observation s 2 18 99 860 1536 3050 High_school 53.5 51.8 24.0 20.7 28.0 19.5 (2.6) (6.0) (8.0) (7.7) (9,1) (6.9) Sewage_rate 91.4 81.8 44.5 32.8 68.4 8.0 (0.7) (15.1) (31.7) (29.7) (17.6) (11.1) Hom_rate_15_29 5731.0 14682.7 19.5 43.2 299.1 46.1 (4719.9) (25595.7) (66.7) (162.4) (1425.1) (201.4) Ifdm_health 0.87 0,81 0,84 0,80 0.83 0.77 (0.03) (0,21) (0,80) (0,10) (0.08) (0.11) Articles 4394.5 837,9 0,5 0.8 7.4 0.3 (1608.7) (428.7) (2.9) (7.6) (35.5) (2.6) Libraries 22.5 14.1 1.8 2.3 3.3 2.1 (4.9) (8.6) (2.9) (3.9) (5,1) (3,6) Museums 22.0 12.8 0.3 0.6 1,5 0.4 (1.4) (5.4) (1.0) (2.4) (3.8) (1.6) Cultural centers 14.0 9.8 14.4 14.9 13.1 15.6 (4.2) (6.7) (7.9) (7.4) (8.2) (6.9) Stadiums and gymnasiums 20.0 16.6 6.1 7.6 13.0 7.3 (21.2) (13.6) (8.3) (9.6) (10.9) (9.4) Movie theaters 16.5 13.2 0.0 0.1 1.0 0.1 (3.5) (6.8) (0.1) (0.6) (3.1) (0.6) Index_manifest 6.1 5.9 1.8 2.1 2.9 2.1 (0.2) (0.5) (1.0) (1.0) (1.4) (1.0) Pc_culture_expend 45.60 31.30 326.30 108.60 28.09 18.90 (17.61) (21.44) (144.21) (36.10) (22.05) (19.23) Ql_creative 2.71 2.17 0.84 1.08 1.20 0.87 (0.19) (0.46) (0.85) (1.84) (1.21) (1.23) Florida index (presence of homosexuals)0.29 0.21 0.05 0.05 0.07 0.04 (0.08) (0.10) (0.12) (0.11) (0.13) (0.12) Population in 2010 8786975 1093140 7670 14216 56068 17836 (3488198) (943799) (12557) (25636) (124177) (29259) Weighted acp culture 0.56 0.44 0.12 0.12 0.16 0.10 (0.08) (0.05) (0.05) (0.08) (0.09) (0.06) Source: authors’ elaboration. glomerates, insofar as the probability of being located in higher categories (clusters, in this case) exceeds half the probability of remaining in the agglomerate of origin. None of these munici- palities was classified in cluster 2, and obviously, in 1. On the other hand, we see that for 212 municipalities, the probability of being in lower categories is greater than half the probability of remaining in the cluster of origin. These results show that only 10% of the municipalities were not well defined by the traditional cluster analysis. Final Remarks This paper aimed to evaluate the Brazilian municipalities fo- using on their potential in terms of “cultural amenities”—some c Open Access 98 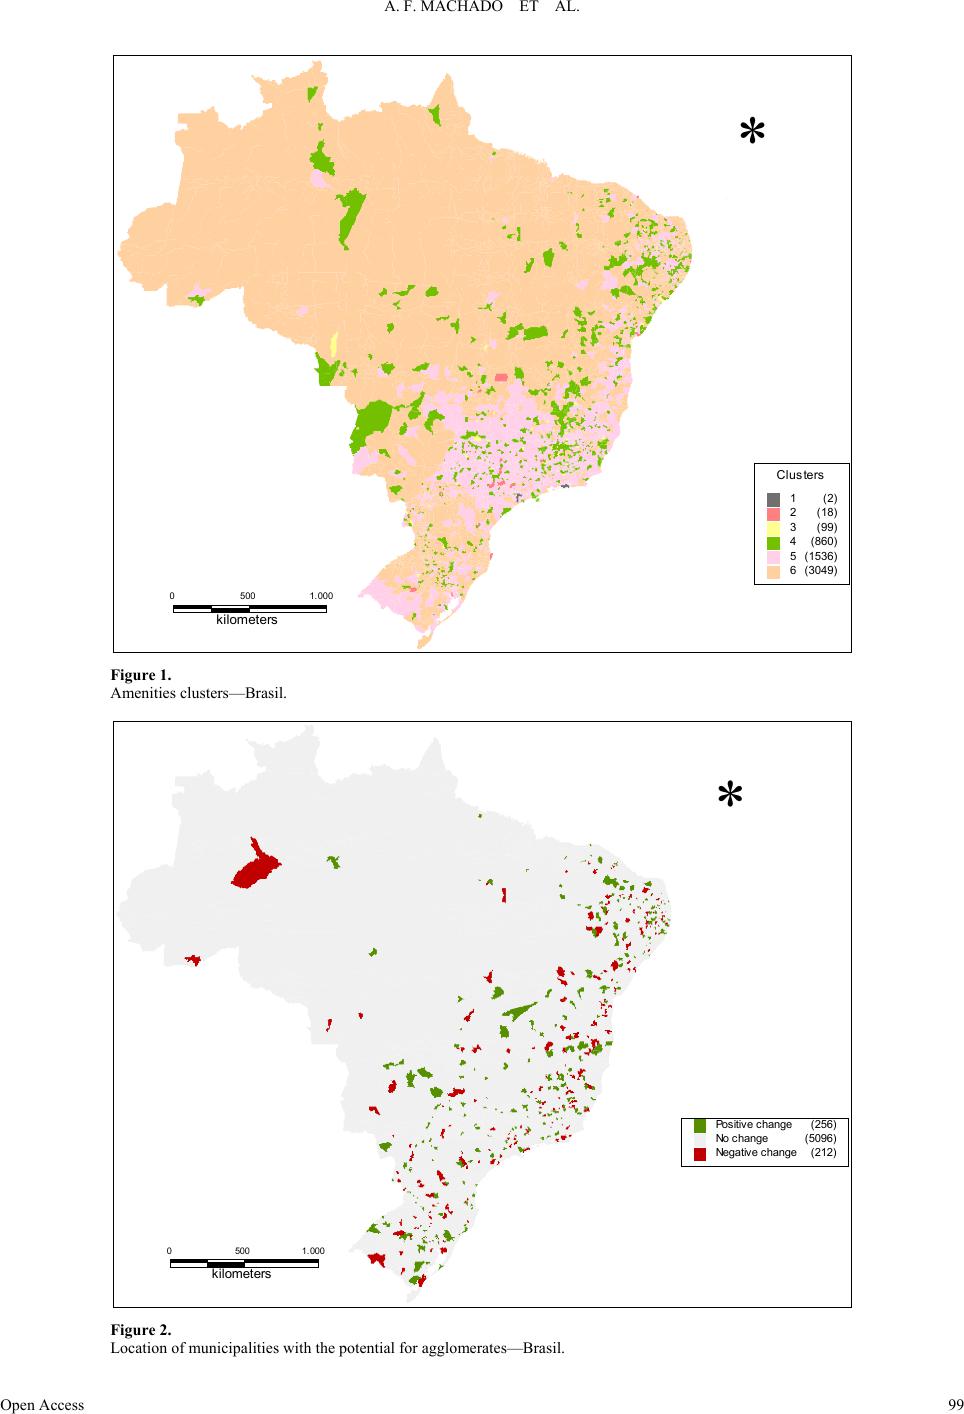 A. F. MACHADO ET AL. 0500 1.000 kilometers Clus ters 1 (2) 2 (18) 3 (99) 4 (860) 5 (1536) 6 (3049) Figure 1. Amenities clusters—Brasil. 05001.000 kilometers Positive change (256) No change (5096) Negati ve change (212) Figure 2. Location of municipalities with the potential for agglom erates—B rasil . Open Access 99 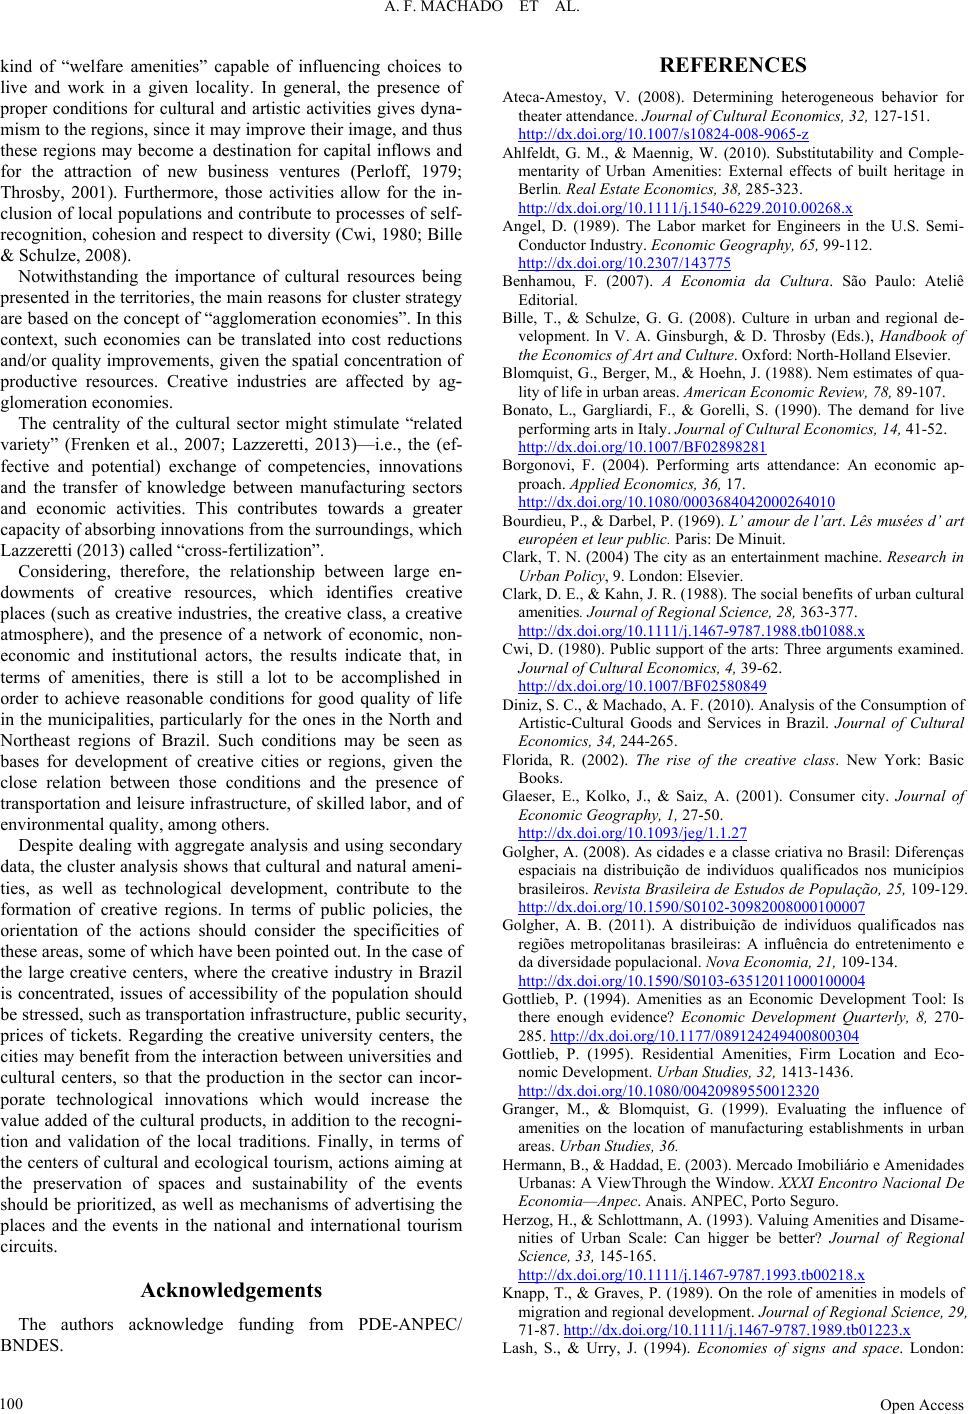 A. F. MACHADO ET AL. kind of “welfare amenities” capable of influencing choices to live and work in a given locality. In general, the presence of proper conditions for cultural and artistic activities gives dyna- mism to the regions, since it may improve their image, and thus these regions may become a destination for capital inflows and for the attraction of new business ventures (Perloff, 1979; Throsby, 2001). Furthermore, those activities allow for the in- clusion of local populations and contribute to processes of self- recognition, cohesion and respect to diversity (Cwi, 1980; Bille & Schulze, 2008). Notwithstanding the importance of cultural resources being presented in the territories, the main reasons for cluster strategy are based on the concept of “agglomeration economies”. In this context, such economies can be translated into cost reductions and/or quality improvements, given the spatial concentration of productive resources. Creative industries are affected by ag- glomeration economies. The centrality of the cultural sector might stimulate “related variety” (Frenken et al., 2007; Lazzeretti, 2013)—i.e., the (ef- fective and potential) exchange of competencies, innovations and the transfer of knowledge between manufacturing sectors and economic activities. This contributes towards a greater capacity of absorbing innovations from the surroundings, which Lazzeretti (2013) called “cross-fertilization”. Considering, therefore, the relationship between large en- dowments of creative resources, which identifies creative places (such as creative industries, the creative class, a creative atmosphere), and the presence of a network of economic, non- economic and institutional actors, the results indicate that, in terms of amenities, there is still a lot to be accomplished in order to achieve reasonable conditions for good quality of life in the municipalities, particularly for the ones in the North and Northeast regions of Brazil. Such conditions may be seen as bases for development of creative cities or regions, given the close relation between those conditions and the presence of transportation and leisure infrastructure, of skilled labor, and of environmental quality, among others. Despite dealing with aggregate analysis and using secondary data, the cluster analysis shows that cultural and natural ameni- ties, as well as technological development, contribute to the formation of creative regions. In terms of public policies, the orientation of the actions should consider the specificities of these areas, some of which have been pointed out. In the case of the large creative centers, where the creative industry in Brazil is concentrated, issues of accessibility of the population should be stressed, such as transportation infrastructure, public security, prices of tickets. Regarding the creative university centers, the cities may benefit from the interaction between universities and cultural centers, so that the production in the sector can incor- porate technological innovations which would increase the value added of the cultural products, in addition to the recogni- tion and validation of the local traditions. Finally, in terms of the centers of cultural and ecological tourism, actions aiming at the preservation of spaces and sustainability of the events should be prioritized, as well as mechanisms of advertising the places and the events in the national and international tourism circuits. Acknowledgements The authors acknowledge funding from PDE-ANPEC/ BNDES. REFERENCES Ateca-Amestoy, V. (2008). Determining heterogeneous behavior for theater attendance. Journal of Cultural Economics, 32, 127-151. http://dx.doi.org/10.1007/s10824-008-9065-z Ahlfeldt, G. M., & Maennig, W. (2010). Substitutability and Comple- mentarity of Urban Amenities: External effects of built heritage in Berlin. Real Estate Econom ics , 38, 285-323. http://dx.doi.org/10.1111/j.1540-6229.2010.00268.x Angel, D. (1989). The Labor market for Engineers in the U.S. Semi- Conductor Industry. Economic Geography, 65, 99-112. http://dx.doi.org/10.2307/143775 Benhamou, F. (2007). A Economia da Cultura. São Paulo: Ateliê Editorial. Bille, T., & Schulze, G. G. (2008). Culture in urban and regional de- velopment. In V. A. Ginsburgh, & D. Throsby (Eds.), Handbook of the Economics of Art and Culture. Oxford: North-Holland Elsevier. Blomquist, G., Berger, M., & Hoehn, J. (1988). Nem estimates of qua- lity of life in urban areas. American Economic R e v i ew , 78 , 89-107. Bonato, L., Gargliardi, F., & Gorelli, S. (1990). The demand for live performing arts in Italy. Jo u r na l of Cu l t ur a l Economics, 14, 41-52. http://dx.doi.org/10.1007/BF02898281 Borgonovi, F. (2004). Performing arts attendance: An economic ap- proach. Applied Economics, 36, 17. http://dx.doi.org/10.1080/0003684042000264010 Bourdieu, P., & Darbel, P. (1969). L’ amour de l’art. Lês musées d’ art européen et leur public. Paris: De Minuit. Clark, T. N. (2004) The city as an entertainment machine. Research in Urban Policy, 9. Lond on: Elsevier. Clark, D. E., & Kahn, J. R. (1988). The social benefits of urban cultural amenities. Journal of Regional Science, 28, 363-377. http://dx.doi.org/10.1111/j.1467-9787.1988.tb01088.x Cwi, D. (1980). Public support of the arts: Three arguments examined. Journal of Cultural Economics, 4, 39-62. http://dx.doi.org/10.1007/BF02580849 Diniz, S. C., & Machado, A. F. (2010). Analysis of the Consumption of Artistic-Cultural Goods and Services in Brazil. Journal of Cultural Economics, 34, 244- 265. Florida, R. (2002). The rise of the creative class. New York: Basic Books. Glaeser, E., Kolko, J., & Saiz, A. (2001). Consumer city. Journal of Economic Geography, 1, 27-50. http://dx.doi.org/10.1093/jeg/1.1.27 Golgher, A. (2008). As cidades e a classe criativa no Brasil: Diferenças espaciais na distribuição de indivíduos qualificados nos municípios brasileiros. Revista Brasileira de Estudos de População, 25, 109-129. http://dx.doi.org/10.1590/S0102-30982008000100007 Golgher, A. B. (2011). A distribuição de indivíduos qualificados nas regiões metropolitanas brasileiras: A influência do entretenimento e da diversidade populacional. Nova Economia, 21, 109-134. http://dx.doi.org/10.1590/S0103-63512011000100004 Gottlieb, P. (1994). Amenities as an Economic Development Tool: Is there enough evidence? Economic Development Quarterly, 8, 270- 285. http://dx.doi.org/10.1177/089124249400800304 Gottlieb, P. (1995). Residential Amenities, Firm Location and Eco- nomic Development. Urba n St udi es, 32, 1413-1436. http://dx.doi.org/10.1080/00420989550012320 Granger, M., & Blomquist, G. (1999). Evaluating the influence of amenities on the location of manufacturing establishments in urban areas. Urban Studies, 36. Hermann, B., & Haddad, E. (2003). Mercado Imobiliário e Amenidades Urbanas: A ViewThrough the Window. XXXI Encontro Nacional De Economia—Anpec. Anais. ANPEC, Porto Seguro. Herzog, H., & Schlottmann, A. (1993). Valuing Amenities and Disame- nities of Urban Scale: Can higger be better? Journal of Regional Science, 33, 145-165. http://dx.doi.org/10.1111/j.1467-9787.1993.tb00218.x Knapp, T., & Graves, P. (1989). On the role of amenities in models of migration and regional development. Journal of Regional Science, 29, 71-87. http://dx.doi.org/10.1111/j.1467-9787.1989.tb01223.x Lash, S., & Urry, J. (1994). Economies of signs and space. London: Open Access 100 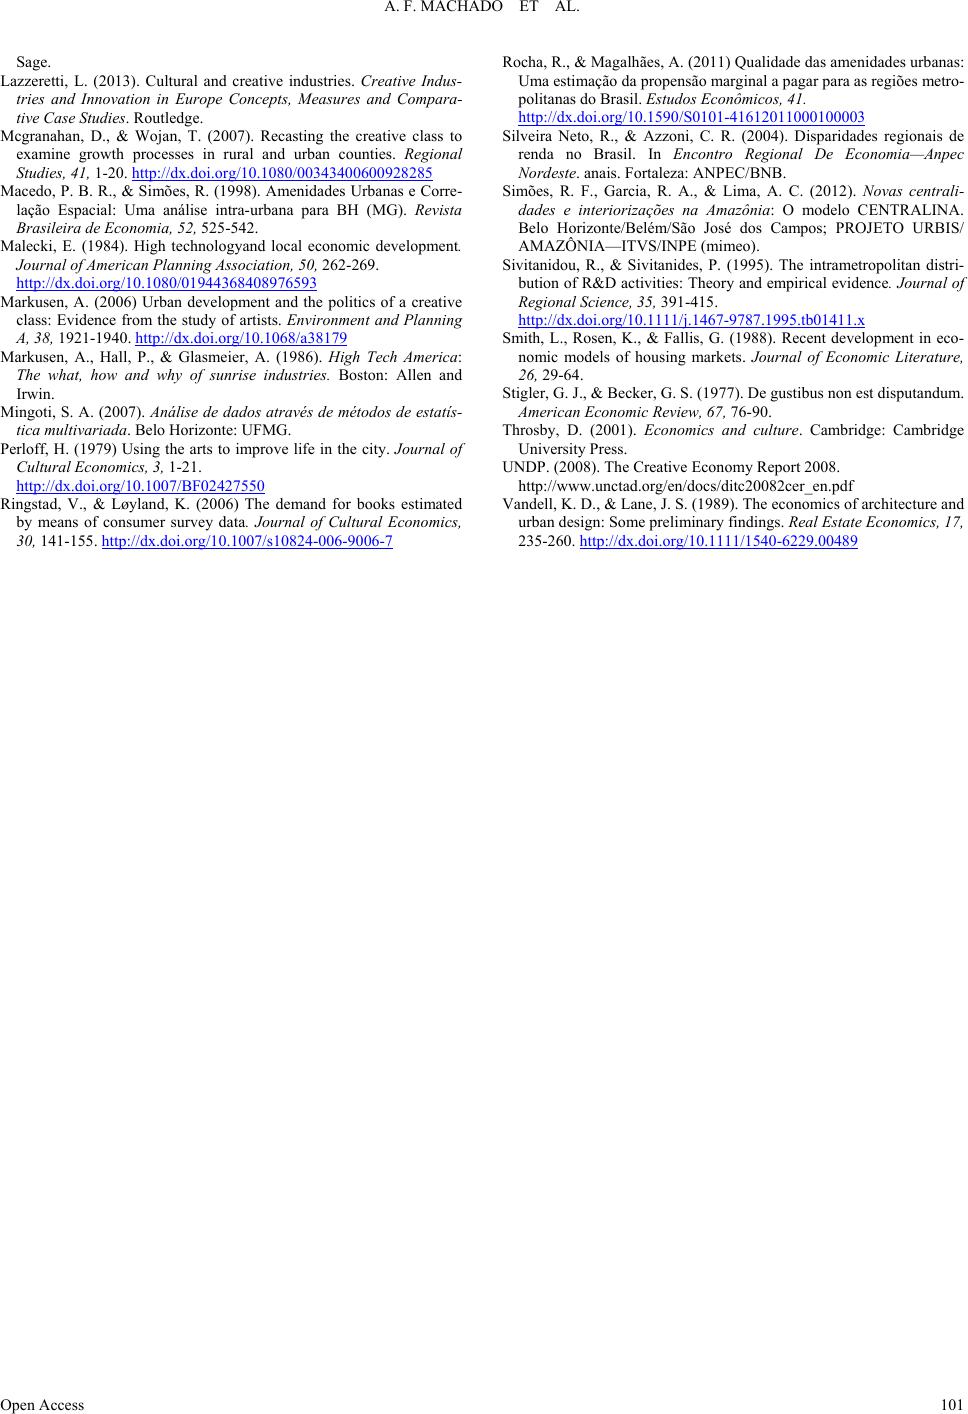 A. F. MACHADO ET AL. Sage. azzerettLi, L. (2013). Cultural and creative industries. Creative Indus- M2007). Recasting the creative class to tries and Innovation in Europe Concepts, Measures and Compara- tive Case Studies. Routledge. cgranahan, D., & Wojan, T. ( examine growth processes in rural and urban counties. Regional Studies, 41, 1-20. http://dx.doi.org/10.1080/00343400600928285 acedo, P. B. R., & Simões, R. (1998). Amenidades Urbanas e CoMrre- Mcal economic development. lação Espacial: Uma análise intra-urbana para BH (MG). Revista Brasileira de Economia, 52 , 525-542. alecki, E. (1984). High technologyand lo Journal of American Planning Association, 50, 262-269. http://dx.doi.org/10.1080/01944368408976593 arkusen, A. (2006) Urban development and the politics of a cMreative class: Evidence from the study of artists. Environment and Planning A, 38, 1921-1940. http://dx.doi.org/10.1068/a38179 arkusen, A., Hall, P., & Glasmeier, A. (1986). HighM Tech America: M A. (2007). Análise de dados através de métodos de estatís- Pfe in the city. Journal of 427550 The what, how and why of sunrise industries. Boston: Allen and Irwin. ingoti, S. tica multivariada. Belo Horizonte: UFMG. erloff, H. (1979) Using the arts to improve li Cultural Economics , 3, 1-21. http://dx.doi.org/10.1007/BF02 Rdemand for books estimated ingstad, V., & Løyland, K. (2006) The by means of consumer survey data. Journal of Cultural Economics, 30, 141-155. http://dx.doi.org/10.1007/s10824-006-9006-7 Rocha, R., & Magalhães, A. (2011) Qualidade das amenidades urbanas: Uma estimação da propensão marginal a pagar para as regiões metro- politanas do Brasil. Estudos Econômicos, 41. http://dx.doi.org/10.1590/S0101-41612011000100003 Silveira Neto, R., & Azzoni, C. R. (2004). Disparidades regionais de renda no Brasil. In Encontro Regional De Economia—Anpec Nordeste. anais. Fortaleza: ANPEC/BNB. Simões, R. F., Garcia, R. A., & Lima, A. C. (2012). Novas centrali- dades e interiorizações na Amazônia: O modelo CENTRALINA. Belo Horizonte/Belém/São José dos Campos; PROJETO URBIS/ AMAZÔNIA—ITVS/INPE (mimeo). Sivitanidou, R., & Sivitanides, P. (1995). The intrametropolitan distri- bution of R&D activities: Theory and empirical evidence. Journal of Regional Science, 35, 391-415. http://dx.doi.org/10.1111/j.1467-9787.1995.tb01411.x Smith, L., Rosen, K., & Fallis, G. (1988). Recent development in eco- nomic models of housing markets. Journal of Economic Literature, 26, 29-64. Stigler, G. J., & Becker, G. S. (1977). De gustibus non est disputandum. American Economic Review, 67, 76-90. Throsby, D. (2001). Economics and culture. Cambridge: Cambridge University Press. UNDP. (2008). The Creative Economy Report 2008. http://www.unctad.org/en/docs/ditc20082cer_en.pdf Vandell, K. D., & Lane, J. S. (1989). The economi c s of architecture a nd urban design: Some prelim in ar y findings. Real Estate Economics, 17, 235-260. http://dx.doi.org/10.1111/1540-6229.00489 Open Access 101
|