 Food and Nutrition Sciences, 2013, 4, 1271-1280 Published Online December 2013 (http://www.scirp.org/journal/fns) http://dx.doi.org/10.4236/fns.2013.412163 Open Access FNS Simple Food Group Diversity as a Proxy Indicator for Iron and Vitamin A Status of Rural Primary School Children in Uganda Hedwig Acham, Gaston Ampek Tumuhimbise*, Joyce K. Kikafunda Department of Food Technology and Nutrition, School of Food Technology, Nutrition and Bioengineering, College of Agricultural and Environmental Sciences, Makerere University, Kampala, Uganda. Email: *ampston@yahoo.com Received September 3rd, 2013; revised October 3rd, 2013; accepted October 10th, 2013 Copyright © 2013 Hedwig Acham et al. This is an open access article distributed under the Creative Commons Attribution License, which permits unrestricted use, distribution, and reproduction in any medium, provided the original work is properly cited. In accor- dance of the Creative Commons Attribution License all Copyrights © 2013 are reserved for SCIRP and the owner of the intellectual property Hedwig Acham et al. All Copyright © 2013 are guarded by law and by SCIRP as a guardian. ABSTRACT Children in resource poor settings are at a high risk of inadequate iron and vitamin A intake when diets lack diversity and are dominated by staple foods. Yet comparative information on diet quality among school children is scarce. The objective of the study was to assess the potential of simple food group diversity to serve as a proxy indicator of iron and vitamin A status among rural school children in Uganda. A cross sectional correlation model of associations between Food Group Diversity (FGD) and iron and vitamin A status was used. We analyzed 8 schools in Kumi District, Uganda, randomly selected from the 34 schools that participated in the main part of the study. Our sample included primary school children, aged between 9 - 15 years (n = 172). Food group diversity and food variety (FV) were calculated from both a food frequency questionnaire (FFQ) and a 24-hour dietary recall. The FGD and FVS were tested against iron (as serum ferritin) and vitamin A (as serum retinol) status. The FGD (based on FFQ data) was 9.6 (±1.9). There was a posi- tive correlation between 24-hour recall and FFQ for consumption of cereals (Corr. Coef = 0.28; p < 0.05), which was also the most highly consumed group (98.9% & 86.9% by FFQ and 24-hour recall; respectively). Consistent with other studies, increase in the number of food groups significantly increased serum ferritin and serum retinol measures (p < 0.001). Presence of at least one food item in the “roots & tubers”; “cereals”; and “pulses/nuts”, significantly increased serum ferritin and serum retinol concentrations (p < 0.01). We speculate that simple food group diversity may reflect intake and serve as a simple indicator of iron and vitamin A status among school children. Strategies aimed at increas- ing dietary diversity in the community may benefit the families of these children and improve their micronutrient status. Keywords: Food Group; Diversity; Iron; Vitamin A; Proxy Indicator 1. Introduction Monotony in diet has been described as the result of poverty and poor nutrition [1], and indeed; typical child diets in communities and households with high rates of malnutrition are monotonous and bulky. Many infants and young children in Sub-Saharan Africa subsist on gruel and porridge prepared from staples such as cereals, roots and tubers accompanied with vegetables and pulses [2-4]. Plant sourced foods account for more than three- quarters of energy intake and in some cases similar pro- portions of protein and micronutrient intakes [5]. Studies have presented information implying ecologi- cal associations between diversity and overall nutrition [6], where it has been suggested that the nutritional suc- cess of the participants is linked with the greater diversity of their diet [7]. Among school children in South Africa [8], the diet comprised a limited number of food items, and the resultant vitamin A deficiency prevalence was a public health problem. Other studies have similarly found elevated levels of malnutrition and nutrient defi- ciencies in populations whose diets are restricted in vari- ety or lack specific components that characterize high quality diets [9,10]. In Uganda, two measures of diet quality (lack of meat *Corresponding author.  Simple Food Group Diversity as a Proxy Indicator for Iron and Vitamin A Status of Rural Primary School Children in Uganda 1272 and cow’s milk; and low intake of energy from fat) were shown to have positive associations with nutritional out- comes (particularly underweight, marasmus and low Mid-upper-arm circumference measures); whereas meas- ures of quantity showed no significant relationships with the same outcomes [11]. Dietary diversity studies in Uganda are limited, and much less among school children. However, reports in- dicate that the population diet is generally less diverse [12] and predominantly vegetarian with only 11% - 13% of the energy intake is being supplied by foods of animal origin. All regions of the country have insufficient intake of micronutrients provided preferentially by meat, fish, poultry and eggs; including vitamin A, vitamin B-12, iron, zinc, and calcium. Intra-household food allocation shows that generally, the dietary intake of children in Uganda is not any different from that of other household members [13]. Anaemia in Uganda remains a wide spread problem (49% and 23% for children and women 15 - 45 y respe- cively); with the prevalence of iron deficiency being es- timated at 2 to 2.5 times the prevalence of anaemia [13]. Nearly half the anaemia suffered is reportedly iron-defi- ciency (IDA); the other half being anaemia is caused by malaria, worm infestations and chronic disease including HIV infection [14]. On the one hand, Uganda is among the African countries reported to be at high risk, with about 20 percent of children in Uganda estimated to be vitamin A deficient [15]. VAD can impair immunity and cause eye damage that can lead to blindness and even death. The Government has attempted to address these high levels of micronutrient malnutrition by conducting iron and vitamin A supplementation for children of 6 - 59 months and for women of 15 - 49 years. Food-based ap- proaches through diet diversification are also being pro- moted through food fortification, nutrition education, particularly at health facilities during antenatal and post- natal visits. However, more initiatives are needed to tackle micronutrient deficiency in a sustainable way. These investments in children and women have led to developmental successes in Uganda in the recent years, notably in primary education. There is evidence that pri- mary enrollment has increased, gender parity has been reached while adult and youth literacy rates are above regional averages [16]. However, more than half of the enrolled school children do not complete primary school. There is paucity of data on the health and nutrition of school-age children in Uganda, and even where data is available, it is not comprehensive. With limited data for the age group, no interventions can be planned to target their needs, and yet it is well known that school age and adolescence represent an additional window during which growth promoting interventions, possibly initiated years before puberty, might yield substantial life cycle and intergenerational effects [17]. This study explored the potential for use of simple food group diversity to serve as a proxy indicator of iron and vitamin A status among rural school children in Uganda aged 9 - 15 years. 2. Materials and Methods 2.1. Study Design We used a cross-sectional study design, involving 172 primary school children in Grade 4, aged between 9 - 15 years. 2.2. Study Area The study was conducted in Kumi district, Eastern Uganda in the period 2006-2007. Kumi district is ap- proximately 2821 km2 in area. The climate is equatorial with a bimodal type of rainfall received in the months of April-May and July-August, and a main dry season run- ning from December to February. The vegetation is pre- dominantly savannah, although punctuated by thickets, some forest plantations, and riparian vegetation [18]. The district borders Lake Kyoga basin and the wetland sur- rounding covers 35% of the total area, providing an im- portant resource to the livelihood of the people in the district [19]. The settlement patterns in the district reflect the resources available, a phenomenon in most districts of Uganda where agriculture is the major backbone of the economy. 2.3. Sampling Procedure and Sample Size Determination This study was part of a larger study earlier reported [20]. Of the 34 schools selected for the main study (following a modified cluster sampling procedure), a sample of 8 schools were randomly selected to participate in this par- ticular study. The sample size was based on the estimate of the initial sample size (n = 1020), using ±10% precision, a confidence level of 95% and p-value of 0.5. Considering an original sample size; the required sample (n) for this particular study was 95. However, to take care of drop-out, the number was doubled. The data collected for food intake, iron and vitamin A studies (n = 172) are presented in this paper. All participating schools were public (government-funded) mixed day schools. 2.4. Study Implementation 2.4.1. Blood Collection, Preparation and Analyses A sample of 5 ml of blood was obtained from each child by venipuncture [21]. Haemoglobin (Hb) was assessed in the field using a portable HemoCue machine (model: 201, Ängelholm, Sweden). Anaemia was defined as Hb < 12.0 Open Access FNS  Simple Food Group Diversity as a Proxy Indicator for Iron and Vitamin A Status of Rural Primary School Children in Uganda 1273 mg/l following recommended classification [22]. A sample of 20 μL of whole blood was transferred di- rectly onto blood collection cards (Whatman 903, Sch- leicher & Schuell bioscience; Ref. 10 539 859; GmbH, Germany), for preparation of dried blood spots (DBS). The DBS cards were immediately kept in a specially de- signed dark box and allowed to dry for 3 hours, and later put in Ziploc bags with a desiccant (minipax sorbent; 1-800-445-9890, Multisorb technologies Inc), kept in the dark box and transferred into an ice box, transported to the laboratory at Makerere University where they were kept at low temperatures (4˚C - 6˚C), until transportation for retinol analysis. Because of the rural field conditions, it was not possible to centrifuge the blood; instead blood was left to stand in darkness in the tubes overnight, which allowed for separation. After separation had been achieved, 20 μL of serum was drawn using a capillary tube, spotted onto filter paper cards and left to dry for 3 hours. The DSS cards were put in Ziploc bags with a desiccant, kept at low temperatures (4˚C - 6˚C) until transportation for serum ferritin analysis. Both assays of Dried Serum Spots and Dried Blood Spots were per- formed at Vitas AS Analytical Laboratory, Oslo, Nor- way. Serum ferritin was analyzed based on ELISA princi- ples of assays as previously described [23], and modified according to specifications on the kit. The assay was done using AssayMax Ferritin ELISA kit (EF2003-1, MO-USA). Control serum spots were prepared in the laboratory, with some slight modifications made in vol- umes of stock and buffer used in standard preparation. Results were generated on a microplate reader (Mul- tiskan Ascent, 15018820, version 1.3.2, Thermolab sys- tems, Helsinki-Finland) at a wavelength of 450 nm. Ad- justments were made for recovery and dilution by multi- plying the serum concentrations obtained from the mul- tiscan reader by the dilution factor of 10. Being an acute protein whose concentration can rise during inflamma- tion, the customary threshold (<12 - 15 μg/L) was not used especially considering the fact that many of the children had malaria infection. The cut-off for serum ferritin was raised to 30 μg/L. Retinol assay was done by isocratic modification of Bieri’s High Performance Liquid Chromatography. The modification was carried out using a combination of high performance liquid chromatography and mass spectro- metry (LC-MS assay principal). Whole blood retinol values were validated using the HPLC procedure fol- lowing Bieri’s high performance liquid chromatography method, to adjust for recovery, storage effects and volume of serum used in preparation of DBS. A median factor of 1.07 was obtained for 11 serum samples, which was mul- tiplied to all the whole blood retinol values to convert them to serum retinol equivalents. As recommended by a previous study [24], no adjustments were made for in- flammation. Therefore, serum retinol levels from labora- tory assays were used after validating for recovery, stor- age effects and volumes, without correcting for inflame- mation. A serum retinol value <0.70 μmol/L, set by WHO was used as cut off point to define Vitamin A deficiency [25]. 2.4.2. Dietary Assessment A pre-tested Food Frequency Questionnaire (FFQ) was used in the household interviews to obtain food con- sumption data, which was done in home settings. The questionnaire was designed to capture information of dietary consumption over a period of 7 days. This was done so as to have long enough time to offer representa- tive picture of the diet, but also short enough that the respondent can accurately recall their consumption [26]. For this study, the 13 food groups recommended for in- dividual assessment [26], including meat/poultry, fish, egg, Milk/milk products, Roots/tubers/plantain, cereal, dark green leafy vegetables, pulses/nuts, vitamin A rich vegetables, other vegetables, vitamin A rich fruits, other fruits, fat/oil; were considered for dietary diversity ana- lysis. The miscellaneous groups (sweets, coffee and tea) were excluded taking into consideration the poor bio- availability of micronutrients. Preliminary investigations revealed 46 main foods (Table 1), which were recorded into the 13 food groups, and used to determine the Food Group Diversity (FGD) and food variety scores (FVS) as shown in Table 3. A calculation of FGD was done by summing the number of unique food groups reportedly consumed in the period of the study. For purposes of comparison, a single 24-h recall was administered, to provide information of foods consumed in the last 24 hours. A modified standard sample data sheet [27] was used in the interviews. A pre-test of the interview was carried out before the actual interviews started, and to have the children freely express them- selves, one teacher in each of the participating schools was involved in the interview process, as previously recommended [28]. The teachers underwent thorough training on questioning techniques, details required, do’s and don’ts in case of failure of recall. All 24-h recall in- terviews were conducted at school in the native language “Ateso”, which was chosen to make it easier for the school children to freely express themselves and to feel comfortable. The school children were permitted to men- tion foods in any order. 2.5. Data Analysis Data was analyzed using the Statistical Package for ocial Scientists (SPSS, version 15.0; 2006 SPSS Inc; S Open Access FNS  Simple Food Group Diversity as a Proxy Indicator for Iron and Vitamin A Status of Rural Primary School Children in Uganda Open Access FNS 1274 Table 1. Food groups and food varieties used for construction of dietary diversity scores. Food group Food varieties Food group Food varieties 1. Cereals/cereal products Rice Maize Millet Sorghum Porridge Bread 2. DGLVs DGLVs (all forms) 3. Roots/ tubers/plantains Cassava White potato 4. Other vegetables Cabbage Eggplant 5. Milk/milk products Milk Milk products 6. Vitamin A rich vegetables Yellow potatoes Tomatoes 7. Meat/poultry Meat (all forms) Poultry (all forms) 8. Vitamin A rich fruits Mangoes Paw paws 9. Fish Fish (all forms) 10. Other fruits Oranges Pineapple Banana Jack fruit Guavas Water melon Fruit juice 11. Eggs Eggs (all forms) 12. Oil/ oil containing foods Oil (used in cooking) Ghee Margarine Chapatti Popcorn Doughnut Pancakes 13. Pulses/nuts Groundnuts Sesame seeds Beans Peas Soy/soy products Chicago, USA). Descriptive statistics for frequencies of food groups consumed and FGD; means and standard deviations of iron and vitamin A concentrations; and contribution of different food groups to the biochemical variables were generated to characterize the intake of the children. Correlation tests for strength of the relationship between FGD and iron and vitamin A concentrations were calculated using linear regression analysis. A p-value of 0.05 was considered as the level at which tests were significant. 2.6. Ethical Consideration Clearance to conduct the study in schools was obtained from the National Council for Science and Technology after the proposal was vetted and approved by the Ethical Committee based at the College of Health Sciences, Makerere University. Permission was sought from the Ministry of Education and Sports (MOES) and the Dis- trict Education Office (DEO), who then gave instructions to all head teachers in schools where the study was to be conducted. Written informed consent was further ob- tained from the parents and guardians and /or caretakers of all the children in class 4 and assent also from the children themselves. 3. Results Over all, 172 children were examined for micronutrient status, specifically iron and vitamin A as shown in Table 2. The mean concentrations of haemoglobin, serum fer- ritin and serum retinol were 12.4 ± 1.1 g/dL; 24.1 ± 11.3 μg/L and 0.9 ± 0.3 μmol/L respectively. The means for the different sexes were 12.5 ± 1.2 g/dL, 24.1 ± 11.6 μg/L, 0.9 ± 0.3 μmol/L; and 12.2 ± 0.9 g/dL, 24.1 ± 11.0 μg/L, 0.8 ± 0.4 μmol/L of haemoglobin, serum ferritin and serum retinol for boys and girls respectively. Anae- mia was moderate (28.5%), low serum ferritin and low serum retinol concentrations were 75.6% and 36.6% re- spectively, indicating a severe situation in the study group (Table 2). In all cases, there was not a significant difference between boys and girls (p < 0.05). However, more than half of all the anaemia (63.3%) was associated with iron deficiency (IDA). Iron deficiency decreased with age among girls, while he reverse was true for boys. Anaemia data were how- t 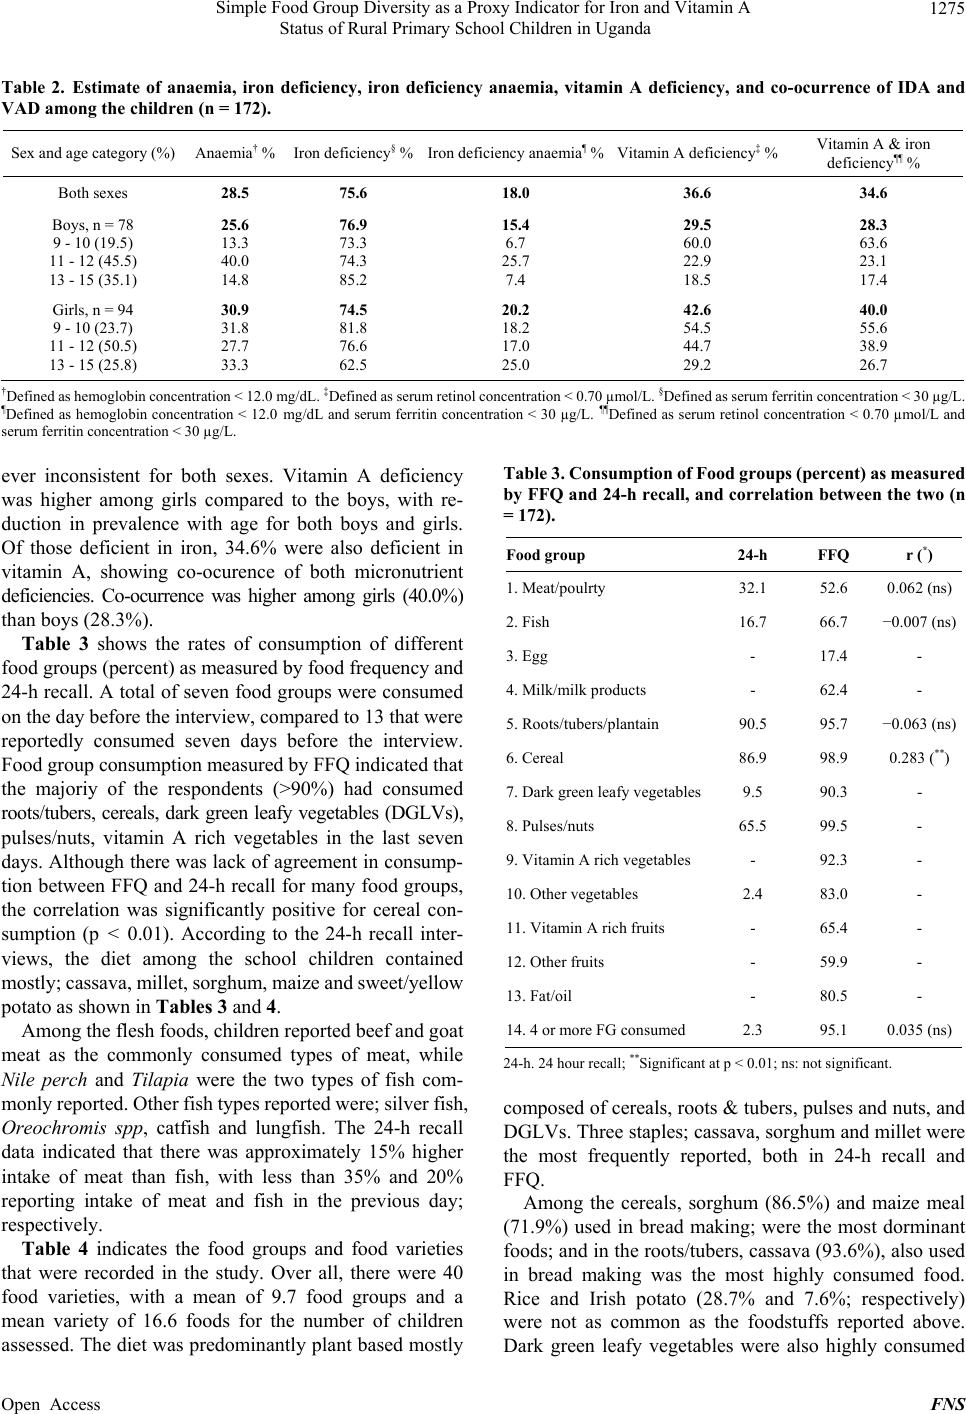 Simple Food Group Diversity as a Proxy Indicator for Iron and Vitamin A Status of Rural Primary School Children in Uganda 1275 Table 2. Estimate of anaemia, iron deficiency, iron deficiency anaemia, vitamin A deficiency, and co-ocurrence of IDA and VAD among the children (n = 172). Sex and age category (%) Anaemia† % Iron deficiency§ %Iron deficiency anaemia¶ %Vitamin A deficiency‡ % Vitamin A & iron deficiency¶¶ % Both sexes 28.5 75.6 18.0 36.6 34.6 Boys, n = 78 9 - 10 (19.5) 11 - 12 (45.5) 13 - 15 (35.1) 25.6 13.3 40.0 14.8 76.9 73.3 74.3 85.2 15.4 6.7 25.7 7.4 29.5 60.0 22.9 18.5 28.3 63.6 23.1 17.4 Girls, n = 94 9 - 10 (23.7) 11 - 12 (50.5) 13 - 15 (25.8) 30.9 31.8 27.7 33.3 74.5 81.8 76.6 62.5 20.2 18.2 17.0 25.0 42.6 54.5 44.7 29.2 40.0 55.6 38.9 26.7 †Defined as hemoglobin concentration < 12.0 mg/dL. ‡Defined as serum retinol concentration < 0.70 µmol/L. §Defined as serum ferritin concentration < 30 µg/L. ¶Defined as hemoglobin concentration < 12.0 mg/dL and serum ferritin concentration < 30 µg/L. ¶¶Defined as serum retinol concentration < 0.70 µmol/L and serum ferritin concentration < 30 µg/L. ever inconsistent for both sexes. Vitamin A deficiency was higher among girls compared to the boys, with re- duction in prevalence with age for both boys and girls. Of those deficient in iron, 34.6% were also deficient in vitamin A, showing co-ocurence of both micronutrient deficiencies. Co-ocurrence was higher among girls (40.0%) than boys (28.3%). Table 3 shows the rates of consumption of different food groups (percent) as measured by food frequency and 24-h recall. A total of seven food groups were consumed on the day before the interview, compared to 13 that were reportedly consumed seven days before the interview. Food group consumption measured by FFQ indicated that the majoriy of the respondents (>90%) had consumed roots/tubers, cereals, dark green leafy vegetables (DGLVs), pulses/nuts, vitamin A rich vegetables in the last seven days. Although there was lack of agreement in consump- tion between FFQ and 24-h recall for many food groups, the correlation was significantly positive for cereal con- sumption (p < 0.01). According to the 24-h recall inter- views, the diet among the school children contained mostly; cassava, millet, sorghum, maize and sweet/yellow potato as shown in Tables 3 and 4. Among the flesh foods, children reported beef and goat meat as the commonly consumed types of meat, while Nile perch and Tilapia were the two types of fish com- monly reported. Other fish types reported were; silver fish, Oreochromis spp, catfish and lungfish. The 24-h recall data indicated that there was approximately 15% higher intake of meat than fish, with less than 35% and 20% reporting intake of meat and fish in the previous day; respectively. Table 4 indicates the food groups and food varieties that were recorded in the study. Over all, there were 40 food varieties, with a mean of 9.7 food groups and a mean variety of 16.6 foods for the number of children assessed. The diet was predominantly plant based mostly Table 3. Con su mp tio n o f F ood gro up s (pe rce nt) as me asu red by FFQ and 24-h recall, and correlation between the two (n = 172). Food group 24-h FFQ r (*) 1. Meat/poulrty 32.1 52.6 0.062 (ns) 2. Fish 16.7 66.7 −0.007 (ns) 3. Egg - 17.4 - 4. Milk/milk products - 62.4 - 5. Roots/tubers/plantain 90.5 95.7 −0.063 (ns) 6. Cereal 86.9 98.9 0.283 (**) 7. Dark green leafy vegetables9.5 90.3 - 8. Pulses/nuts 65.5 99.5 - 9. Vitamin A rich vegetables - 92.3 - 10. Other vegetables 2.4 83.0 - 11. Vitamin A rich fruits - 65.4 - 12. Other fruits - 59.9 - 13. Fat/oil - 80.5 - 14. 4 or more FG consumed 2.3 95.1 0.035 (ns) 24-h. 24 hour recall; **Significant at p < 0.01; ns: not significant. composed of cereals, roots & tubers, pulses and nuts, and DGLVs. Three staples; cassava, sorghum and millet were the most frequently reported, both in 24-h recall and FFQ. Among the cereals, sorghum (86.5%) and maize meal (71.9%) used in bread making; were the most dorminant foods; and in the roots/tubers, cassava (93.6%), also used in bread making was the most highly consumed food. Rice and Irish potato (28.7% and 7.6%; respectively) were not as common as the foodstuffs reported above. Dark green leafy vegetables were also highly consumed Open Access FNS 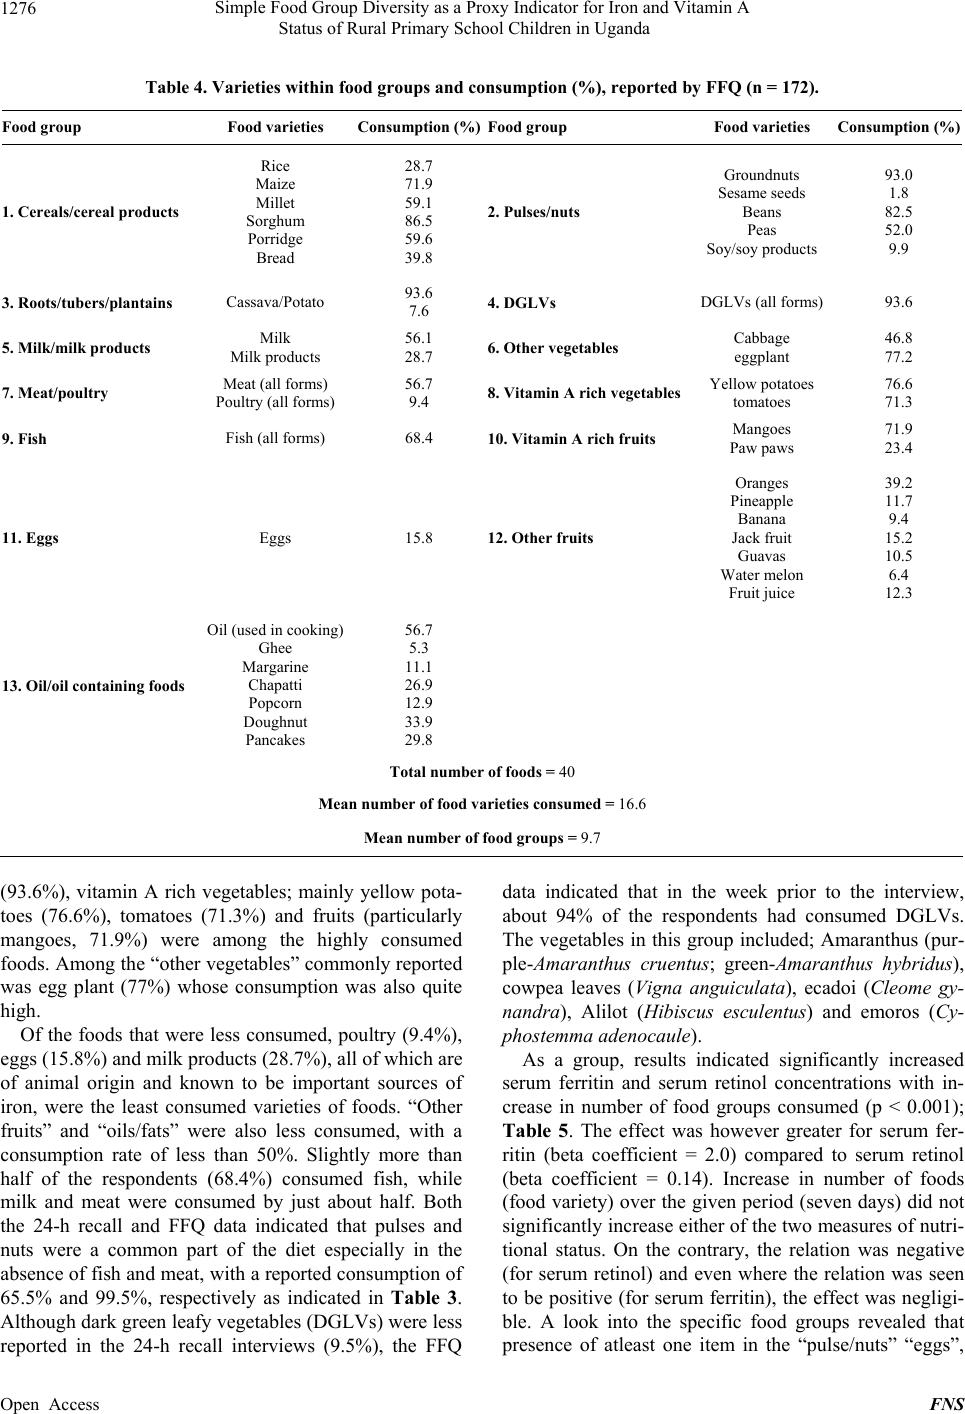 Simple Food Group Diversity as a Proxy Indicator for Iron and Vitamin A Status of Rural Primary School Children in Uganda 1276 Table 4. Varieties within food groups and consumption (%), reported by FFQ (n = 172). Food group Food varieties Consumption (%)Food group Food varieties Consumption (%) 1. Cereals/cereal products Rice Maize Millet Sorghum Porridge Bread 28.7 71.9 59.1 86.5 59.6 39.8 2. Pulses/nuts Groundnuts Sesame seeds Beans Peas Soy/soy products 93.0 1.8 82.5 52.0 9.9 3. Roots/tubers/plantains Cassava/Potato 93.6 7.6 4. DGLVs DGLVs (all forms) 93.6 5. Milk/milk products Milk Milk products 56.1 28.7 6. Other vegetables Cabbage eggplant 46.8 77.2 7. Meat/poultry Meat (all forms) Poultry (all forms) 56.7 9.4 8. Vitamin A rich vegetablesYellow potatoes tomatoes 76.6 71.3 9. Fish Fish (all forms) 68.4 10. Vitamin A rich fruits Mangoes Paw paws 71.9 23.4 11. Eggs Eggs 15.8 12. Other fruits Oranges Pineapple Banana Jack fruit Guavas Water melon Fruit juice 39.2 11.7 9.4 15.2 10.5 6.4 12.3 13. Oil/oil containing foods Oil (used in cooking) Ghee Margarine Chapatti Popcorn Doughnut Pancakes 56.7 5.3 11.1 26.9 12.9 33.9 29.8 Total number of foods = 40 Mean number of food varieties consumed = 16.6 Mean number of food groups = 9.7 (93.6%), vitamin A rich vegetables; mainly yellow pota- toes (76.6%), tomatoes (71.3%) and fruits (particularly mangoes, 71.9%) were among the highly consumed foods. Among the “other vegetables” commonly reported was egg plant (77%) whose consumption was also quite high. Of the foods that were less consumed, poultry (9.4%), eggs (15.8%) and milk products (28.7%), all of which are of animal origin and known to be important sources of iron, were the least consumed varieties of foods. “Other fruits” and “oils/fats” were also less consumed, with a consumption rate of less than 50%. Slightly more than half of the respondents (68.4%) consumed fish, while milk and meat were consumed by just about half. Both the 24-h recall and FFQ data indicated that pulses and nuts were a common part of the diet especially in the absence of fish and meat, with a reported consumption of 65.5% and 99.5%, respectively as indicated in Table 3. Although dark green leafy vegetables (DGLVs) were less reported in the 24-h recall interviews (9.5%), the FFQ data indicated that in the week prior to the interview, about 94% of the respondents had consumed DGLVs. The vegetables in this group included; Amaranthus (pur- ple-Amaranthus cruentus; green-Amaranthus hybridus), cowpea leaves (Vigna anguiculata), ecadoi (Cleome gy- nandra), Alilot (Hibiscus esculentus) and emoros (Cy- phostemm a a d e nocaule). As a group, results indicated significantly increased serum ferritin and serum retinol concentrations with in- crease in number of food groups consumed (p < 0.001); Table 5. The effect was however greater for serum fer- ritin (beta coefficient = 2.0) compared to serum retinol (beta coefficient = 0.14). Increase in number of foods (food variety) over the given period (seven days) did not significantly increase either of the two measures of nutri- tional status. On the contrary, the relation was negative (for serum retinol) and even where the relation was seen to be positive (for serum ferritin), the effect was negligi- ble. A look into the specific food groups revealed that presence of atleast one item in the “pulse/nuts” “eggs”, Open Access FNS 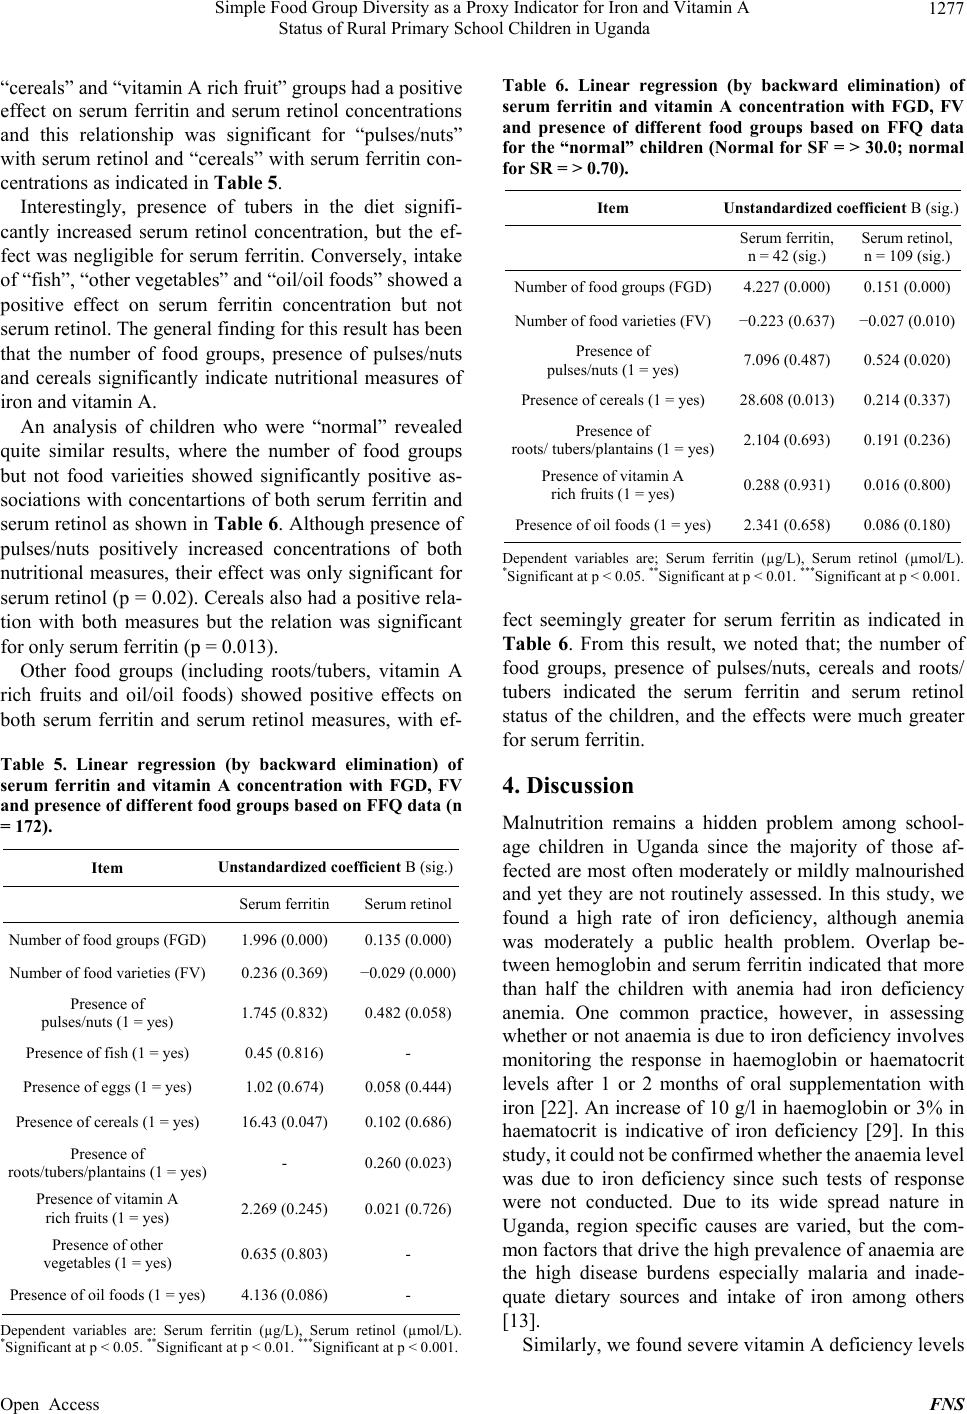 Simple Food Group Diversity as a Proxy Indicator for Iron and Vitamin A Status of Rural Primary School Children in Uganda 1277 “cereals” and “vitamin A rich fruit” groups had a positive effect on serum ferritin and serum retinol concentrations and this relationship was significant for “pulses/nuts” with serum retinol and “cereals” with serum ferritin con- centrations as indicated in Table 5. Interestingly, presence of tubers in the diet signifi- cantly increased serum retinol concentration, but the ef- fect was negligible for serum ferritin. Conversely, intake of “fish”, “other vegetables” and “oil/oil foods” showed a positive effect on serum ferritin concentration but not serum retinol. The general finding for this result has been that the number of food groups, presence of pulses/nuts and cereals significantly indicate nutritional measures of iron and vitamin A. An analysis of children who were “normal” revealed quite similar results, where the number of food groups but not food varieities showed significantly positive as- sociations with concentartions of both serum ferritin and serum retinol as shown in Ta ble 6 . Although presence of pulses/nuts positively increased concentrations of both nutritional measures, their effect was only significant for serum retinol (p = 0.02). Cereals also had a positive rela- tion with both measures but the relation was significant for only serum ferritin (p = 0.013). Other food groups (including roots/tubers, vitamin A rich fruits and oil/oil foods) showed positive effects on both serum ferritin and serum retinol measures, with ef- Table 5. Linear regression (by backward elimination) of serum ferritin and vitamin A concentration with FGD, FV and presence of different food groups based on FFQ data (n = 172). Item Unstandardized coefficient B (sig.) Serum ferritin Serum retinol Number of food groups (FGD) 1.996 (0.000) 0.135 (0.000) Number of food varieties (FV) 0.236 (0.369) −0.029 (0.000) Presence of pulses/nuts (1 = yes) 1.745 (0.832) 0.482 (0.058) Presence of fish (1 = yes) 0.45 (0.816) - Presence of eggs (1 = yes) 1.02 (0.674) 0.058 (0.444) Presence of cereals (1 = yes) 16.43 (0.047) 0.102 (0.686) Presence of roots/tubers/plantains (1 = yes) - 0.260 (0.023) Presence of vitamin A rich fruits (1 = yes) 2.269 (0.245) 0.021 (0.726) Presence of other vegetables (1 = yes) 0.635 (0.803) - Presence of oil foods (1 = yes) 4.136 (0.086) - Dependent variables are: Serum ferritin (µg/L), Serum retinol (µmol/L). *Significant at p < 0.05. **Significant at p < 0.01. ***Significant at p < 0.001. Table 6. Linear regression (by backward elimination) of serum ferritin and vitamin A concentration with FGD, FV and presence of different food groups based on FFQ data for the “normal” children (Normal for SF = > 30.0; normal for SR = > 0.70). Item Unstandardized coefficient B (sig.) Serum ferritin, n = 42 (sig.) Serum retinol, n = 109 (sig.) Number of food groups (FGD)4.227 (0.000) 0.151 (0.000) Number of food varieties (FV)−0.223 (0.637) −0.027 (0.010) Presence of pulses/nuts (1 = yes) 7.096 (0.487) 0.524 (0.020) Presence of cereals (1 = yes) 28.608 (0.013) 0.214 (0.337) Presence of roots/ tubers/plantains (1 = yes)2.104 (0.693) 0.191 (0.236) Presence of vitamin A rich fruits (1 = yes) 0.288 (0.931) 0.016 (0.800) Presence of oil foods (1 = yes)2.341 (0.658) 0.086 (0.180) Dependent variables are; Serum ferritin (µg/L), Serum retinol (µmol/L). *Significant at p < 0.05. **Significant at p < 0.01. ***Significant at p < 0.001. fect seemingly greater for serum ferritin as indicated in Table 6. From this result, we noted that; the number of food groups, presence of pulses/nuts, cereals and roots/ tubers indicated the serum ferritin and serum retinol status of the children, and the effects were much greater for serum ferritin. 4. Discussion Malnutrition remains a hidden problem among school- age children in Uganda since the majority of those af- fected are most often moderately or mildly malnourished and yet they are not routinely assessed. In this study, we found a high rate of iron deficiency, although anemia was moderately a public health problem. Overlap be- tween hemoglobin and serum ferritin indicated that more than half the children with anemia had iron deficiency anemia. One common practice, however, in assessing whether or not anaemia is due to iron deficiency involves monitoring the response in haemoglobin or haematocrit levels after 1 or 2 months of oral supplementation with iron [22]. An increase of 10 g/l in haemoglobin or 3% in haematocrit is indicative of iron deficiency [29]. In this study, it could not be confirmed whether the anaemia level was due to iron deficiency since such tests of response were not conducted. Due to its wide spread nature in Uganda, region specific causes are varied, but the com- mon factors that drive the high prevalence of anaemia are the high disease burdens especially malaria and inade- quate dietary sources and intake of iron among others [13]. Similarly, we found severe vitamin A deficiency levels Open Access FNS 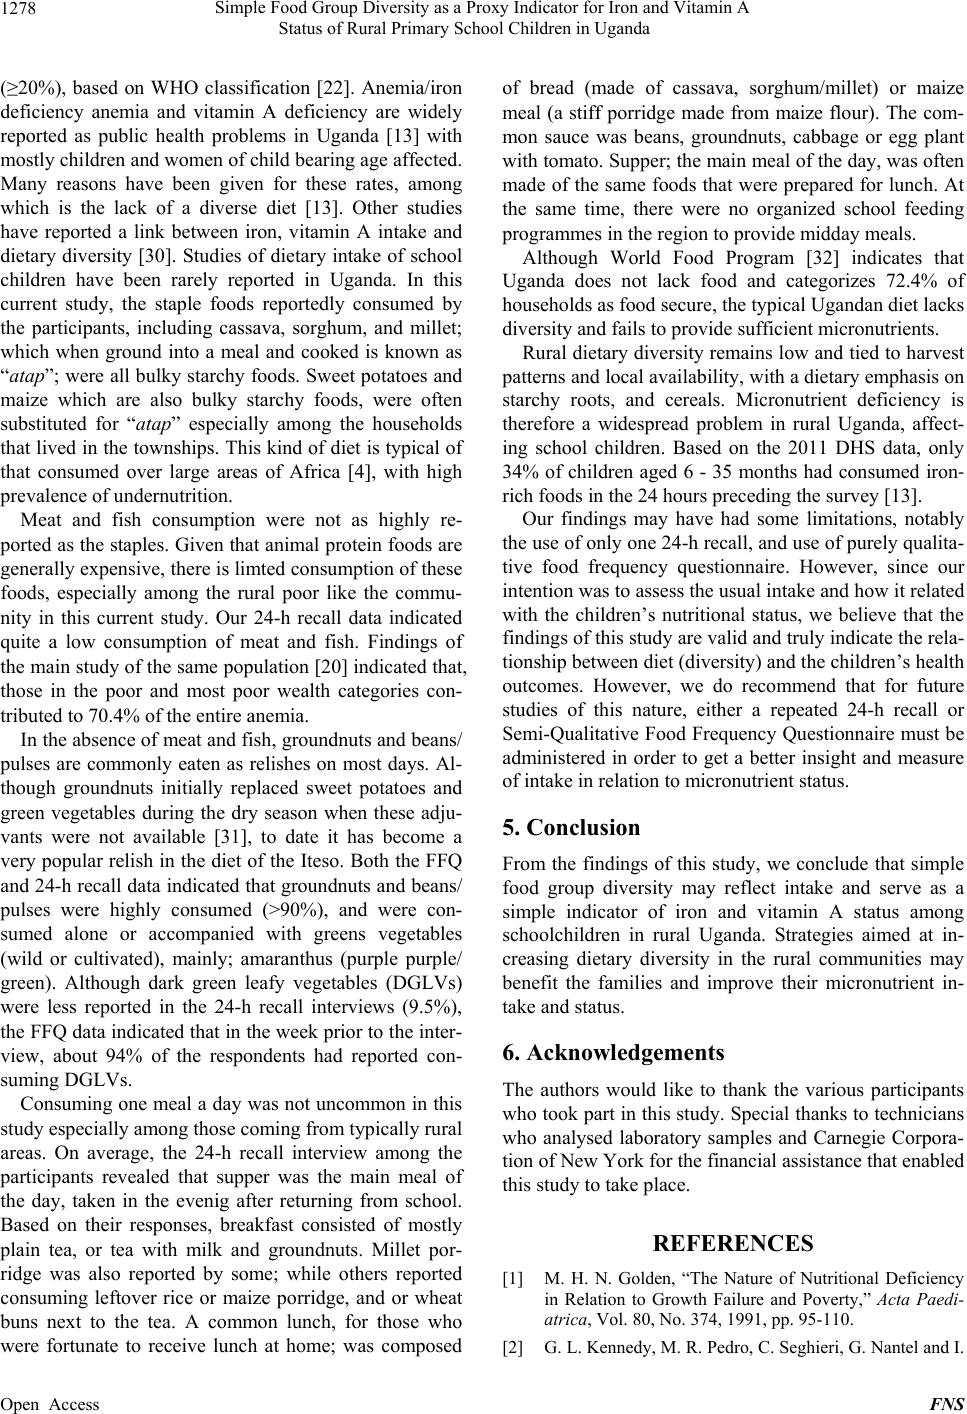 Simple Food Group Diversity as a Proxy Indicator for Iron and Vitamin A Status of Rural Primary School Children in Uganda 1278 (≥20%), based on WHO classification [22]. Anemia/iron deficiency anemia and vitamin A deficiency are widely reported as public health problems in Uganda [13] with mostly children and women of child bearing age affected. Many reasons have been given for these rates, among which is the lack of a diverse diet [13]. Other studies have reported a link between iron, vitamin A intake and dietary diversity [30]. Studies of dietary intake of school children have been rarely reported in Uganda. In this current study, the staple foods reportedly consumed by the participants, including cassava, sorghum, and millet; which when ground into a meal and cooked is known as “atap”; were all bulky starchy foods. Sweet potatoes and maize which are also bulky starchy foods, were often substituted for “atap” especially among the households that lived in the townships. This kind of diet is typical of that consumed over large areas of Africa [4], with high prevalence of undernutrition. Meat and fish consumption were not as highly re- ported as the staples. Given that animal protein foods are generally expensive, there is limted consumption of these foods, especially among the rural poor like the commu- nity in this current study. Our 24-h recall data indicated quite a low consumption of meat and fish. Findings of the main study of the same population [20] indicated that, those in the poor and most poor wealth categories con- tributed to 70.4% of the entire anemia. In the absence of meat and fish, groundnuts and beans/ pulses are commonly eaten as relishes on most days. Al- though groundnuts initially replaced sweet potatoes and green vegetables during the dry season when these adju- vants were not available [31], to date it has become a very popular relish in the diet of the Iteso. Both the FFQ and 24-h recall data indicated that groundnuts and beans/ pulses were highly consumed (>90%), and were con- sumed alone or accompanied with greens vegetables (wild or cultivated), mainly; amaranthus (purple purple/ green). Although dark green leafy vegetables (DGLVs) were less reported in the 24-h recall interviews (9.5%), the FFQ data indicated that in the week prior to the inter- view, about 94% of the respondents had reported con- suming DGLVs. Consuming one meal a day was not uncommon in this study especially among those coming from typically rural areas. On average, the 24-h recall interview among the participants revealed that supper was the main meal of the day, taken in the evenig after returning from school. Based on their responses, breakfast consisted of mostly plain tea, or tea with milk and groundnuts. Millet por- ridge was also reported by some; while others reported consuming leftover rice or maize porridge, and or wheat buns next to the tea. A common lunch, for those who were fortunate to receive lunch at home; was composed of bread (made of cassava, sorghum/millet) or maize meal (a stiff porridge made from maize flour). The com- mon sauce was beans, groundnuts, cabbage or egg plant with tomato. Supper; the main meal of the day, was often made of the same foods that were prepared for lunch. At the same time, there were no organized school feeding programmes in the region to provide midday meals. Although World Food Program [32] indicates that Uganda does not lack food and categorizes 72.4% of households as food secure, the typical Ugandan diet lacks diversity and fails to provide sufficient micronutrients. Rural dietary diversity remains low and tied to harvest patterns and local availability, with a dietary emphasis on starchy roots, and cereals. Micronutrient deficiency is therefore a widespread problem in rural Uganda, affect- ing school children. Based on the 2011 DHS data, only 34% of children aged 6 -35 months had consumed iron‐ rich foods in the 24 hours preceding the survey [13]. Our findings may have had some limitations, notably the use of only one 24-h recall, and use of purely qualita- tive food frequency questionnaire. However, since our intention was to assess the usual intake and how it related with the children’s nutritional status, we believe that the findings of this study are valid and truly indicate the rela- tionship between diet (diversity) and the children’s health outcomes. However, we do recommend that for future studies of this nature, either a repeated 24-h recall or Semi-Qualitative Food Frequency Questionnaire must be administered in order to get a better insight and measure of intake in relation to micronutrient status. 5. Conclusion From the findings of this study, we conclude that simple food group diversity may reflect intake and serve as a simple indicator of iron and vitamin A status among schoolchildren in rural Uganda. Strategies aimed at in- creasing dietary diversity in the rural communities may benefit the families and improve their micronutrient in- take and status. 6. Acknowledgements The authors would like to thank the various participants who took part in this study. Special thanks to technicians who analysed laboratory samples and Carnegie Corpora- tion of New York for the financial assistance that enabled this study to take place. REFERENCES [1] M. H. N. Golden, “The Nature of Nutritional Deficiency in Relation to Growth Failure and Poverty,” Acta Paedi- atrica, Vol. 80, No. 374, 1991, pp. 95-110. [2] G. L. Kennedy, M. R. Pedro, C. Seghieri, G. Nantel and I. Open Access FNS  Simple Food Group Diversity as a Proxy Indicator for Iron and Vitamin A Status of Rural Primary School Children in Uganda 1279 Brouwer, “Dietary Diversity Score Is a Useful Indicator of Micronutrient Intake in Non-Breast-Feeding Filipino Children,” Journal of Nutrition, Vol. 137, No. 2, 2007, pp. 472-477. [3] A. Onyango, K. G Koski and G. Tucker, “Food Diversity versus Breastfeeding Choice in Determining Anthropom- etric Status in Rural Kenyan Toddlers,” International Journal of Epidemiology, Vol. 27, No. 3, 1998, pp. 484- 448. http://dx.doi.org/10.1093/ije/27.3.484 [4] A. W. Onyango, “Dietary Diversity, Child Nutrition and Health in Contemporary African Communities,” Com- parative Biochemistry and Physiology Part A: Molecular & Integrative Physiology, Vol. 136, No. 1, 2003, pp. 61- 69. http://dx.doi.org/10.1016/S1095-6433(03)00071-0 [5] A. Tarini, S. Bakari and H. Delisle, “The Overall Nutri- tional Quality of the Diet Is Reflected in the Growth of Nigerian Children,” Santé (Montrouge, France), Vol. 9, No. 1, 1999, p. 23. [6] A. Hailu and T. Tessema, “Anthropomentric Study of Ethiopians Pre-School Children,” Ethiopian Medical Jour- nal, Vol. 35, No. 4, 1997, pp. 235-244. [7] M. Faber, V. B. Jogessar and A. J. S. Benadé, “Nutri- tional Status and Dietary Intakes of Children Aged 2 - 5 Years and Their Caregivers in a Rural South African Community,” International Journal of Food Sciences and Nutrition, Vol. 52, No. 5, 2001, pp. 401-411. http://dx.doi.org/10.1080/09637480120078285 [8] M. Faber, “Dietary Intake of Primary School Children in Relation to Food Production in a Rural Area in KwaZulu- Natal, South Africa,” International Journal of Food Sci- ences and Nutrition, Vol. 50, No. 1, 1999, pp. 57-64. http://dx.doi.org/10.1080/096374899101427 [9] L. E. Torheim, E. L. Ferguson, K. Penrose and M. Ario- mond, “Women in Resource-Poor Settings Are at Risk of Inadequate Intakes of Multiple Micronutrients,” Journal of Nutrition, Vol. 140, No. 11, 2010, pp. 2051S-2058S. http://dx.doi.org/10.3945/jn.110.123463 [10] J. E. Arsenault, E. A. Yakes, M. M. Islam, M. B. Hossain, T. Ahmed, C. Hotz, B. Lewis, A. S. Rahman, K. M. Jamil and K. H. Brown, “Very Low Adequacy of Micronutrient Intakes by Young Children and Women in Rural Bangla- desh Is Primarily Explained by Low Food Intake and Limited Diversity,” The Journal of Nutrition, Vol. 143, No. 2, 2013, pp. 197-203. http://dx.doi.org/10.3945/jn.112.169524 [11] J. K. Kikafunda, A. F. Walker, D. Collett and J. K. Tum- wine, “Risk Factors for Early Childhood Malnutrition in Uganda,” Pediatrics, Vol. 102, No. 4, 1998, p. e45. http://dx.doi.org/10.1542/peds.102.4.e45 [12] G. Kennedy, A. Berardo, C. Papavero, P. Horjus, T. Bal- lard, M. C. Dop, J. Delbaere and I. D. Brouwer, “Proxy Measures of Household Food Consumption for Food Se- curity Assessment and Surveillance: Comparison of the Household Dietary Diversity and Food Consumption Scores,” Public Health Nutrition, Vol. 13 No. 12, 2010, pp. 2010-2018. http://dx.doi.org/10.1017/S136898001000145X [13] UBOS, “Uganda Demographic and Health Survey (UDHS) Report,” Uganda Bureau of Statistics and Macro International, Inc., Calverton, 2011. [14] F. M. Turyashemererwa, J. Kikafunda, R. Annan and G. A. Tumuhimbise, “Dietary Patterns, Anthropometric Sta- tus, Prevalence and Risk Factors for Anaemia among School Children Aged 5 - 11 Years in Central Uganda,” Journal of Human Nutrition and Dietetics, Vol. 26, No. 1, 2013, pp. 73-81. http://dx.doi.org/10.1111/jhn.12069 [15] V. M. Aguayo and S. K. Baker, “Vitamin A Deficiency and Child Survival in Sub-Saharan Africa: A Reappraisal of Challenges and Opportunities,” Food and Nutrition Bulletin, Vol. 26, No. 4, 2005, pp. 348-355. [16] M. Nishimura, T. Yamano and Y. Sasaoka, “Impacts of the Universal Primary Education Policy on Educational Attainment and Private Costs in Rural Uganda,” Interna- tional Journal of Educational Development, Vol. 28, No. 2, 2008, pp. 161-175. http://dx.doi.org/10.1016/j.ijedudev.2006.09.017 [17] A. M. Prentice, K. A Ward, G. R. Goldberg, L. M. Jarjou, S. E. Moore, A. J. Fulford and A. Prentice, “Critical Win- dows for Nutritional Interventions against Stunting,” American Journal of Clinical Nutrition, Vol. 97, No. 5, 2013, pp. 911-918. http://dx.doi.org/10.3945/ajcn.112.052332 [18] Kumi District State of the Environment Report, Kumi District local Government, 2008. http://nema-ug.org/district_reports/kumi_dsoer_2008.pdf [19] LAKIMO, “Lake Kyoga Management Plan 2004-2007,” Lake Kyoga Integrated Management Organisation, Ugan- da, 2004. [20] H. Acham, “Nutrition, Health and Academic Achieve- ment of Primary School Children: A Case of Kumi Dis- trict Eastern Uganda,” Makarere University, Kampala, 2010. [21] H. Acham, J. K. Kikafunda, T. Tylleskar and M. K. Malde, “Nutritional and Health Status of Primary School- children in Rural Uganda,” African Journal of Agricul- ture Nutrition and Development, Vol. 12, No. 2, 2012, pp. 5862-5880 [22] WHO/UNICEF/UNU, “Iron Deficiency Anaemia Assess- ment, Prevention, and Control: A Guide for Programme Managers,” Geneva, 2001. [23] G. M. Addison, M. R. Beamish, C. N. Hales, M. Hodg- kins, A. Jacobs and P. Lewellin, “An Immunoradiometric Assay for Ferritin in the Serum of Normal Subjects and Patients with Iron Deficiency and Iron Overload,” Jour- nal of Clinical Patholology, Vol. 25, No. 4, 1972, pp. 326-329. [24] J. G. Bieri, T. J. Tolliver and G. L. Catignani, “Simulta- neous Determination of Alpha Tocopherol and Retinol in Plasma or Red Cells by High Pressure Liquid Chroma- tography,” American Journal of Clinical Nutrition, Vol. 32, No. 4, 1979, p. 2143. [25] WHO, “Indicators of Vitamin A Deficiency and Their Application in Monitoring and Evaluating Intervention Programmes,” WHO/NUT/96.10, World Health Organi- zation, Geneva, 1996. Open Access FNS  Simple Food Group Diversity as a Proxy Indicator for Iron and Vitamin A Status of Rural Primary School Children in Uganda Open Access FNS 1280 [26] J. Coates, B. Colaiezzi, J. Fiedler, J. Wirth, K. Lividini and B. Rogers, “Applying Dietary Assessment Methods for Food Fortification and Other Nutrition Programs,” Global Alliance for Improved Nutrition (GAIN), Geneva, 2012. [27] R. Gibson, “Principles of Nutrition Assessment,” Oxford University Press, New York, 1990. [28] I. Tidemann-Andersen, H. Acham, A. Maage and M. K. Malde, “Iron and Zinc Content of Selected Foods in the Diet of Schoolchildren in Kumi District, East of Uganda: A Cross-Sectional Study,” Nutrition Journal, Vol. 10, No. 81, 2011. [29] WHO/CDC, “Assessing the Iron Status of Populations,” Report of a Joint World Health Organization/Centres for Disease Control and Prevention Technical Consultation on the Assessment of Iron Status at the Population Level, Geneva, 2005. [30] A. W. Onyango, O. Receveur and S. A Esrey, “The Con- tribution of Breast Milk to Toddler Diets in Western Kenya,” Bulletin of the World Health Organization, Vol. 80, No. 4, 2002, pp. 292-299. [31] M. G. Courcy, H. R. Hosking and L. J. A Loewenthal, “An Investigation into Health and Agriculture in Teso, Uganda,” Nutrition Report No. 1, Teso, Government Printer, Entebbe, 1937. [32] WFP, “Comprehensive Food Security & Vulnerability Analysis (CFSVA),” World Food Programme, Uganda Country Office, 2009.
|