 Vol.1, No.4, 132-141 (2013) Advances in Enzyme Research http://dx.doi.org/10.4236/aer.2013.14014 Escherichia coli superoxide dismutase expression does not change in response to iron challenge during lag phase: Is the ferric uptake regulator to blame? Robert L. Bertrand*, Michael O. Eze# Health Enhancement Biochemistry Laboratory, Department of Chemistry, University of Winnipeg, Winnipeg, Canada; #Corresponding Author: m.eze@uwinnipeg.ca Received 19 July 2013; revised 23 August 2013; accepted 10 September 2013 Copyright © 2013 Robert L. Bertrand, Michael O. Eze. This is an open access article distributed under the Creative Commons Attri- bution License, which permits unrestricted use, distribution, and reproduction in any medium, provided the original work is properly cited. ABSTRACT Intracellular iron levels and the expression of superoxide dismutase (SOD) and hydroperoxi- dase (HP) are regulated in Gram-negative bacte- ria by the iron(II)-activated ferric uptake regula- tor (Fur). We have previously observed that the expression of SOD in exponential phase Es- cherichia coli is dependent upon the redox state of iron in media, consistent with the ferrous specificity of Fur regulation (Bertrand et al., Med. Hypotheses 78: 130 - 133, 2012). Through the non-denaturing electrophoretic technique we have determined the Escherichia coli expression profiles of SOD and HP in response to iron challenge throughout lag, logarithmic, and sta- tionary phases of replication. Lag phase SOD presented an unusual expression profile such that SOD expression was unresponsive to iron challenge, analogous to observations of mutant strains lacking Fur and of E. coli incubated in iron-deplete media. Challenging Escherichia coli with iron during logarithmic phase revealed that length of exposure to oxidants is unlikely to be the cause of SOD unresponsiveness in lag phase. HP activity was up-regulated two- or three-fold throughout all growth phases in re- sponse to iron challenge, but did not present redox- or growth phase-specific outcomes in a manner analogous to SOD. We hypothesize that low Fur levels during lag phase are responsible for unresponsive SOD. Keywords: Antioxidant Enzymes; Oxidative Stress; Iron Metabolism; Enzyme Expression 1. INTRODUCTION Iron is an essential metal, required as a prosthetic group for many metallo-proteins. However, iron potenti- ates oxidative stress through the catalytic formation of hydroxyl radicals from hydrogen peroxide through the Fenton reaction [1] (Eq.1): 23 22 FeH OFeOHOH (1) Reactive oxygen species such as hydroxyl radical (OH·), superoxide . 2 O , and hydrogen peroxide (H2O2) have been implicated in numerous pathologies as well as the process of aging [2-8]. Cells must therefore carefully regulate intracellular iron levels to meet metabolic needs yet mitigate iron cytotoxicity [9-12]. In Gram-negative bacteria such as Escherichia coli, this balance is medi- ated by the ferric uptake regulator (Fur), an iron (II)- dependent suppressor of iron uptake proteins [13-15]. As Fur also regulates superoxide dismutase (SOD) and hy- droperoxidase (HP) [16-23], two essential antioxidant enzymes for respiring bacteria [24,25], Fur is de facto a homeostatic mediator of intracellular oxidative conditions. SOD isozymes are distinguished and named by their metal prosthetic groups. Escherichia coli, the model spe- cies of this study, copiously produces manganese- and iron-bearing forms (MnSOD, FeSOD), as well as a trace isozyme known as CuZnSOD [26,27]. These are encoded by the genes sodA, sodB, and sodC, respectively. Unlike FeSOD, MnSOD expression levels vary greatly in re- sponse to a variety of oxidative stimuli [28,29]. MnSOD expression is regulated by the protein products of six global regulators: soxRS and soxQ, both of which acti- vate sodA; and fur, arcA, fnr, and ihf, all of which sup- *Present Address: Department of Chemistry, University of Mani- toba, Winnipeg, Canada. Copyright © 2013 SciRes. OPEN A CCESS 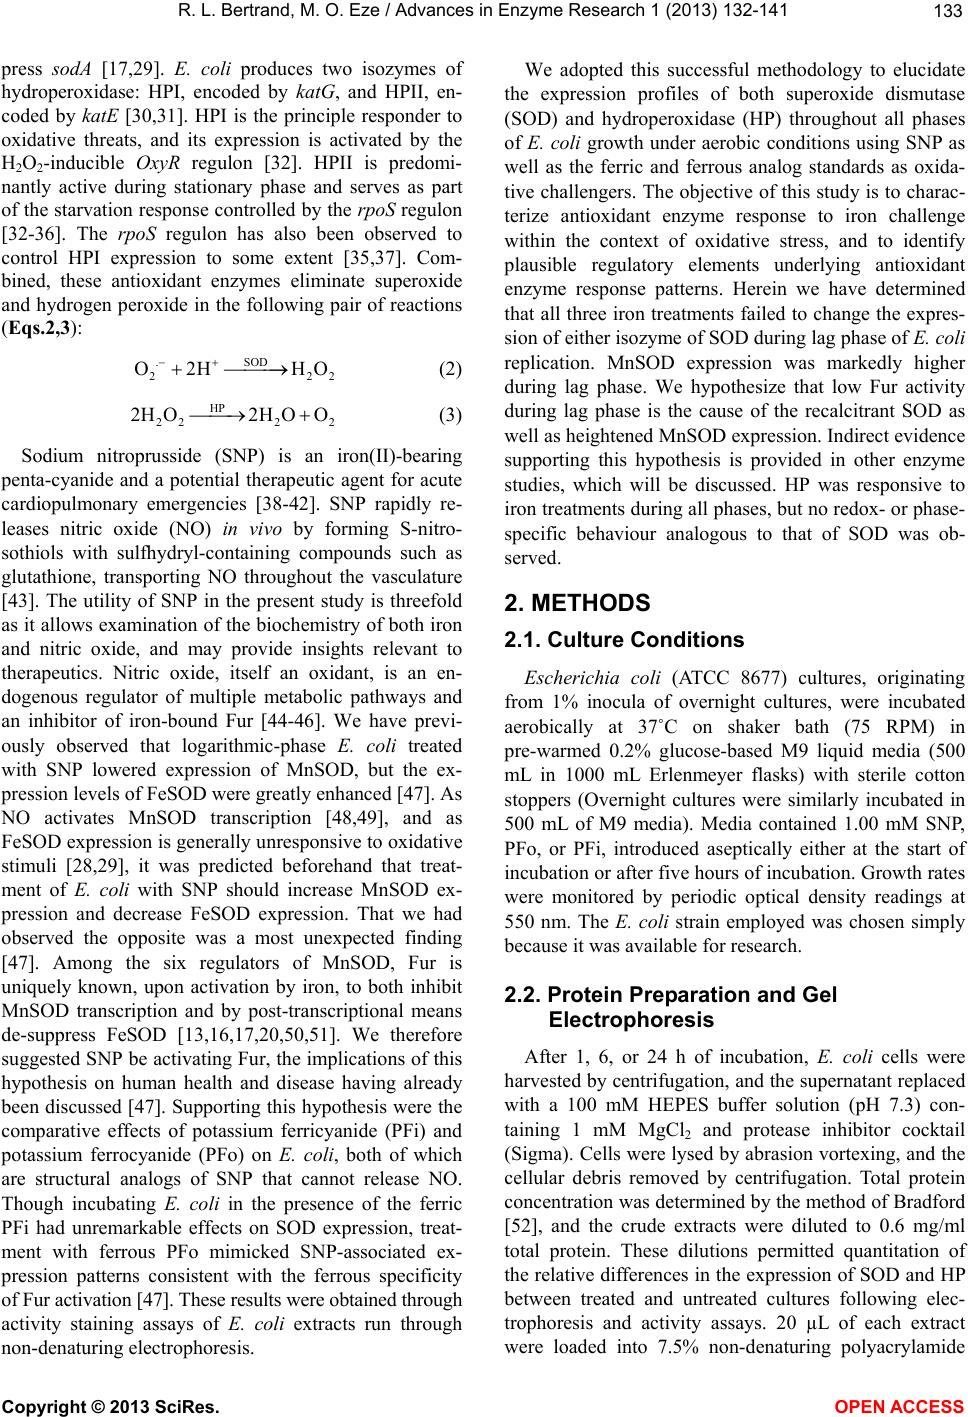 R. L. Bertrand, M. O. Eze / Advances in Enzyme Research 1 (2013) 132-141 133 press sodA [17,29]. E. coli produces two isozymes of hydroperoxidase: HPI, encoded by ka tG, and HPII, en- coded by katE [30,31]. HPI is the principle responder to oxidative threats, and its expression is activated by the H2O2-inducible OxyR regulon [32]. HPII is predomi- nantly active during stationary phase and serves as part of the starvation response controlled by the rpoS regulon [32-36]. The rpoS regulon has also been observed to control HPI expression to some extent [35,37]. Com- bined, these antioxidant enzymes eliminate superoxide and hydrogen peroxide in the following pair of reactions (Eqs.2,3): SOD . 2 O2H HO 2 2 (2) HP 222 2 2H O2H OO (3) Sodium nitroprusside (SNP) is an iron(II)-bearing penta-cyanide and a potential therapeutic agent for acute cardiopulmonary emergencies [38-42]. SNP rapidly re- leases nitric oxide (NO) in vivo by forming S-nitro- sothiols with sulfhydryl-containing compounds such as glutathione, transporting NO throughout the vasculature [43]. The utility of SNP in the present study is threefold as it allows examination of the biochemistry of both iron and nitric oxide, and may provide insights relevant to therapeutics. Nitric oxide, itself an oxidant, is an en- dogenous regulator of multiple metabolic pathways and an inhibitor of iron-bound Fur [44-46]. We have previ- ously observed that logarithmic-phase E. coli treated with SNP lowered expression of MnSOD, but the ex- pression levels of FeSOD were greatly enhanced [47]. As NO activates MnSOD transcription [48,49], and as FeSOD expression is generally unresponsive to oxidative stimuli [28,29], it was predicted beforehand that treat- ment of E. coli with SNP should increase MnSOD ex- pression and decrease FeSOD expression. That we had observed the opposite was a most unexpected finding [47]. Among the six regulators of MnSOD, Fur is uniquely known, upon activation by iron, to both inhibit MnSOD transcription and by post-transcriptional means de-suppress FeSOD [13,16,17,20,50,51]. We therefore suggested SNP be activating Fur, the implications of this hypothesis on human health and disease having already been discussed [47]. Supporting this hypothesis were the comparative effects of potassium ferricyanide (PFi) and potassium ferrocyanide (PFo) on E. coli, both of which are structural analogs of SNP that cannot release NO. Though incubating E. coli in the presence of the ferric PFi had unremarkable effects on SOD expression, treat- ment with ferrous PFo mimicked SNP-associated ex- pression patterns consistent with the ferrous specificity of Fur activation [47]. These results were obtained through activity staining assays of E. coli extracts run through non-denaturing electrophoresis. We adopted this successful methodology to elucidate the expression profiles of both superoxide dismutase (SOD) and hydroperoxidase (HP) throughout all phases of E. coli growth under aerobic conditions using SNP as well as the ferric and ferrous analog standards as oxida- tive challengers. The objective of this study is to charac- terize antioxidant enzyme response to iron challenge within the context of oxidative stress, and to identify plausible regulatory elements underlying antioxidant enzyme response patterns. Herein we have determined that all three iron treatments failed to change the expres- sion of either isozyme of SOD during lag phase of E. co li replication. MnSOD expression was markedly higher during lag phase. We hypothesize that low Fur activity during lag phase is the cause of the recalcitrant SOD as well as heightened MnSOD expression. Indirect evidence supporting this hypothesis is provided in other enzyme studies, which will be discussed. HP was responsive to iron treatments during all phases, but no redox- or phase- specific behaviour analogous to that of SOD was ob- served. 2. METHODS 2.1. Culture Conditions Escherichia coli (ATCC 8677) cultures, originating from 1% inocula of overnight cultures, were incubated aerobically at 37˚C on shaker bath (75 RPM) in pre-warmed 0.2% glucose-based M9 liquid media (500 mL in 1000 mL Erlenmeyer flasks) with sterile cotton stoppers (Overnight cultures were similarly incubated in 500 mL of M9 media). Media contained 1.00 mM SNP, PFo, or PFi, introduced aseptically either at the start of incubation or after five hours of incubation. Growth rates were monitored by periodic optical density readings at 550 nm. The E. coli strain employed was chosen simply because it was available for research. 2.2. Protein Preparation and Gel Electrophoresis After 1, 6, or 24 h of incubation, E. coli cells were harvested by centrifugation, and the supernatant replaced with a 100 mM HEPES buffer solution (pH 7.3) con- taining 1 mM MgCl2 and protease inhibitor cocktail (Sigma). Cells were lysed by abrasion vortexing, and the cellular debris removed by centrifugation. Total protein concentration was determined by the method of Bradford [52], and the crude extracts were diluted to 0.6 mg/ml total protein. These dilutions permitted quantitation of the relative differences in the expression of SOD and HP between treated and untreated cultures following elec- trophoresis and activity assays. 20 µL of each extract were loaded into 7.5% non-denaturing polyacrylamide Copyright © 2013 SciRes. OPEN A CCESS  R. L. Bertrand, M. O. Eze / Advances in Enzyme Research 1 (2013) 132-141 134 gels (29:1), and electrophoresed at 200 V and 0.03 A for approximately two hours using a TRIS-glycine running buffer. At least three experiments were conducted per treatment and growth phase. 2.3. Enzyme Activity Assays SOD activity was determined by the method of Beauchamp and Fridovich [53], with modifications as described by Britigan and colleagues [54]: A 50 mM phosphate buffer solution (pH 7.8) containing 0.25 mM nitroblue tetrazolium (NBT), 1 mM ethylenediamine- tetraacetate (EDTA), 28 mM tetramethylethylenediamine (TEMED), and 0.03 mM riboflavin was applied to gels in darkness for 45 minutes, stirring occasionally, fol- lowed by destaining in darkness with phosphate buffer for 45 minutes. Achromatic bands appear on a blue-pur- ple background upon exposure to light. HP activity was assayed by the method of Woodbury and colleagues [55]: Gels were immersed in a 0.003% (w/v) H2O2 solution for ten minutes, followed by rinsing and addition of a freshly-prepared solution of 2% (w/v) potassium ferri- cyanide and 2% (w/v) ferric chloride for five minutes. Achromatic bands appear on a dark green background. Band intensities were quantified with a band analyzer (Vakili Gel Analysis Unit, Dept. of Chem., U. of Winni- peg). 2.4. Enzyme Activity Ratios To determine how much SOD isozyme concentrations changed in E. coli in response to treatment, enzyme ac- tivity ratios were generated by dividing the determined isozyme concentration in treated samples by the concen- tration in the corresponding untreated standard. For ex- ample, if MnSOD from SNP-treated E. coli during ex- ponential phase was half as concentrated as MnSOD from untreated E. coli during the same phase, an enzyme activity ratio of 0.50 would be reported. Isozyme con- centrations are the average determination of a minimum of three independent experiments. Data from unpub- lished work was included in the data sets (when appro- priate) to provide as many as 10 independent experi- ments in some instances. The average was five experi- ments. Data points exceeding the lower and upper quar- tiles by 1.5 times were removed as outliers. The enzyme concentrations were approximated by comparing band intensity values between sample bands and that of a known quantity of a standard enzyme loaded into gels. These standard enzymes were 10 ng of Corynebacterium glutamicum catalase (Fluka) and 50 ng of E. coli man- ganese SOD (Sigma). Ratio significance was determined through Student’s T-test and pooled standard deviation at 90 and 95 percent confidence. 3. RESULTS 3.1. E. coli Growth Curves Untreated E. coli remained in lag phase for approxi- mately two hours, following which cultures progressed into an exponential phase that ended after eight addi- tional hours of incubation (Figure 1). 1.00 mM SNP was observed to uniquely hinder E. coli replication, evident by mid-exponential phase, resulting in a lower optical density at stationary plateau as compared to all other treatments (Figure 1). These results suggest that SNP imparts a severe oxidative and/or metabolic threat to E. coli. 3.2. E. coli Growth Curves E. coli cells were incubated in the presence of 1.00 mM SNP, PFo, or PFi, and harvested after 1, 6, or 24 hours of incubation in accordance with the middle of its determined lag, exponential, and stationary periods (Figure 1). SOD assays of electrophoresed extracts and SOD activity ratios are provided (Figure 2; Table 1). Unlike exponential and stationary-phase harvests (Fig- ures 2(b) and (c)), no treatment was capable of changing SOD isoyzme activities during lag phase, as the activity ratio was approximately 1 and did not deviate signifi- cantly from the untreated standard (Table 1). There are at least two possible reasons why this occurred. It is possible that: 1) induction of SOD is time-de- pendent, and one hour is not enough time to observe an- tioxidant adaptation to oxidative challenge; or that 2) there are underlying regulatory reasons why iron chal- lenge is unable to change SOD activities during lag Figure 1. Growth curves of E. coli treated with 1.00 mM sodium nitroprusside (SNP), 1.00 mM potassium ferrocyanide (PFo), or 1.00 mM potassium ferricyanide (PFi), in- cubated as described (see “Methods”). Growth curve is representative of at least three independent trials. Copyright © 2013 SciRes. OPEN A CCESS  R. L. Bertrand, M. O. Eze / Advances in Enzyme Research 1 (2013) 132-141 135 Figure 2. E. coli SOD expression profiles, presented as activity bands on non-denaturing polyacrylamide gels. E. coli originat- ing from overnight cultures were incubated as described (see “Methods”) in the presence of 1.00 mM sodium nitroprusside (SNP), 1.00 mM potassium ferrocyanide (PFo), or 1.00 mM potassium ferricyanide (PFi), then harvested after 1, 6, or 24 h of incubation (a-c). “6 h (mod)” are E. coli harvested after 6 h of incubation, but only received 1 h of treatment (addition at 5 h) (d). 20 µL of 0.6 mg/ml crude protein extract were loaded into each well, and electrophoresed and stained for SOD activ- ity as described (see “Methods”). “Std E.” is 50 ng of E. coli MnSOD, used as a positive standard. “No Tx” is untreated E. coli, equivalently harvested. Under present conditions, E. coli MnSOD is electrophoretically slowest (top band) and FeSOD fastest (bottom band) [71,72]. As the staining technique is light-activated, and gel backgrounds darken with more light exposure, variations in gel background colour from trial to trial will inevitably arise. Gels are representative of at least three independent trials. phase. To investigate, liquid broths of E. coli were equivalently incubated without treatment for five hours, following which 1.00 mM (final concentration) of SNP, PFo, or PFi was added to each broth. These cultures were incubated for 1 h more, and then harvested. If SOD is unresponsive to iron challenge because 1 h of incubation is not enough time for E. coli to change SOD expression levels, then SOD should remain similarly unchanged when E. coli cells are exposed to the same iron challenge for 1 h during exponential phase. If, however, SOD is unresponsive to iron challenge because of underlying regulatory reasons determining SOD activity during lag phase, then 1 h exposure to iron challenge during expo- nential phase should result in a different expression pro- file than that observed in lag phase. Such “modified” ex- ponential phase trials would likely be similar to other exponential phase trials with 6 h of exposure to treat- ments. This predicted outcome was indeed observed, albeit with some statistical caution (Figure 2(d)). SNP and PFo Table 1. Activity ratios of E. coli SOD isozymes throughout all growth phases under treatment of 1.00 mM SNP, PFo, or PFi. MnSOD FeSOD Growth Phase Treatment Ratio SD RatioSD Lag phase (1 h) SNP PFo PFi 1.07 ± 0.98 0.80 ± 0.52 0.81 ± 0.43 0.92 ± 0.55 1.20 ± 0.49 1.04 ± 0.50 Exponential phase (6 h) SNP PFo PFi 0.76 ± 0.64 0.50 ± 0.43* 0.80 ± 0.60 3.16 ± 3.15** 1.51 ± 1.75 0.60 ± 0.72 Stationary phase (24 h) SNP PFo PFi 1.59 ± 1.94 0.55 ± 0.52** 0.48 ± 0.48* 2.63 ± 1.05* 1.93 ± 1.01 1.39 ± 0.65 “Modified” Exponential phase (6 h) SNP PFo PFi 0.66 ± 0.58 0.56 ± 0.51 0.96 ± 0.87 2.58 ± 2.02** 1.61 ± 1.21 1.01 ± 0.73 “Ratio” is defined as the average SOD isozyme concentration of the treated E. coli divided by the average SOD isozyme concentration of untreated E. coli under identical conditions. Significance at 90 (*) and 95 (**) percent confidence was determined through Student’s T-test and pooled standard deviation. both reduced MnSOD activity by about one-third as compared to untreated E. coli, but were only significant at P ≤ 0.36 and P ≤ 0.25, respectively, suggesting there is an approximate one third to one quarter chance that de- viation was caused by random error alone. PFi failed to change MnSOD, with an approximate 94 percent chance of variance being due to random error. FeSOD expres- sion was heightened by SNP and PFo treatment 2.58 and 1.61 fold, respectively, but only SNP treatment reached statistical reliability at P ≤ 0.05 (Table 1). We therefore conclude that the hypothesis that there are underlying regulatory reasons distinct to lag phase causing SOD unresponsiveness is more likely correct. It is remarkable that PFi was also capable of decreasing MnSOD activity alongside PFo during stationary phase (Table 1). It is plausible that this may be caused by redox shifts in media, changes in intracellular iron import and export rates, changes in iron solubility influencing Fur activation, or other causes. Strangely, SNP induced a 50 percent increase in MnSOD activity at this time; however, deviation is likely due to random error as statistical analysis shows an approximate 90 percent chance of be- ing caused by random error. Extracts of untreated E. coli harvested from all three growth phases were electrophoresed and stained for SOD activity. MnSOD was found to display remarkably higher activity during lag phase (Figure 3). In summary, SOD assays show markedly higher MnSOD expression during lag phase. This heightened expression is immutable to iron treatment, and SOD recalcitrance does not seem to Copyright © 2013 SciRes. OPEN A CCESS  R. L. Bertrand, M. O. Eze / Advances in Enzyme Research 1 (2013) 132-141 136 be caused merely by inadequate time exposure to iron challengers. 3.3. Hydroperoxidase The expression profiles of HP isozymes from E. coli treated with SNP, PFi, and PFo were determined in the same manner as that of SOD. Activity ratios for HP isozymes are provided (Ta b l e 2 ). E. coli exposed to any treatment responded with heightened HP activity during all phases of replication, albeit with varying levels of statistical certainty per treatment and growth phase (Figure 4; Ta b l e 2). Treatments during lag phase raised HP expression by 50 to 150 percent, but failed to reach Figure 3. Electrophoresis and SOD staining of untreated E. coli extracts, harvested after (L to R) 1, 6, and 24 h of in- cubation, as described (see “Methods”). “Std” is 50 ng of E. coli MnSOD. Gel is repre- sentative of at least three trials. Table 2. Activity ratios of E. coli HP isozymes throughout all growth phases under treatment of 1.00 mM SNP, PFo, or PFi. HPII HPI Growth Phase Treatment Ratio SD RatioSD Lag phase (1 h) SNP PFo PFi 1.64 ± 1.52 1.50 ± 1.76 1.64 ± 1.42 2.32 ± 2.35 1.54 ± 1.71 1.65 ± 1.65 Exponential phase (6 h) SNP PFo PFi 1.33 ± 1.16 2.00 ± 1.84** 2.17 ± 1.54** 1.47 ± 0.78* 2.07 ± 1.48** 2.10 ± 0.95** Stationary phase (24 h) SNP PFo PFi 2.62 ± 1.06** 2.02 ± 0.72* 1.33 ± 0.27* 2.10 ± 1.60 2.45 ± 1.86* 1.93 ± 1.31 “Modified” Exponential phase (6 h) SNP PFo PFi 0.92 ± 0.73 1.00 ± 0.76 0.92 ± 0.68 1.63 ± 0.75** 1.51 ± 0.66** 1.16 ± 0.70 “Ratio” is defined as the average HP isozyme concentration of the treated E. coli divided by the average HP isozyme concentration of untreated E. coli under identical conditions. Significance at 90 (*) and 95 (**) percent confi- dence was determined through Student’s T-test and pooled standard devia- tion. Figure 4. E. coli HP expression profiles, presented as activity bands on non-denaturing polyacrylamide gels. E. coli originat- ing from overnight cultures were incubated as described (see “Methods”) in the presence of 1.00 mM sodium nitroprusside (SNP), 1.00 mM potassium ferrocyanide (PFo), or 1.00 mM potassium ferricyanide (PFi), then harvested after 1, 6, or 24 h of incubation (a-c). “6 h (mod)” are E. coli that were harvested after 6 h of incubation, but only received 1 h of exposure to a treatment (addition at 5 h point) (D). 20 µL of 0.6 mg/ml crude protein extract were loaded into each well, and electrophoresed and stained for HP activity as described (see “Methods”). “Std E.” is 10 ng of Corynebacterium glutamicum catalase, used as a positive standard. Under present conditions, E. coli HPII mi- grates slowest (top bands), and HPI fastest (bottom bands) [73]. Gels are representative of at least three independent trials. significance even at P ≤ 0.10. Heightened HP activity associated with iron treatments was often significant during logarithmic and stationary phases of growth. Unlike SOD, no redox-specific behaviour was observed as PFo and PFi had approximately similar effects on both isozymes of HP. This is evident by the comparatively similar HP activity ratios produced by PFo and PFi throughout all growth phases (Table 2). Remarkably, “modified” exponential phase trials an- alogous to those of SOD also revealed phase-dependent enzyme expression, but not in a manner anticipated. Both lag and exponential phase trials displayed conspicuous up-regulation of HP in response to iron challenge. How- ever, “modified” exponential phase trials (exposed to oxidants for only 1 h) displayed HPII activity ratios at or near 1, and SNP and PFo induced HPI expression at a level that barely achieved statistical significance These results suggest that the duration of exposure to these oxidants is a significant determining factor in HP expres- sion during exponential phase. 4. DISCUSSION 4.1. SNP Has a Unique Oxidative Impact on E. coli Though iron is present in PFi, PFo, and SNP, only the Copyright © 2013 SciRes. OPEN A CCESS  R. L. Bertrand, M. O. Eze / Advances in Enzyme Research 1 (2013) 132-141 137 NO-releasing SNP slowed exponential phase E. coli and prematurely arrested E. coli at a lower optical density at stationary phase (Figure 1). These results suggest that NO, or NO combined with iron, imparts unique oxidative consequences on E. coli. Nitric oxide is a free radical that can directly inflict oxidative damage or combine with other compounds to form powerful oxidative agents [56-58]. Peroxynitrite, the product of the reaction be- tween NO and superoxide, is one such agent that would be rapidly formed in a NO-flooded environment [59]. Peroxynitrite can self-generate by inhibiting electron transport chain complexes, arresting electron flow; and consequently, allow nearby oxygen molecules to steal electrons. Superoxide radicals adventitiously formed then bind with NO to form more peroxynitrite [57]. Con- sidering that exponential phase is characterized by maximal metabolic activity and that the exhaustion of metabolic substrates defines stationary phase, it is plau- sible that the slowed growth and premature plateau asso- ciated with SNP treatment is the consequence of per- oxynitrite-associated metabolic waste. This is by no means the only possible explanation. 4.2. SOD Expression is Immutable to Iron Challenge during Lag Phase Exponential phase E. coli exposed to SNP and PFo for 6 h was determined to have reduced MnSOD expression and enhanced FeSOD expression as compared to un- treated cultures, albeit with some statistical uncertainty (Figure 2; Ta b l e 1 ). We have previously suggested that such Fe(II)-associated changes should be mediated by the activation of Fur [47]. The present observations are consistent with studies demonstrating changes in FeSOD and MnSOD activities in iron-replete and iron-deplete conditions in a manner implicating Fur regulation [54, 60]. The dichotomous expression of SOD isozymes was not observed during lag phase (Figure 2; Tab l e 1), and this was accompanied by the observation of dramatically higher MnSOD expression during lag phase as compared to later growth phases (Figure 3). SOD recalcitrance was a puzzling observation considering that iron influx oc- curs during lag phase [61]; and therefore, dramatic changes in isozyme activities should have been produced through Fur induction. Several studies have suggested that the intracellular concentration of the Fur protein is significantly lower during lag phase of microbial replica- tion. During lag phase there is an impressive influx of iron (and other metals) that would be best mediated by low Fur levels [61]. Fur has been observed to activate the transcription of HPI and HPII, evident by the near ab- sence of both isozymes in mutant E. coli lacking Fur (Δfur); however, expression differences between mutant and wildtype strains were only plainly evident after lag phase had ended [23]. This latter observation is consis- tent with our own observations such that iron challenge may only induce changes in SOD expression once lag phase has ended. Furthermore, E. coli Δfur mutants and E. coli incubated in iron-deplete conditions show hei- ghtened MnSOD activity akin to what is presently ob- served in our lag phase cultures [18,23,54]. Heightened MnSOD expression is consistent with our hypothesis that Fur activity is low during lag phase because MnSOD would be logically de-repressed at this time. Therefore, based on these present observations and those of other researchers, we hypothesize that heightened SOD ex- pression, and recalcitrant SOD expression, during lag phase are the result of low intracellular levels of the Fur protein. To our best knowledge, no study of the in vivo concentration of the Fur regulator throughout the micro- bial growth phases has ever been conducted. Such a study would be fortuitous for evaluating this hypothesis, but such an experiment would be beyond the scope of the present research. It should be noted that MnSOD would still be inducible during this phase through other stimu- lants such as superoxide [62]. 4.3. HP Expression Patterns Suggest Underlying Metabolic Factors Determining HP Activity As iron (II)-activated Fur up-regulates HP expression [21,23], we expected to see redox-specific changes in HP activity akin to what was observed in SOD expression profiles. It was instead observed that both PFo and PFi increased HP activity with approximately similar activity ratios throughout all growth phases (Figure 4; Ta b le 2 ). The unique regulatory role of glutathione in prokaryotes provides a plausible explanation. Though glutathione is commonly known as an endogenous reducing agent, forming disulfide bridges that are then recycled by glu- tathione reductase and NADPH, in prokaryotic cells glu- tathione controls the expression of HP [63]. E. coli cells treated with ferricyanide have been observed to increase HPI activity, and glutathione has been implicated in this up-regulation [63,64]. As PFo may induce higher HPI expression through Fur, and not through other HP regu- lators such as the protein products of oxyR or rpoS [21], both iron (II) and iron (III) are capable of up-regulating HP activity by independent means. Heightened HP activ- ity in response to both PFo and PFi may therefore be the consequence of the involvement of both Fur and glu- tathione, and of the oxidative impact inflicted by these treatments necessitating such a robust anti-oxidative re- sponse. Both exponential and stationary phase cultures pre- sented substantial increases in HP activity in response to iron treatment (Table 2; Figures 4(b) and (c)). Exponen- Copyright © 2013 SciRes. OPEN A CCESS  R. L. Bertrand, M. O. Eze / Advances in Enzyme Research 1 (2013) 132-141 138 tial phase is the most metabolically active phase, pro- ducing ten times more hydrogen peroxide than any other phase [65-67]. To maintain homeostasis, cells respond to these generated oxidative and/or free radical stresses by dramatically up-regulating HP activity [65-67]. Through the catalysis of radicals by the Fenton reaction, the oxi- dative impact of iron would be greatest at this time. It should not be surprising to see such a robust response to these iron treatments during exponential phase (Figure 4(b); Ta ble 2). Heightened HP activity during stationary phase is also most probably the consequence of aerobic metabolism; and specifically, the acidification of the me- dia. We have observed that the pH of these glucose-based cultures decreased over time (data not shown), consistent with other pH studies [26]. The accumulation of weak acids in stationary phase is complacent in the up-regula- tion of HP [34,68]. Furthermore, Fenton’s own studies [69] and subsequent research by Walling [70] revealed that in mildly acidic environments, hydrogen peroxide may regenerate iron (II) from iron (III), generating per- oxyl radicals and hydrogen cations (Eq.4): + 2 3+ 2+ 2 Fe FH OHOOe H (4) The low pH in stationary phase media would therefore exacerbate the oxidative impact of iron and would fur- ther explain why the effects of PFi and PFo on HP ex- pression are similar. 4.4. Unexpected Findings and Study Limitations As studies using E. coli lacking Fur (Δfur) have shown [23], Fur is necessary for robust HP activity during lag phase. In accordance with our hypothesis of low Fur ac- tivity at this time, we had expected HP activity to be quite low compared to other phases at this time and that, like SOD, HP expression should be unresponsive to iron challenge. HP expression was indeed found to be much lower during lag phase than, say, exponential phase (data not shown); however, iron treatment did produce activity ratios deviating considerably from the expected value of 1, with much statistical uncertainty (Ta bl e 2 ). We have had some difficulty obtaining consistent data for HP during lag phase, and the error margins were quite large. We have previously observed in unpublished work that HP expression during lag phase is highly malleable to specific incubatory conditions. For example, the age of the over-night starter culture used to inoculate fresh me- dia for incubation is one such consideration: If it is old (e.g., one week) it decreases MnSOD activity by two thirds and doubles HPII activity, as compared to fresh starter culture. Harvest time within the lag period is an- other consideration: HPI activity is 10-fold higher 40 minutes post-inoculation than at 60 or 80 minutes post- inoculation. This heightened activity may possibly be an artifact from the starter culture as it exits stationary phase to renew replication in a nutrient-replete environment. If so, this would implicate this 40 to 60 minute interval as a transitional period for HP activity, and any experimental work during this time is bound to produce much variance in data. Future studies harvesting at 80 minutes under identical conditions may remove this source of error. Temperature is yet another consideration: To illustrate the effects of extreme environmental change, we have observed that when a starter culture is cooled to 4˚C then added to fresh media set at 37˚C, both HP and SOD ex- pression are affected as compared to starter cultures kept at 37˚C throughout. These observations may be of inter- est in elucidating the antioxidant profile during this most poorly understood phase of microbial replication. We did not encounter data consistency issues when assaying SOD activity during lag phase, which instead showed remarkably consistent data that proved useful for formu- lating the present hypothesis. Each enzyme activity ratio is the mean value of a treated condition divided by the mean value of the cor- responding untreated standard. Hence, the standard de- viation for each activity ratio is the product of the error of the treated data set and the error of the untreated data set. This approach will inevitably produce considerably large error margins in the final activity ratios given smaller error margins in either data set. We used the pre- sent methodology because it has previously shown to be a simple and successful means of investigating antioxi- dant expression profiles in microbial culture [47]. Al- though we are confident that SOD expression is both heightened and unresponsive to iron challenge during lag phase, the considerable error margins produced by the methodological approach in many of the treatments and growth phases stresses caution in interpretation. Some changes in SOD or HP activity induced by iron treat- ments proved statistically significant, but others did not. Alternative experimental approaches could be useful for supporting the present observations and further elucidat- ing the role of Fur in regulating antioxidant enzymes in response to iron threats. 5. ACKNOWLEDGEMENTS This work was supported by the following grants which are hereby gratefully acknowledged: Research Corporation Cottrell College Sci- ence Award #5926 [Research Corporation, 4703 E. Camp Lowell Drive, Suite 201, Tucson, AZ 85712, USA] to MOE; two University of Win- nipeg (UofW) Major Research Grants #7437 and #7671 to MOE; and a Special Grant from the UofW Research and Graduate Studies Office to Dr. Desiree Vanderwel (Chemistry Dept. UofW) and MOE. We are also grateful to Mr. Ramin Vakili (Chemistry Dept., UofW) and Dr. Jamie Galka (Chemistry Dept., UofW) for valuable technical assistance. An NSERC PGS-M (425305-2012) awarded to RLB is also gratefully ac- knowledged. We also thank two anonymous reviewers for their insightful Copyright © 2013 SciRes. OPEN A CCESS  R. L. Bertrand, M. O. Eze / Advances in Enzyme Research 1 (2013) 132-141 139 critiques on previous drafts of the manuscript. REFERENCES [1] Benov, L.T. (2001) How superoxide radical damages the cell. Protoplasma, 217, 33-36. http://dx.doi.org/10.1007/BF01289410 [2] Cerutti, P.A. (1985) Prooxidant states and tumor promo- tion. Science, 227, 375-381. http://dx.doi.org/10.1126/science.2981433 [3] Halliwell, B. (1987) Oxidants and human disease: Some new concepts. Journal of the Federation of American So- cieties for Experimental Biology, 1, 358-364. [4] Harman, D. (1991) The aging process: Major risk factor for disease and death. Proceedings of the National Academy of Sciences of the United States of America, 88, 5360-5363. http://dx.doi.org/10.1073/pnas.88.12.5360 [5] González-Flecha, B., Cutrin, J.C. and Boveris, A. (1993) Time course and mechanism of oxidative stress and tissue damage in rat liver subjected to in vivo ischemia-reperfu- sion. Journal of Clinical Investigations, 91, 456-464. http://dx.doi.org/10.1172/JCI116223 [6] Luft, R. (1994) The development of mitochondrial medi- cine. Proceedings of the National Academy of Sciences of the United States of America, 91, 8731-8738. http://dx.doi.org/10.1073/pnas.91.19.8731 [7] Yan, S.D., Chen, X., Schmidt, A.M., Brett, J., Godman, G., Zou, Y.S., et al. (1994) Glycated tau protein in Alzheimer disease: A mechanism for induction of oxidant stress. Proceedings of the National Academy of Sciences of the United States of America, 91, 7787-7791. http://dx.doi.org/10.1073/pnas.91.16.7787 [8] Muller, F.L., Song, W., Liu, Y., Chaudhuri, A., Pieke-Dahl, S., Strong, R., et al. (2006) Absence of CuZn superoxide dismutase leads to elevated oxidative stress and accelera- tion of age-dependent skeletal muscle atrophy. Free Radical Biology and Medicine, 40, 1993-2004. http://dx.doi.org/10.1016/j.freeradbiomed.2006.01.036 [9] Halliwell, B. and Gutteridge, J.M. (1984) Oxygen toxicity, oxygen radicals, transition metals and disease. Biochem- istry Journal, 219, 1-14. [10] Halliwell, B. and Gutteridge, J.M. (1997) Lipid peroxida- tion in brain homogenates: The role of iron and hydroxyl radicals. Journal of Neurochemistry, 69, 1330-1331. http://dx.doi.org/10.1046/j.1471-4159.1997.69031330.x [11] Bagg, A. and Neilands, J.B. (1987) Molecular mecha- nism of regulation of siderophore-mediated iron assimila- tion. Microbiology Reviews, 51, 509-518. [12] Hubbard, J.A.M., Lewandowska, K.B., Hughes, M.N. and Poole, R.K. (1986) Effects of iron-limitation of Es- cherichia coli on growth, the respiratory chains and gal- lium uptake. Archives of Microbiology, 146, 80-86. http://dx.doi.org/10.1007/BF00690163 [13] Bagg, A. and Neilands, J.B. (1987) Ferric uptake regula- tion acts as a repressor, employing iron (II) as a cofactor to bind the operator of an iron transport operon in Es- cherichia coli. Biochemistry, 26, 5471-5477. http://dx.doi.org/10.1021/bi00391a039 [14] Escolar, L., Pérez-Martin, J. and De Lorenzo, V. (1999) Opening the iron box: Transcriptional metalloregulation by the Fur protein. Journal of Bacteriology, 181, 6223- 6229. [15] Hantke, K. (2001) Iron and metal regulation in bacteria. Current Opinion in Microbiology, 4, 172-177. http://dx.doi.org/10.1016/S1369-5274(00)00184-3 [16] Tardat, B. and Touati, D. (1991) Two global regulators repress the anaerobic expression of MnSOD in E. coli: Fur (ferric uptake regulation) and Arc (aerobic respiration control). Molecular Microbiology, 5, 455-465. http://dx.doi.org/10.1111/j.1365-2958.1991.tb02129.x [17] Tardat, B. and Touati, D. (1993) Iron and oxygen regula- tion of Escherichia coli MnSOD expression: Competition between the global regulators Fur and ArcA for binding to DNA. Molecular Microbiology, 9, 53-63. http://dx.doi.org/10.1111/j.1365-2958.1993.tb01668.x [18] Hassett, D.J., Sokol, P.A., Howell, M.L., Ma, J.F., Sch- weizer, H.T., Ochsner, U., et al. (1996) Ferric uptake regulator (Fur) mutants of Pseudomonas aeruginosa demonstrate defective siderophore-mediated iron uptake, altered aerobic growth, and decreased superoxide dismu- tase and catalase activities. Journal of Bacteriology, 178, 3996-4003. [19] Dubrac, S. and Touati, D. (2000) Fur positive regulation of iron superoxide dismutase in Escherichia coli: Func- tional analysis of the sodB promoter. Journal of Bacteri- ology, 182, 3802-3808. http://dx.doi.org/10.1128/JB.182.13.3802-3808.2000 [20] Dubrac, S. and Touati, D. (2002) Fur-mediated transcrip- tional and post-transcriptional regulation of FeSOD ex- pression in Escherichia coli. Microbiology, 148, 147-156. [21] Zaid, T., Sukumaran, T., Srikumar, N. and Benov, L. (2003) Growth of Escherichia coli in iron-enriched me- dium increases HPI catalase activity. Journal of Bio- chemistry and Molecular Biology, 36, 608-610. http://dx.doi.org/10.5483/BMBRep.2003.36.6.608 [22] Benov, L. and Sequeira, F. (2003) Escherichia coli Δfur mutant displays low HPII catalase activity in stationary phase. Redo x Report, 8, 379-383. http://dx.doi.org/10.1179/135100003225003357 [23] Hoerter, J.D., Arnold, A.A., Ward, C.S., Sauer, M., John- son, S., Fleming, T., et al. (2005) Reduced hydroperoxi- dase (HPI and HPII) activity in the delta fur mutant con- tributes to increased sensitivity to UVA radiation in Es- cherichia coli. Journal of Photochemistry and Photobi- ology B, 79, 151-157. http://dx.doi.org/10.1016/j.jphotobiol.2005.01.003 [24] Schellhorn, H.E. and Hassan, H.M. (1988) Response of hydroperoxidase and superoxide dismutase deficient mu- tants of Escherichia coli K-12 to oxidative stress. Cana- dian Journal of Microbiology, 34, 1171-1176. http://dx.doi.org/10.1139/m88-206 [25] Park. S., You, X. and Imlay, J.A. (2005) Substantial DNA damage from submicromolar intracellular hydrogen per- oxide detected in Hpx- mutants of Escherichia coli. Pro- ceedings of the National Academy of Sciences of the United States of America, 102, 9317-9322. http://dx.doi.org/10.1073/pnas.0502051102 Copyright © 2013 SciRes. OPEN A CCESS  R. L. Bertrand, M. O. Eze / Advances in Enzyme Research 1 (2013) 132-141 140 [26] Hassan, H.M. and Fridovich, I. (1977) Regulation of superoxide dismutase synthesis in Escherichia coli: Glu- cose effect. Journal of Bacteriology, 132, 505-510. [27] Korshunov, S. and Imlay, J.A. (2006) Detection and quantification of superoxide formed within the periplasm of Escherichia coli. Journal of Bacteriology, 188, 6326- 6334. http://dx.doi.org/10.1128/JB.00554-06 [28] Hopkin, K.A., Papazian, M.A. and Steinman, H.M. (1992) Functional differences between manganese and iron su- peroxide dismutases in Escherichia coli K-12. Journal of Bacteriology, 267, 24253-24258. [29] Compan, I. and Touati, D. (1993) Interaction of six global transcription regulators in expression of manganese su- peroxide dismutase in Escherichia coli K-12. Journal of Bacteriology, 175, 1687-1696. [30] Triggs-Raine, B.L., Doble, B.W., Mulvey, M.R., Sorby, P.A. and Loewen, P.C. (1988) Nucleotide sequence of katG, encoding catalase HPI of Escherichia coli. Journal of Bacteriology, 170, 4415-4419. [31] von Ossowski, I., Mulvey, M.R., Leco, P.A., Borys, A. and Loewen, P.C. (1991) Nucleotide sequence of Es- cherichia coli katE, which encodes catalase HPII. Journal of Bacteriology, 173, 514-520. [32] Schellhorn, H.E. (1995) Regulation of hydroperoxidase (catalase) expression in Escherichia coli. Federation of European Microbiological Societies: Mic robiology Letters, 131, 113-119. http://dx.doi.org/10.1111/j.1574-6968.1995.tb07764.x [33] Mulvey, M.R., Switala, J., Borys, A. and Loewen, P.C. (1990) Regulation of transcription of katE and katF in Escherichia coli. Journal of Bacteriology, 172, 6713- 6720. [34] Schellhorn, H.E. and Stones, V.L. (1992) Regulation of katF and katE in Escherichia coli K-12 by weak acids. Journal of Bacteriology, 174, 4769-4776. [35] Eisenstark, A., Calcutt, M.J., Becker-Hapak, M. and Ivanova, A. (1996) Role of Escherichia coli rpoS and as- sociated genes in defense against oxidative damage. Free Radicals in Biology and Medicine, 21, 975-993. http://dx.doi.org/10.1016/S0891-5849(96)00154-2 [36] Loewen, P.C. and Hengge-Aronis, R. (1994) The role of the sigma factor sigma S (KatF) in bacterial global regu- lation. Annual Review of Microbiology, 48, 53-80. http://dx.doi.org/10.1146/annurev.mi.48.100194.000413 [37] Ivanova, A., Miller, C., Glinsky, G. and Eisenstark, A. (1994) Role of rpoS (katF) in oxyR-independent regula- tion of hydroperoxidase I in Escherichia coli. Molecular Microbiology, 12, 571-578. http://dx.doi.org/10.1111/j.1365-2958.1994.tb01043.x [38] Panacek, E.A., Bednarczyk, E.M., Dunbar, L.M., Foulke, G.E. and Holcslaw, T.L. (1995) Randomized, prospective trial of fenoldopam vs sodium nitroprusside in the treat- ment of acute severe hypertension. Fenoldopam Study Group. Academic Emergency Medicine, 2, 959-965. http://dx.doi.org/10.1111/j.1553-2712.1995.tb03122.x [39] Pathak, A., Mathuriya, S.N., Khandelwal, N. and Verma, K. (2003) Intermittent low dose intrathecal sodium nitroprus- side therapy for treatment of symptomatic aneurismal SAH- induced vasospasm. British Journal of Neurosurgery, 17, 306-310. http://dx.doi.org/10.1080/02688690310001601180 [40] Mullens, W., Abrahams, Z., Francis, G.S., Skouri, H.N., Starling, R.C., Young, J.B., et al. (2008) Sodium nitroprus- side for advanced low-output heart failure. Journal of the American College of Cardiology, 52, 200-207. http://dx.doi.org/10.1016/j.jacc.2008.02.083 [41] Chantler, P.D., Nussbacher, A., Gerstenblith, G., Schulman, S.P., Becker, L.C., Ferrucci, L., Fleg, J.L., Lakatta, E.G. and Najjar, S.S. (2011) Abnormalities in arterial-ventricular coupling in older healthy persons are attenuated by sodium nitroprusside. American Journal of Physiology: Heart and Cir culatory Physiology, 300, H1914- H1922. http://dx.doi.org/10.1152/ajpheart.01048.2010 [42] Yannopoulos, D., Matsuura, T., Schultz, J., Rudser, K., Halperin, H.R. and Lurie, K.G. (2011) Sodium nitrorprus- side enhanced cardiopulmonary resuscitation improves sur- vival with good neurological function in a porcine mo- del of prolonged cardiac arrest. Critical Care Medicine, 39, 1269-1274. [43] Grossi, L. and D’Angelo, S. (2005) Sodium nitroprusside: Mechanism of NO release mediated by sulfhydryl-con- taining molecules. Journal of Medicinal Chemistry, 48, 2622-2626. http://dx.doi.org/10.1021/jm049857n [44] D’Autreaux, B., Touati, D., Bersch, B., Latour, J.M. and Michaud-Soret, I. (2002) Direct inhibition by nitric oxide of the transcriptional ferric uptake regulation protein via nitrosylation of the iron. Proceedings of the National Academy of Sciences of the United States of America, 99, 16619-16624. http://dx.doi.org/10.1073/pnas.252591299 [45] Foster, M.W., McMahon, T.J. and Stamler, J.S. (2003) S- Nitrosylation in health and disease. Trends in Molecular Medicine, 9, 160-168. http://dx.doi.org/10.1016/S1471-4914(03)00028-5 [46] Szacilowski, K., Chmura, A. and Stasicka, Z. (2005) In- terplay between iron complexes, nitric oxide and sulfur ligands: Structure, (photo)reactivity and biological impor- tance. Coordination Chemistry Reviews, 249, 2408-2436. http://dx.doi.org/10.1016/j.ccr.2005.03.021 [47] Bertrand, R., Danielson, D., Gong, V., Olynik, B. and Eze, M.O. (2012) Sodium nitroprusside may modulate Escheri- chia coli antioxidant enzyme expression by interacting with the ferric uptake regulator. Medical Hypotheses, 78, 130- 133. http://dx.doi.org/10.1016/j.mehy.2011.10.007 [48] Nunoshiba, T., De Rojas-Walker, T., Wishnok, J.S., Tan- nenbaum, S.R. and Demple, B. (1993) Activation by ni- tric oxide of an oxidative-stress response that defends Es- cherichia coli against activated macrophages. Proceed- ings of the National Academy of Sciences of the United S tates of America, 90, 9993-9997. http://dx.doi.org/10.1073/pnas.90.21.9993 [49] Vasil’eva, S.V., Stupakova, M.V., Lobysheva, I.I., Miko- yan, V.D. and Vanin, E.F. (2001) Activation of the Es- cherichia coli SoxRS-Regulon by nitric oxide and its phy- siological donors. Biochemistry, 66, 984-988. [50] Niederhoffer, E.C., Naranjo, C.M., Bradley, K.L. and Fee, J.A. (1990) Control of Escherichia coli superoxide dis- mutase (sodA and sodB) genes by the ferric uptake regu- Copyright © 2013 SciRes. OPEN A CCESS  R. L. Bertrand, M. O. Eze / Advances in Enzyme Research 1 (2013) 132-141 Copyright © 2013 SciRes. OPEN A CCESS 141 lation (fur) locus. Journal of Bacteriology, 172, 1930-1938. [51] Massé, E. and Gottesman, S. (2002) A small RNA regu- lates the expression of genes involved in iron metabolism in Escherichia coli. Proceedings of the National Academy of Sciences of the United States of America, 99, 4620- 4625. http://dx.doi.org/10.1073/pnas.032066599 [52] Bradford, M.M. (1976) A rapid and sensitive method for the quantitation of microgram quantities of protein utiliz- ing the principle of protein-dye binding. Analytical Bio- chemistry, 72, 248-254. http://dx.doi.org/10.1016/0003-2697(76)90527-3 [53] Beauchamp, C. and Fridovich, I. (1971) Superoxide dis- mutase: Improved assays and an assay applicable to acry- lamide gels. Analytical Biochemistry, 44, 276-287. http://dx.doi.org/10.1016/0003-2697(71)90370-8 [54] Britigan, B.E., Miller, R.A., Hassett, D.J., Pfaller, M.A., McCormick, M.L. and Rasmussen, G.T. (2001) Antioxi- dant enzyme expression in clinical isolates of Pseudo- monas aeruginosa: Identification of an aytypical form of manganese superoxide dismutase. Infection and Immunity, 69, 7396-7401. http://dx.doi.org/10.1128/IAI.69.12.7396-7401.2001 [55] Woodbury, W., Spencer, A.K. and Stahman, M.A. (1971) An improved procedure using ferricyanide for detecting catalase isozymes. Analytical Biochemistry, 44, 301-305. http://dx.doi.org/10.1016/0003-2697(71)90375-7 [56] Zaki, M.H., Akuta, T. and Akaike, T. (2005) Nitric ox- ide-induced nitrative stress involved in microbial patho- genesis. Journal of Pharmacological Sciences, 98, 117- 129. http://dx.doi.org/10.1254/jphs.CRJ05004X [57] Pacher, P., Beckman, J.S. and Liaudet, L. (2007) Nitric oxide and peroxynitrite in health and disease. Physio- logical Reviews, 87, 315-424. http://dx.doi.org/10.1152/physrev.00029.2006 [58] Qu, W., Zhou, Y.B., Shao, C.H., Sun, Y.D., Zhang, Q.Y., Chen, C.Y. and Jia, J.H. (2009) Helicobacter pylori pro- teins response to nitric oxide stress. Journal of Microbi- ology, 47, 486-493. http://dx.doi.org/10.1007/s12275-008-0266-0 [59] Huie, R.E. and Padmaja, S. (1993) The reaction rate of nitric oxide with superoxide. Free Radical Research, 18, 195-199. http://dx.doi.org/10.3109/10715769309145868 [60] Privalle, C.T. and Fridovich, I. (1993) Iron specificity of the Fur-dependent regulation of the biosynthesis of the manganese-containing superoxide dismutase in Escheri- chia coli . Journal of Biological Chemistry, 268, 5178-5181. [61] Rolfe, M.D., Rice, C.J., Lucchini, S., Pin, C., Thompson, A., Cameron, A.D.S., et al. (2012) Lag phase is a distinct growth phase that prepares bacteria for exponential growth and involves transient metal accumulation. Journal of Bac- teriology, 194, 686-701. http://dx.doi.org/10.1128/JB.06112-11 [62] Kim, J.S., Sung, M.H., Kho, D.H. and Lee, J.K. (2005) Induction of managanese-containing superoxide dismu- tase is required for acid tolerance in Vibrio vulnificus. Journal of Bacteriology, 187, 5984-5995. http://dx.doi.org/10.1128/JB.187.17.5984-5995.2005 [63] Oktyabrsky, O.N., Smirnova, G.V. and Muzyka, N.G. (2001) Role of glutathione in regulation of hydroperoxidase I in growing Escherichia coli. Free Radicals in Biology and Medicine, 31, 250-255. http://dx.doi.org/10.1016/S0891-5849(01)00572-X [64] Smirnova, G.V., Muzyka, N.G., Glukhovchenko, M.N. and Oktyabrsky, O.N. (1997) Effects of penetrating and non- penetrating oxidants on Escherichia coli. Biochemistry, 62, 480-484. [65] González-Flecha, B. and Demple, B. (1995) Metabolic sources of hydrogen peroxide in aerobically growing Es- cherichia coli. Journal of Biological Chemistry, 270, 13681-13687. http://dx.doi.org/10.1074/jbc.270.23.13681 [66] González-Flecha, B. and Demple, B. (1997) Homeostatic regulation of intracellular hydrogen peroxide concentra- tion in aerobically growing Escherichia coli. Journal of Bacteriology, 179, 382-388. [67] González-Flecha, B. and Demple, B. (1997) Transcrip- tional regulation of the Escherichia coli oxyR gene as a function of cell growth. Journal of Bacteriology, 179, 6181- 6186. [68] Mukhopadhyay, S. and Schellhorn, H.E. (1994) Induction of Escherichia coli hydroperoxidase I by acetate and other weak acids. Journal of Bacteriology, 176, 2300-2307. [69] Fenton, H.J.H. (1894) Oxidation of tartaric acid in pres- ence of iron. Journal of the Chemical Society, Transac- tions, 65, 899-910. http://dx.doi.org/10.1039/ct8946500899 [70] Walling, C. (1975) Fenton’s reagent revisited. Accounts of Chemical Research, 8, 125-131. http://dx.doi.org/10.1021/ar50088a003 [71] Benov, L.T. and Fridovich, I. (1994) Escherichia coli expresses a copper- and zinc-containing superoxide dis- mutase. The Journal of Biological Chemistry, 269, 25310- 25314. [72] Bereswill, S., Neurner, O., Strobel, S. and Kist, M. (2000) Identification and molecular analysis of superoxide dis- mutase isoforms in Heliobacter pylori. Federation of European Microbiological Societies: Microbiology Letters, 183, 241-245. http://dx.doi.org/10.1111/j.1574-6968.2000.tb08965.x [73] Loewen, P.C., Triggs, B.L., George, C.S. and Hrabarchuk, B.E. (1985) Genetic mapping of katG, a locus that affects synthesis of the bifunctional catalase-peroxidase hydrop- eroxidase I in Escherichia coli. Journal of Bacteriology, 162, 661-667.
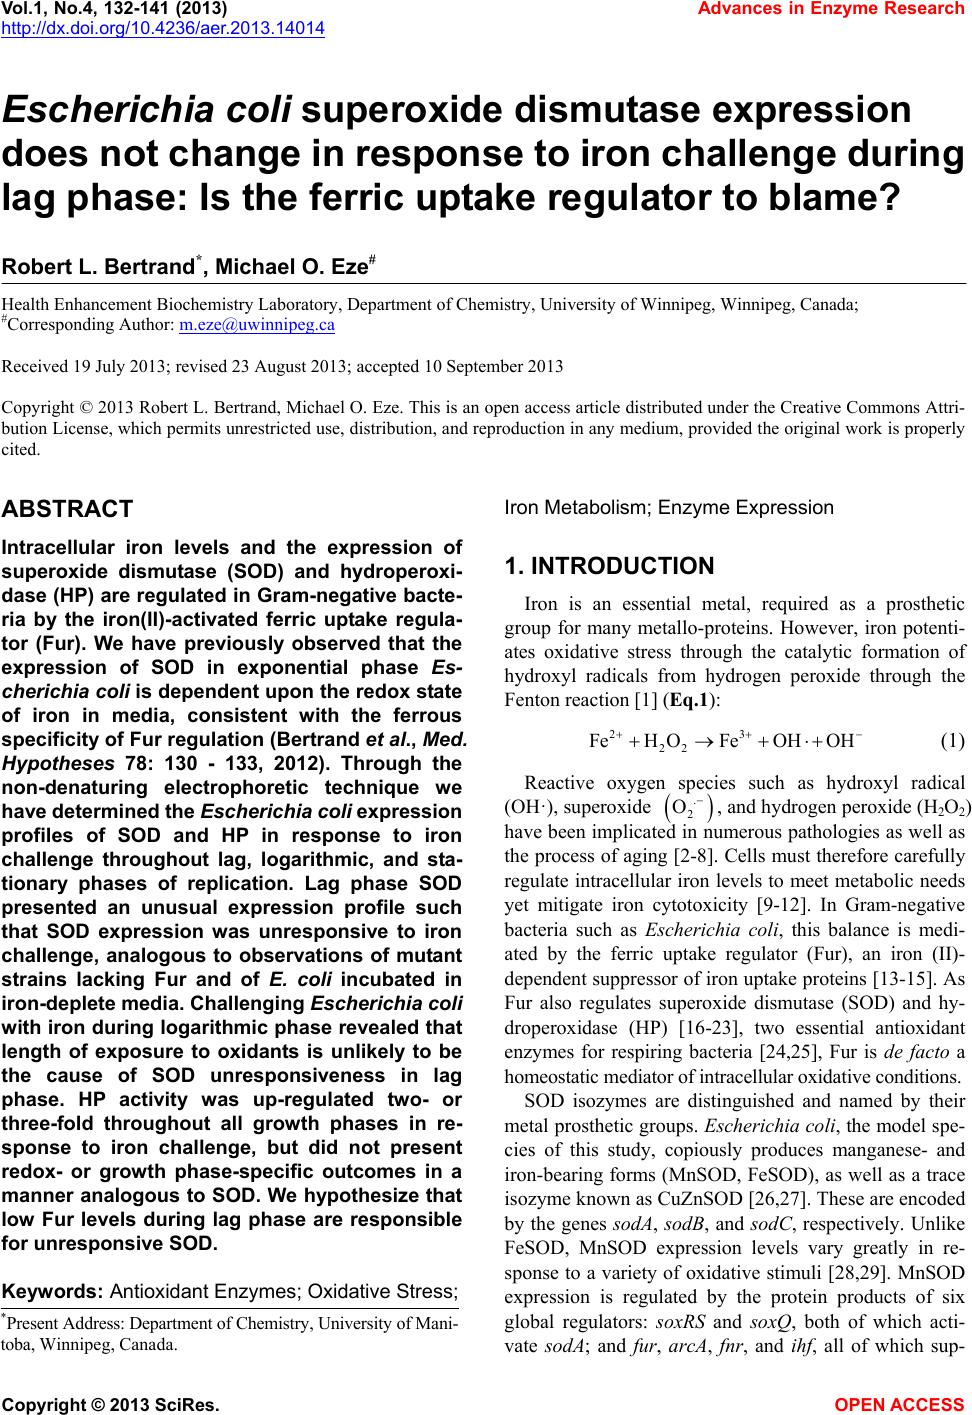
|