A. FABRIKANT ET AL.
1700
-20
0
20
40
60
80
100
-0.5 -0.3-0.10.10.30.5
Kinv(r)
Radial distance (mm)
1.E+1
1.E+2
1.E+3
1.E+4
1.E+5
1.E+6
0510 15 20 25 30
|F[Kinv(k)]|
k (cycles/mm)
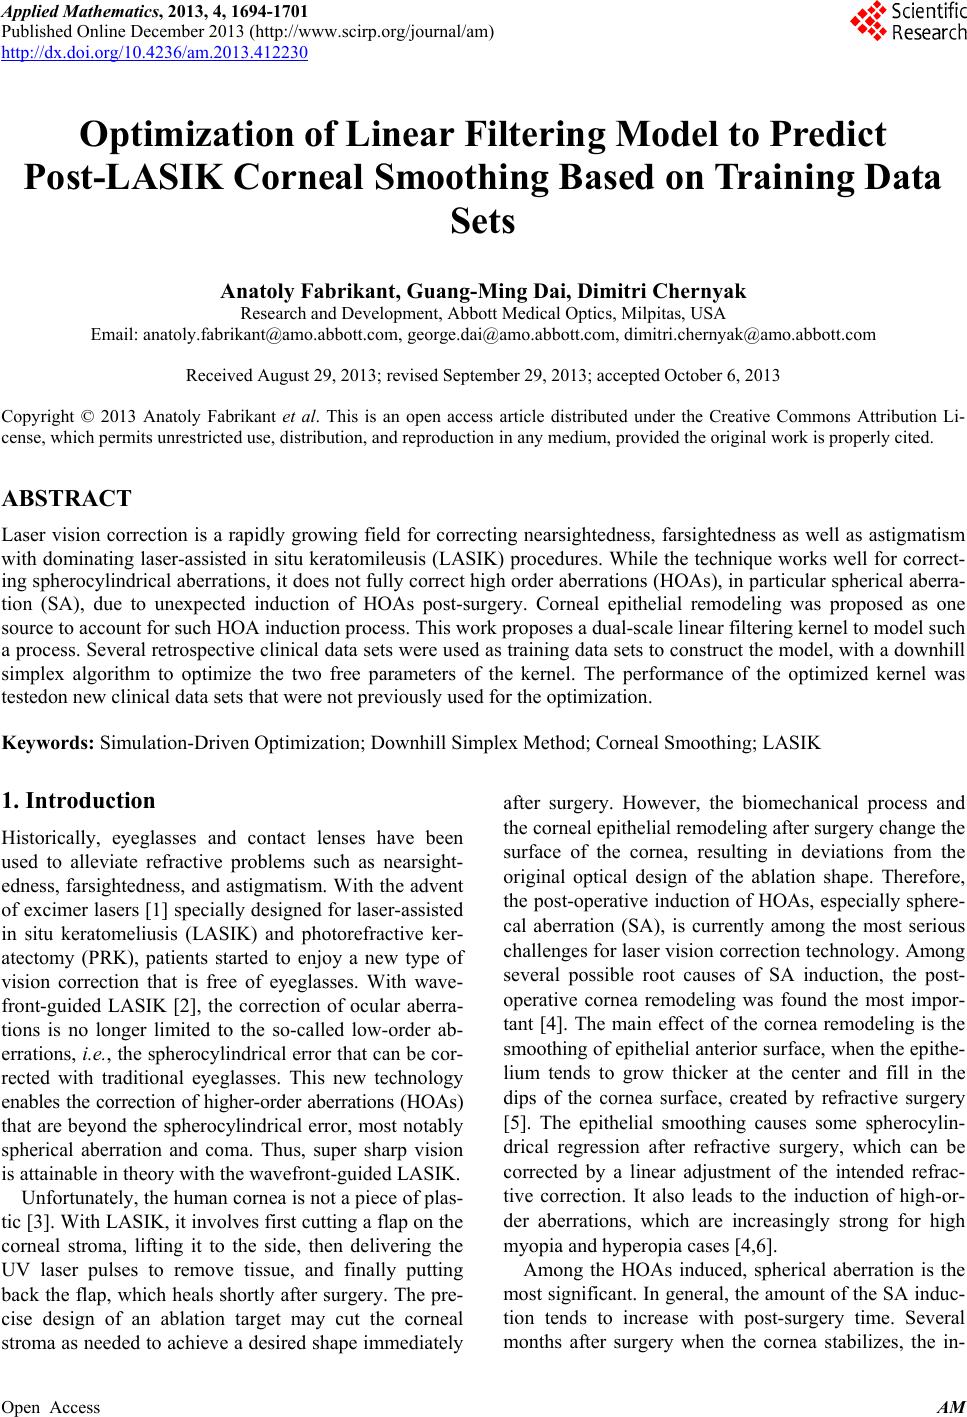
Superficial cells
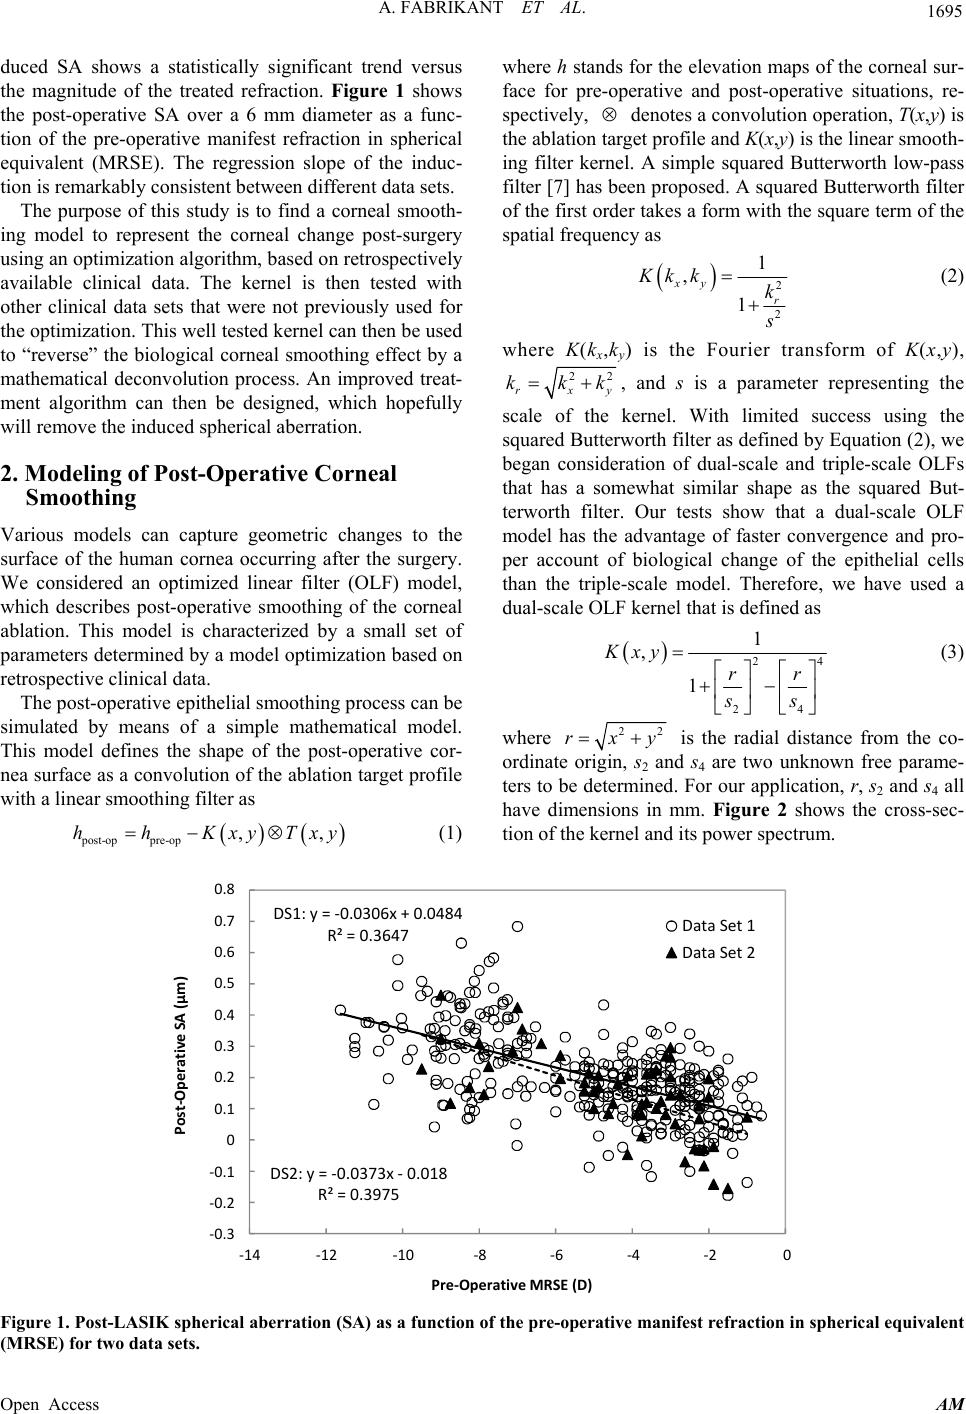
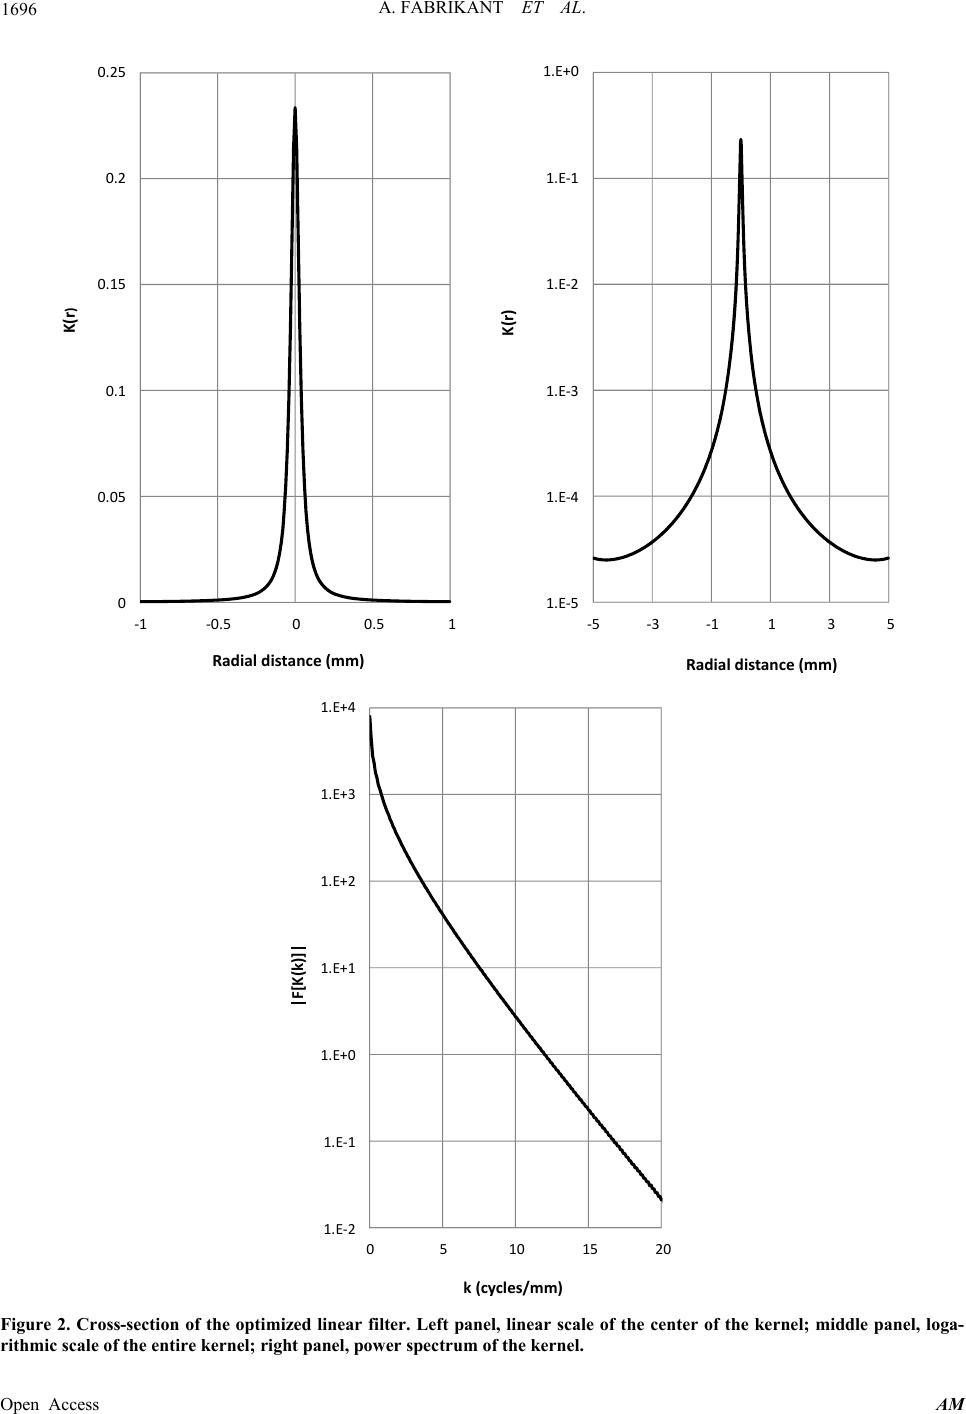
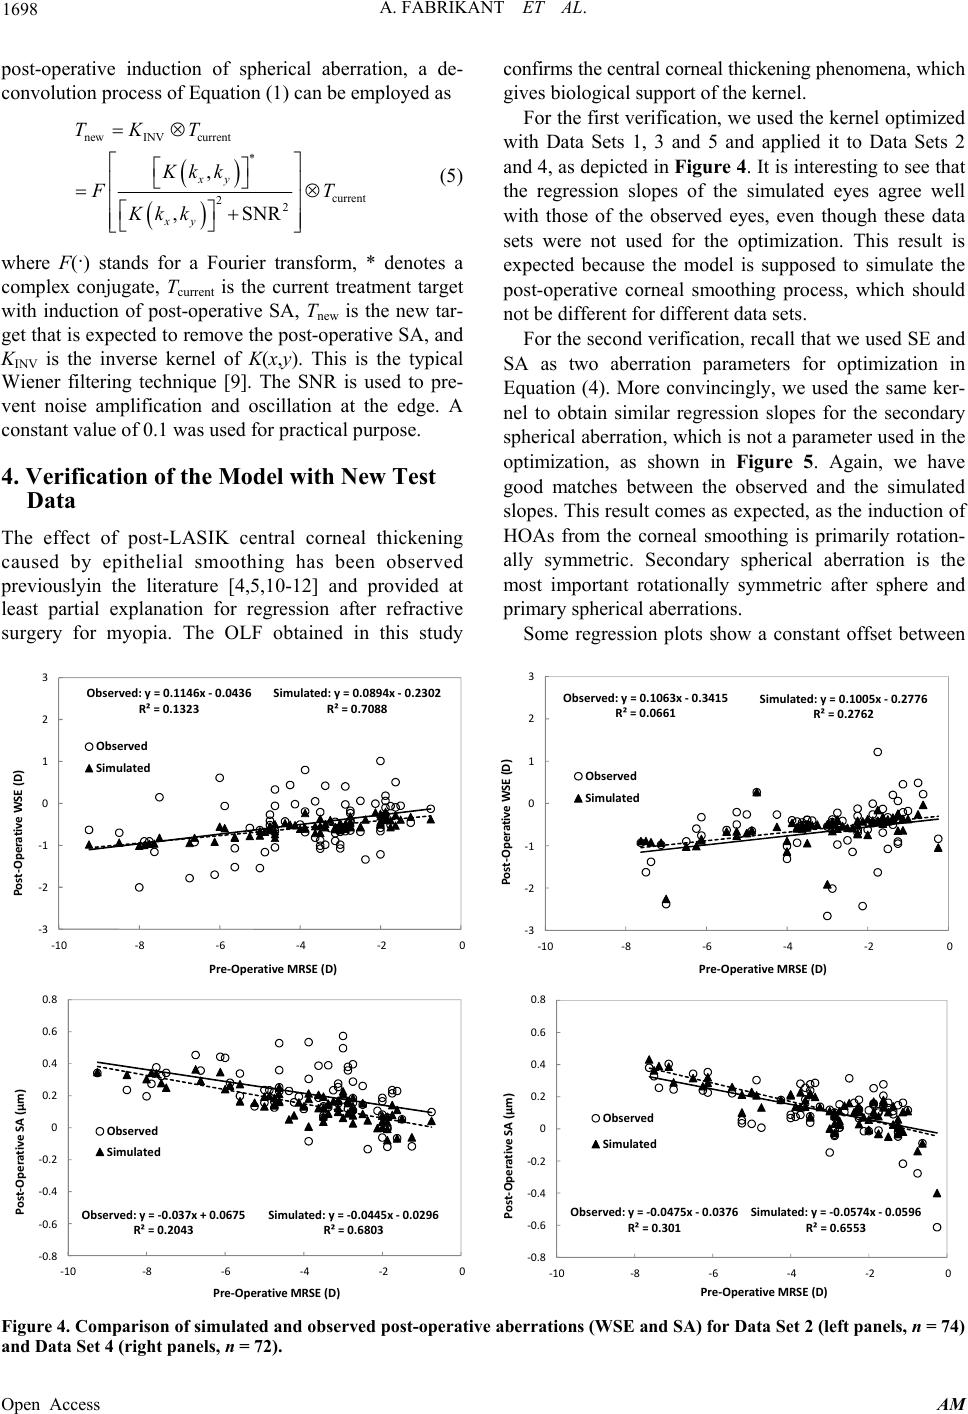
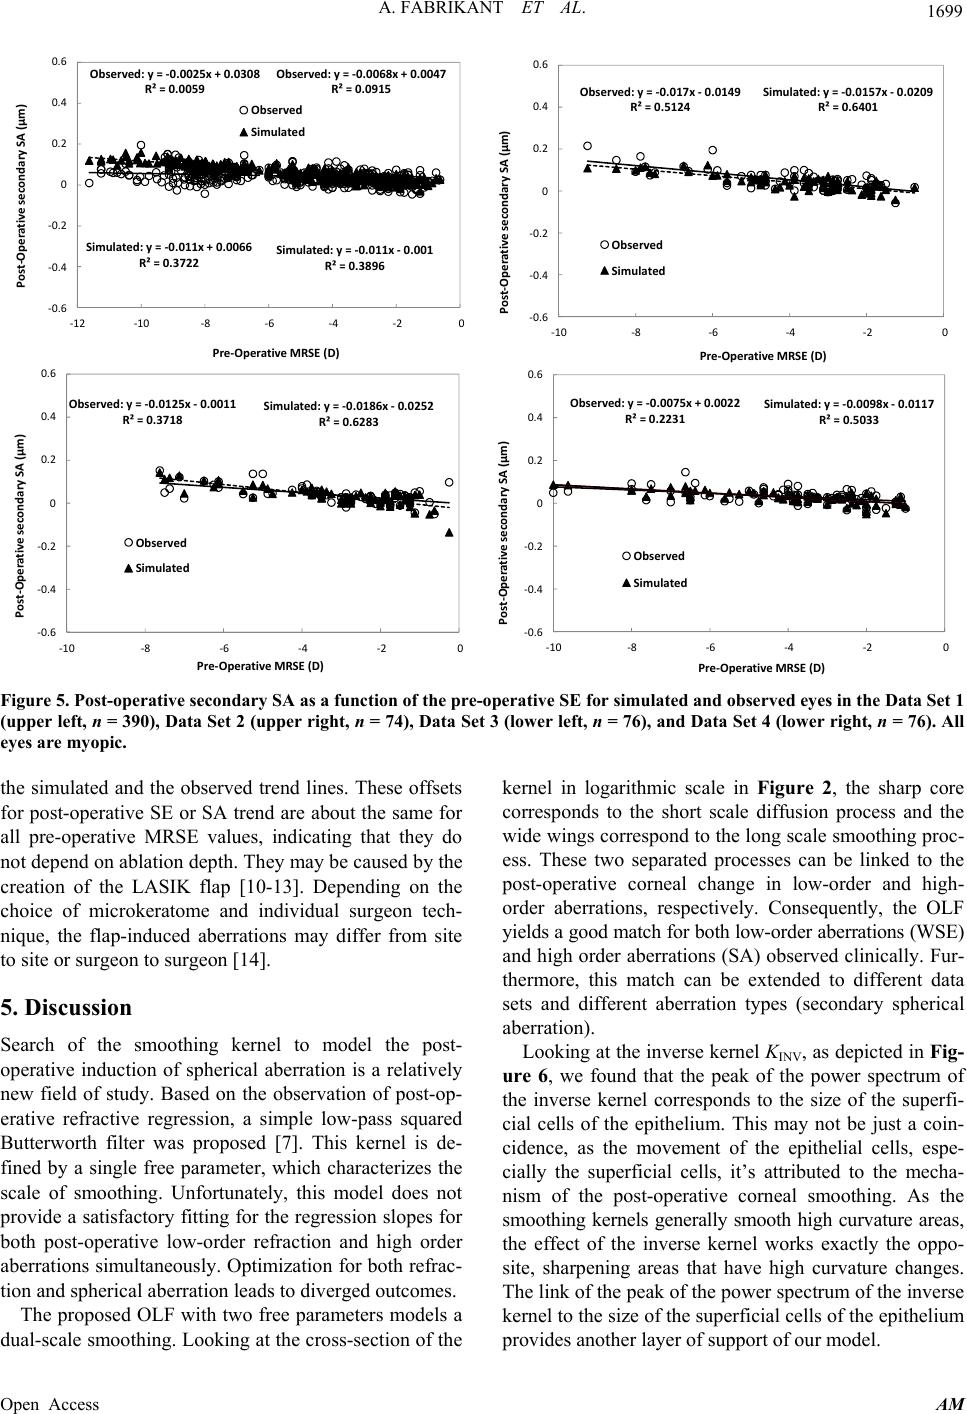
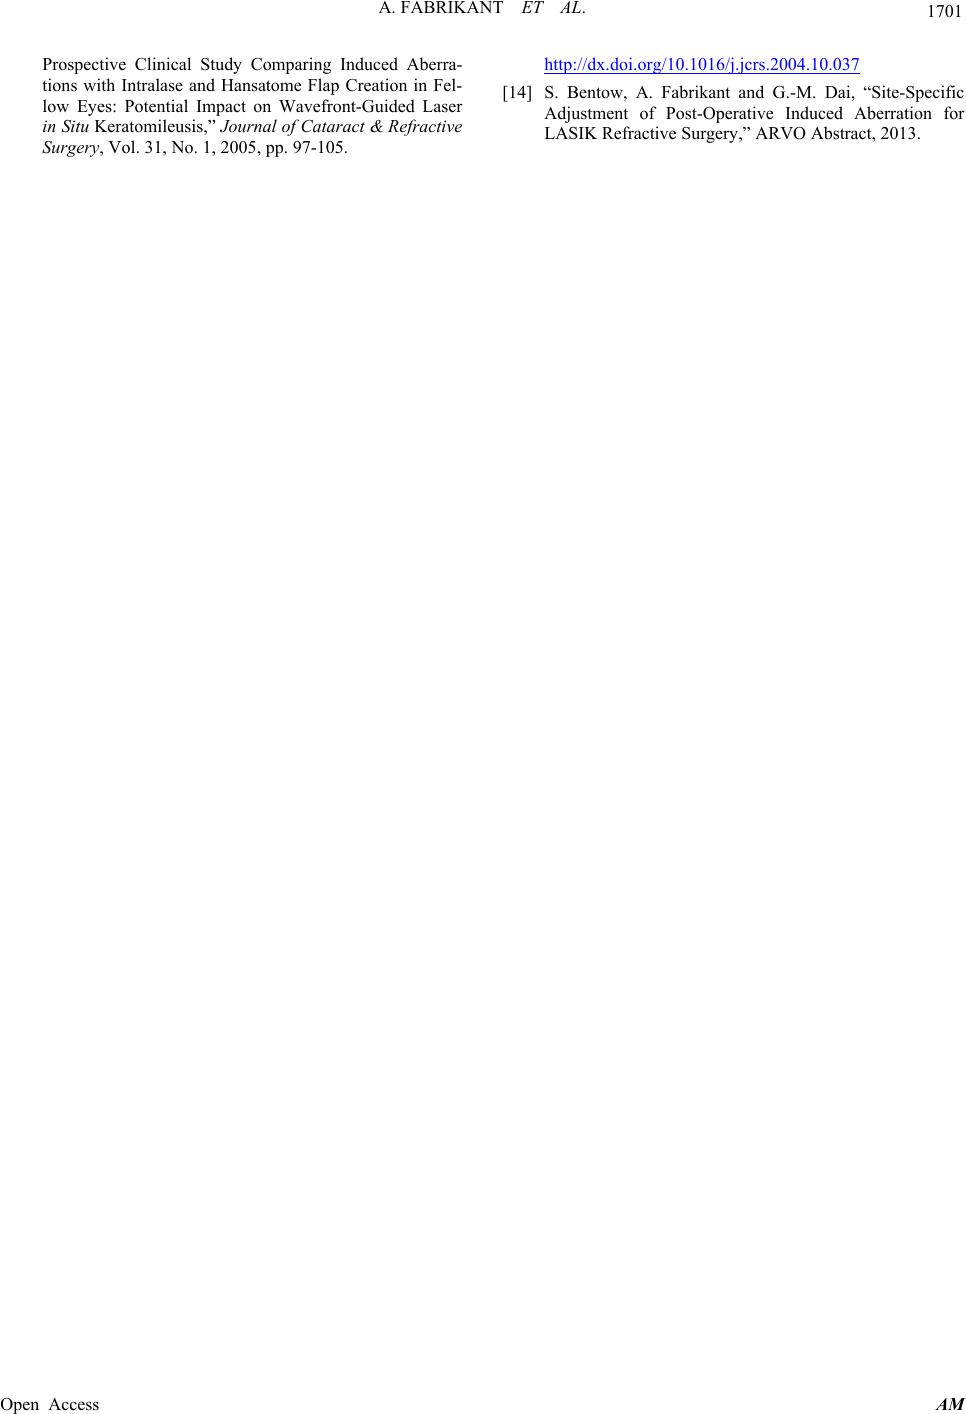
Figure 6. Cross-section of the inverse kernel of the OLF. Left panel, the inverse kernel; right panel, the power spectrum.
Similar to the neural network technique where a data
set is used to train the network and a new data set is used
to test the network, we used combination of data sets to
optimize the free parameters of the proposed kernel and
used new data sets to test the effectiveness of the model.
The successful test of the model strengthens is useful-
ness, which can be important when costly clinical trials
are decided.
REFERENCES
[1] S. L. Trokel, R. Srinivasan, and B. Braren, “Excimer Laser
Surgery of the Cornea,” American Journal of Ophthal-
mology, Vol. 96, No. 6, 1983, pp. 710-715.
[2] G.-M. Dai, “Wavefront Optics for Vision Correction,”
SPIE Press, Bellingham, 2008.
http://dx.doi.org/10.1117/3.769212
[3] C. Roberts, “The Cornea Is Not a Piece of Plastic,” Jour-
nal of Refractive Surgery, Vol. 16, No. 4, 2000, pp. 407-
413.
[4] G. Yoon, S. MacRae, D. R. Williams and I. G. Cox,
“Causes of Spherical Aberration Induced by Laser Re-
fractive Surgery,” Journal of Cataract & Refractive Sur-
gery, Vol. 31, No. 1, 2005, pp. 127-135.
http://dx.doi.org/10.1016/j.jcrs.2004.10.046
[5] S. V. Patel, J. C. Erie, J. W. McLaren and W. M. Bourne,
“Confocal Microscopy Changes in Epithelial and Stromal
Thickness up to 7 Years after LASIK and Photorefractive
Keratectomy for Myopia,” Journal of Refractive Surgery,
Vol. 23, No. 4, 2007, pp. 385-392.
[6] T. Oshika, K. Miyata, T. Tokunaga, T. Samejima, S.
Amano, S. Tanaka, Y. Hirohara, T. Mihashi, N. Maeda
and T. Fujikado, “Higher Order Wavefront Aberrations of
Cornea and Magnitude of Refractive Correction in Laser
in Situ Keratomileusis,” Ophtalmology, Vol. 109, No. 6,
2002, pp. 1154-1158.
http://dx.doi.org/10.1016/S0161-6420(02)01028-X
[7] D. Huang, M. Tang and R. Shekhar, “Mathematical Model
of Cornea Surface Smoothing After Laser Refractive
Surgery,” American Journal of Ophthalmology, Vol. 135,
No. 3, 2003, pp. 267-278.
http://dx.doi.org/10.1016/S0002-9394(02)01942-6
[8] J. A. Nelder and R. Mead, “A Simplex Method for Func-
tion Minimization,” Computer Journal, Vol. 7, No. 4,
1965, pp. 308-313.
http://dx.doi.org/10.1093/comjnl/7.4.308
[9] W. H. Press, S. A. Teukolsky, W. T. Vettering and B. P.
Flannery, “Numerical Recipes in C++,” Cambridge Uni-
versity Press, London, 2002.
[10] J. Porter, S. MacRae, G. Yoon, C. Roberts, I. Cox and D.
Williams, “Separate Effects of the Microkeratome Inci-
sion and Laser Ablation on the Eye’s Wave Aberration,”
American Journal of Ophthalmology, Vol. 136, No. 2,
2003, pp. 327-337.
http://dx.doi.org/10.1016/S0002-9394(03)00222-8
[11] I. G. Pallikaris, G. D. Kymionis, S. I. Panagopoulou, C. S.
Siganos, M. A. Theodorakis and A. I. Pallikaris, “Induced
Optical Aberrations Following Formation of a Laser in
Situ Keratomileusis Flap,” Journal of Cataract & Refrac-
tive Surgery, Vol. 28, No. 10, 2002, pp. 1737-1741.
http://dx.doi.org/10.1016/S0886-3350(02)01507-9
[12] D. S. Durrie and G. M. Kezirian, “Femtosecond Laser
versus Mechanical Keratome Flaps in Wavefront-Guided
in Situ Keratomileusis: Prospective Contralateral Eye Stu-
dy,” Journal of Cataract & Refractive Surgery, Vol. 31,
No. 1, 2005, pp. 120-126.
http://dx.doi.org/10.1016/j.jcrs.2004.09.046
[13] D. B. Tran, M. A. Sarayba, Z. Bor, C. Garufis, Y. J. Duh,
C. R. Soltes, T. Juhasz and R. M. Kurtz, “Randomized
Open Access AM