 American Journal of Analytical Chemistry, 2013, 4, 696-706 Published Online December 2013 (http://www.scirp.org/journal/ajac) http://dx.doi.org/10.4236/ajac.2013.412084 Open Access AJAC Use of Neutron Activation Analysis and Inductively Coupled Plasma Mass Spectrometry for the Determination of Trace Elements in Pediatric and Young Adult Prostate Vladimir Zaichick1*, Sofia Zaichick1,2 1Radionuclide Diagnostics Department, Medical Radiological Research Centre, Obninsk, Russia 2Department of Immunology and Microbiology, Northwestern University, Chicago, USA Email: *vzaichick@gmail.com, s-zaichick@northwestern.edu Received September 30, 2013; revised October 28, 2013; accepted November 14, 2013 Copyright © 2013 Vladimir Zaichick, Sofia Zaichick. This is an open access article distributed under the Creative Commons Attribu- tion License, which permits unrestricted use, distribution, and reproduction in any medium, provided the original work is properly cited. ABSTRACT The questions about the androgen control and the involvement of trace elements in prostatic reproductive function still remain unanswered. One valuable way to elucidate the situation is to compare the values for the prostatic mass fractions of trace elements in pre- and post-pubertal boys. The effect of age on the mass fraction of 54 trace elements in intact prostate of 50 apparently healthy 0 - 30 years old males was investigated by neutron activation analysis and inductively coupled plasma mass spectrometry. Mean values (M ± SΕΜ) for mass fraction (milligram per kilogram, on dry-weight basis) of trace elements were: Ag 0.062 ± 0.008, Al 80 ± 18, Au 0.0092 ± 0.0024, B 5.9 ± 3.5, Be 0.0034 ± 0.0009, Bi 0.018 ± 0.010, Br 26 ± 3, Cd 0.26 ± 0.05, Ce 0.049 ± 0.012, Co 0.035 ± 0.004, Cr 0.49 ± 0.07, Cs 0.036 ± 0.005, Dy 0.0072 ± 0.0018, Er 0.0040 ± 0.0011, Fe 100 ± 10, Gd 0.0065 ± 0.0018, Hg 0.031 ± 0.004, Ho 0.0013 ± 0.0004, La 0.034 ± 0.007, Li 0.064 ± 0.009, Mn 1.69 ± 0.15, Mo 0.54 ± 0.13, Nb 0.013 ± 0.004, Nd 0.025 ± 0.006, Ni 4.1 ± 0.6, Pb 1.3 ± 0.2, Pr 0.0058 ± 0.0015, Rb 14.5 ± 0.8, Sb 0.051 ± 0.006, Sc 0.013 ± 0.002, Se 0.54 ± 0.03, Sm 0.0055 ± 0.0015, Sn 0.22 ± 0.05, Tb 0.0012 ± 0.0004, Th 0.0076 ± 0.0020, Ti 2.8 ± 0.5, Tl 0.0032 ± 0.0009, Tm 0.00064 ± 0.00017, U 0.0025 ± 0.0004, Y 0.036 ± 0.010, Yb 0.0037 ± 0.0012, Zn 281 ± 32, and Zr 0.16 ± 0.04. The upper limit of mean mass fraction of As, Eu, Ga, Hf, Ir, Lu, Pd, Pt, Re, and Ta were: As ≤ 0.069, Eu ≤ 0.0012, Ga ≤ 0.071, Hf ≤ 0.049, Ir ≤ 0.00054, Lu ≤ 0.00063, Pd ≤ 0.014, Pt ≤ 0.0029, Re ≤ 0.0048, and Ta ≤ 0.010. This work revealed that there is a signifi- cant tendency for the mass fractions of Cd, Se and Zn in the prostate tissue of healthy individuals to increase with age from the time of birth up to 30 years. It was also shown that high levels of Al, Au, B, Br, Cr, Ga, Li, and Ni mass frac- tion in prostate tissue do not indicate a direct involvement of these elements in the reproductive function of prostate. Keywords: NAA; ICP-MS; Trace Elements; Pediatric and Young Adult Prostate Glands 1. Introduction The prostate gland is a vital part of the male reproductive system. It produces and excretes much of the liquid por- tion of semen (about 30% - 35% of the semen ejaculate). The prostate mixes its fluids with those from the seminal vesicles to transport the sperm made in the testes. The prostate of the adult male is known to accumulate high levels of some trace elements, including Zn [1]. The reason for the unusually high trace element content in normal prostate gland is not completely understood. The findings of low Zn level in pediatric prostate warranted the conclusion that androgens are the major factors con- trolling the accumulation and maintenance of a high con- tent of Zn in the prostate [2-5]. In our previous studies, the high mass fractions of Zn as well as some other trace elements were observed in prostate tissue of adult males when compared with those in nonprostatic soft tissues of the human body [1,5-8]. However, some questions about the androgen control and the involvement of trace elements in prostatic reproduc- tive function still remain unanswered. One valuable way to elucidate the situation is to compare the values for the prostatic mass fractions of trace elements in pre-pubertal boys with those during early puberty, post-puberty and *Corresponding author.  V. ZAICHICK, S. ZAICHICK 697 young adulthood. The data on trace element mass fractions in pediatric prostate are apparently extremely limited [2,3]. There are few studies regarding trace element content in prostate of young adult males, using chemical techniques and in- strumental methods [2,3,9-15]. However, the majority of these data are based on measurements of processed tissue. In many studies tissue samples are ashed before analysis. In other cases, prostate samples are treated with solvents (distilled water, ethanol etc) and then are dried at high temperature for many hours. There is evidence that cer- tain quantities of trace elements are lost as a result of such treatment [16,17]. Moreover, only two of these studies employed quality control using certified reference materials (CRM) for determination of the trace element mass fractions [14,15]. The primary purpose of this study was to investigate the possibilities of a non-destructive instrumental neutron activation analysis with high resolution spectrometry of long-lived radionuclides (NAA-LLR) and inductively coupled plasma mass spectrometry (ICP-MS) in the es- timation of trace element contents in the samples of prostate tissue. The second aim was to determine refer- ence values for trace element mass fractions in the intact prostate of subjects of different age groups from newborn to young adult males. The third aim was to evaluate the quality of the results making a comparison between NAA- LLR and ICP-MS data obtained. The final aim was to compare the trace element mass fractions in pre-pubertal boys (group 1) with those during early puberty, post- puberty and young adulthood (group 2). All studies were approved by the Ethical Committee of the Medical Radiological Research Center, Obninsk. 2. Materials and Methods 2.1. Samples Samples of the human prostate were obtained from ran- domly selected autopsy specimens of 50 males (European- Caucasian) aged 0 day to 30 years. Age ranges for sub- jects were divided into two groups, with group 1, 0 - 13 years (3.3 ± 0.09 years, M ± SEM, n = 29), and group 2, 14 - 30 years (24.4 ± 1.0 years, M ± SEM, n = 21). These age groups were selected to reflect the situation before puberty (group 1—infant, childhood, and peripubertal periods) and during and after puberty (group 2—adolescent and young adult periods). The available clinical data were reviewed for each subject. None of the subjects had a history of an intersex condition, endocrine disorder, neoplasm or other chronic disease that would affect the normal development of the prostate. None of the subjects was receiving medications known to affect prostate mor- phology and prostatic chemical element content. The typical causes of death in most of these patients included sudden infant death syndrome, acute pulmonary etiolo- gies, and trauma. All prostate glands were divided (with an anterior-posterior cross-section) into two portions us- ing a titanium scalpel. One tissue portion was reviewed by an anatomical pathologist while the other was used for the trace element content determination. Only the poste- rior part of the prostate, including the transitional, central, and peripheral zones, was investigated. A histological examination was used to control the age norm confor- mity as well as the absence of any microadenomatosis and/or latent cancer. 2.2. Sample Preparation After the samples intended for trace element analysis were weighed, they were transferred to −20˚C and stored until the day of transportation in the Medical Radiologi- cal Research Center (MRRC), Obninsk. In the MRRC all samples were freeze-dried and homogenized. The pounded sample weighing about 50 mg was used for chemical element measurement by instrumental NAA-LLR. The samples for NAA-LLR were wrapped separately in a high-purity aluminum foil washed with rectified alcohol beforehand and placed in a nitric acid-washed quartz ampoule. The samples weighing about 100 mg for ICP-MS were decomposed in autoclaves; 1.5 mL of concentrated HNO3 (nitric acid at 65%, maximum (max) of 0.0000005% Hg; GR, ISO, Merck) and 0.3 mL of H2O2 (pure for analysis) were added to prostate tissue samples, placed in one- chamber autoclaves (Ancon-AT2, Ltd., Russia) and then heated for 3 h at 160˚C - 200˚C. After autoclaving, they were cooled to room temperature and solutions from the decomposed samples were diluted with deionized water (up to 20 mL) and transferred to plastic measuring bottles. Simultaneously, the same procedure was performed in autoclaves without tissue samples (only HNO3 + H2O2 + deionized water), and the resultant solutions were used as control samples. 2.3. Instrumentation and Methods 2.3.1. NAA-LLR Method A vertical channel of nuclear reactor was applied to de- termine the mass fractions of Ag, As, Au, Ba, Br, Cd, Ce, Co, Cr, Cs, Eu, Fe, Gd, Hf, Hg, La, Lu, Nd, Rb, Sb, Sc, Se, Sm, Sr, Ta, Tb, Th, U, Yb, Zn, and Zr by NAA-LLR. The quartz ampoule with prostate samples, standards, and certified reference materials was soldered, positioned in a transport aluminum container and exposed to a 24- hour neutron irradiation in a vertical channel with a neu- tron flux of 1.3 × 10¹³ ncm−2s−1. Ten days after irradia- tion samples were reweighed and repacked. The samples were measured for period from 10 to 30 days after irradiation. The duration of measurements was Open Access AJAC  V. ZAICHICK, S. ZAICHICK 698 from 20 min to 10 hours subject to pulse counting rate. The gamma spectrometer included the 100 cm3 Ge (Li) detector and on-line computer-based MCA system. The spectrometer provided a resolution of 1.9 keV on the 60Co 1332 keV line. The information of used radionu- clides, gamma-energies, and other details of the analysis is presented in Table 1. 2.3.2. ICP-MS Method Sample aliquots were used to determine the content of Ag, Al, As, Au, B, Be, Bi, Br, Cd, Ce, Co, Cr, Cs, Dy, Er, Eu, Ga, Gd, Hf, Hg, Ho, Ir, La, Li, Lu, Mn, Mo, Nb, Nd, Ni, Pb, Pd, Pr, Pt, Rb, Re, Sb, Se, Sm, Sn, Ta, Tb, Te, Th, Ti, Tl, Tm, U, Y, Yb, Zn, and Zr by ICP-MS using an ICP-MS Thermo-Fisher “X-7” Spectrometer (Thermo Electron, USA). The measurements were made with the mass-spectrometer parameters shown in Table 2. Table 1. Radionuclides, some of their characteristics and conditions of analysis* used for INAA-LLR prostate sam- ples and certified reference materials. Element Radionuclide Half-life -energy used (keV) Ag 110mAg 250.0 days 658, 1384 As 76As 1.12 days 559 Au 198Au 2.7 days 412 Ba 131Ba 11.52 days 216, 373, 496 Br 82Br 1.47 days 698, 777, 1044 Cd 115Cd 2.2 days 336 Ce 141Ce 32.5 days 145 Co 60Co 5.64 years 1173, 1332 Cr 51Cr 27.8 days 320 Cs 134Cs 2.05 years 796 Eu 152Eu 13.6 years 1408 Fe 59Fe 45.6 days 1099, 1292 Gd 151Gd 120 days 154 Hf 181Hf 42.4 days 482 Hg 203Hg 46.91 days 279 La 140La 1.68 days 329, 487, 816, 1595 Lu 177Lu 6.74 days 208 Nd 147Nd 11.02 days 91 Rb 86Rb 18.66 days 1076 Sb 122Sb and 124Sb 2.74 d and 60.9 days 564 and 1690 Sc 46Sc 83.89 days 889, 1121 Se 75Se 120.4 days 136, 265, 401 Sm 153Sm 1.96 days 103 Sr 85Sr 64.8 days 514 Ta 182Ta 115 days 1221 Tb 160Tb 72.3 days 879, 966 Th 233Pa 27.0 days 312 U 239Np 2.36 days 228, 278 Yb 175Yb 4.19 days 396 Zn 65Zn 245.7 days 1115 Zr 95Zr 35.0 days 724, 757 *Irradiation time—24 hours, decay—from 10 to 30 days, measurement— from 20 min to 10 hours, sample-detector distance—from 0 to 5 cm, detec- tor shielding—5 cm lead. The element concentrations in aqueous solutions were determined by the quantitative method using multi ele- mental calibration solutions ICP-MS-68A and ICP-AM- 6-A produced by High-Purity Standards (Charleston, SC 29423, USA). Indium was used as an internal standard in all measurements. The next isotope(s) was/were meas- ured and chosen for calculation, for each trace-element (see Table 3). If an element has several isotopes, the concentration of Li,, B, Ti, Ni, Zn, Br, Rb, Mo, Pd, Ag, Cd, Sn, Sb, Te, Nd, Sm, Eu, Gd, Dy, ER, Yb, Hf, Re, Ir, Pt, Hg, Tl, and Pb in a sample was calculated as the mean of the values measured for their different isotopes. The detection limit (DL) was calculated as: DL3 SD,Ci (1) Table 2. The ICP-MS spectrometer parameters and the main parameters of mass-spectrum measurements. Spectrometer parameters RF generator power 1250 W Nebulizer Polycon Spray chamber Cooled at 3˚C Plasma gas flow rate 12 L/min Auxiliary flow rate 0.9 L/min Nebuliser flow rate 0.9 L/min Sample update 0.8 mL/min Resolution 0.8 atomic mass unit Parameters of mass-spectrum measurements Detector mode Double (pulse counting and analogous) Scanning mode Survey scan and peak jumping Setting for survey scan Setting for peak jumping Number of runs 10 Sweeps 25 Dwell time 0.6 msDwell time 10 ms Channels per mass 10 Channels per mass 1 Acquisition duration 13.2 sAcquisition duration 34 s Table 3. The isotope(s) used for determining chemical ele- ment contents by ICP-MS. EIsotope(s)EIsotope(s)E Isotope(s) E Isotope(s) Li6, 7 Rb85 La 139 Lu175 Be9 Y89 Ce 140 Hf177, 178 B10, 11 Zr90, 91 Pr 141 Ta181 Al27 Nb93 Nd 145, 146 Re185, 187 Ti47, 50 Mo95, 98 Sm 147, 149 Ir191, 193 Mn55 Pd104, 105Eu 151, 153 Pt194, 195 Co59 Ag107, 109Gd 158, 160 Au197 Ni60, 62 Cd111, 112, 114Tb 159 Hg201, 202 Zn66, 68 In115 Dy 162, 163 Tl203, 205 Ga71 Sn118, 120Ho 165 Pb206, 208 As75 Sb121, 123Er 167, 168 Bi209 Se82 Te125, 126Tm 169 Th232 Br79, 81 Cs133 Yb 173, 174 U238 E: element. Open Access AJAC  V. ZAICHICK, S. ZAICHICK 699 where Ci is a mean value of the isotope content for measurements in control samples, and SD is a standard deviation of Ci determination in control samples. For elements with several isotopes, the DL corresponded to that of the most abundant isotope. The relative standard deviation (RSD) did not exceed 0.05 for elements with Ci > 5 DL and did not exceed 0.20 for elements with Ci < 5 DL. 2.4. Standards and Certified Reference Materials For quality control, ten subsamples of the certified refer- ence materials (CRM) IAEA H-4 Animal muscle and IAEA HH-1 Human hair from the International Atomic Energy Agency (IAEA), and also five sub-samples INCT- SBF-4 Soya Bean Flour, INCT-TL-1 Tea Leaves and INCT-MPH-2 Mixed Polish Herbs from the Institute of Nuclear Chemistry and Technology (INCT, Warszawa, Poland) were analyzed simultaneously with the investi- gated prostate tissue samples. All samples of CRM were treated in the same way as the prostate tissue samples. Detailed results of this quality assurance program were presented in earlier publications [1,7]. 2.5. Computer Programs and Statistic A dedicated computer program of NAA mode optimiza- tion was used [18]. Using the Microsoft Office Excel program to provide a summary of statistical results, the arithmetic mean, stan- dard deviation, standard error of mean, minimum and maximum values were calculated for all the trace ele- ment mass fractions obtained. For elements investigated by two methods the mean of all results was used. The reliability of difference in the results between two age groups was evaluated by Student’s parametric t-test. For the construction of “trace element mass fraction versus age” diagrams the Microsoft Office Excel program was also used. 3. Results and Discussion 3.1. The Possibilities of NAA-LLR 203Hg has the only line of 279.19 keV which coincides with the 279.54 keV (25%) line of 75Se. However, 75Se has more intensive lines 136 (56%) and 265 keV (60%) (See Table 1). Using the information about 75Se lines 136 keV and 265 keV, the intensity of 279.54 keV line was calculated and the interference with 203Hg 279.19 keV line was under control. Thus, the instrumental neutron activation analysis with high resolution spectrometry of long-lived radionuclides allowed determine the mass fractions of 10 chemical elements (Ag, Co, Cr, Fe, Hg, Rb, Sb, Sc, Se, and Zn) in the tissue samples of pediatric and nonhyperplastic young adult prostate glands. Mean values (M ± SΕΜ) for mass fraction (milligram per kilogram, on dry-weight basis) of chemical elements between ages 0 - 30 years were: Ag— 0.071 ± 0.009, Co—0.035 ± 0.004, Cr—0.47 ± 0.07, Fe—100 ± 10, Hg—0.026 ± 0.002, Rb—12.6 ± 0.8, Sb— 0.058 ± 0.007, Sc—0.013 ± 0.002, Se—0.48 ± 0.03, and Zn—273 ± 31. 3.2. The Possibilities of ICP-MS The inductively coupled plasma mass spectrometry al- lowed measurement the mass fractions or an upper limit of mass fractions of 51 chemical elements in the tissue samples of pediatric and nonhyperplastic young adult prostate glands. Mean values for mass fraction of 41 chemical elements between ages 0 - 30 years were: Ag— 0.052 ± 0.007, Al—79.7 ± 18.2, Au—0.0092 ± 0.0024, B—5.9 ± 3.5, Be—0.0034 ± 0.0009, Bi—0.018 ± 0.010, Br—26.3 ± 3.1, Cd—0.26 ± 0.05, Ce—0.049 ± 0.012, Co—0.036 ± 0.004, Cr—0.53 ± 0.08, Cs—0.036 ± 0.005, Dy—0.0072 ± 0.0018, Er—0.0040 ± 0.0011, Gd— 0.0065 ± 0.0018, Hg—0.034 ± 0.005, Ho—0.0013 ± 0.0004, La—0.034 ± 0.007, Li—0.064 ± 0.009, Mn— 1.69 ± 0.15, Mo—0.54 ± 0.13, Nb—0.013 ± 0.004, Nd— 0.025 ± 0.006, Ni—4.08 ± 0.56, Pb—1.30 ± 0.24, Pr— 0.0058 ± 0.0015, Rb—16.2 ± 0.8, Sb—0.044 ± 0.007, Se—0.59 ± 0.04, Sm—0.0055 ± 0.0015, Sn—0.22 ± 0.05, Tb—0.0012 ± 0.0004, Th—0.0076 ± 0.0020, Ti—2.79 ± 0.53, Tl—0.0032 ± 0.0009, Tm—0.00064 ± 0.00017, U—0.0025 ± 0.0004, Y—0.036 ± 0.010, Yb—0.0037 ± 0.0012, Zn—277 ± 33, and Zr—0.16 ± 0.04. The upper limits of mass fraction of 10 chemical elements in the same samples were: As ≤ 0.069, Eu ≤ 0.0012, Ga ≤ 0.071, Hf ≤ 0.049, Ir ≤ 0.00054, Lu ≤ 0.00063, Pd ≤ 0.014, Pt ≤ 0.0029, Re ≤ 0.0048, and Ta ≤ 0.010. 3.3. Precision and Accuracy The use of two analytical methods allowed us to estimate the mass fractions of 54 trace elements in human prostate tissue. Good agreement was found between the mean values of the Ag, As, Au, Br, Cd, Ce, Co, Cr, Cs, Eu, Gd, Hf, Hg, La, Lu, Nd, Rb, Sb, Se, Sm, Ta, Tb, Th, U, Yb, Zn, and Zr mass fractions determined by NAA-LLR and ICP-MS (Table 4) indicating complete digestion of the prostate tissue samples (for ICP-MS techniques) and correctness of all results obtained by the two methods. The fact that the elemental mass fractions (mean ± SD) of the certified reference materials obtained in the pre- sent work were in good agreement with the certified val- ues and within the corresponding 95% confidence inter- vals [1,7] suggests an acceptable accuracy of the meas- urements performed on in prostate tissue samples. Open Access AJAC 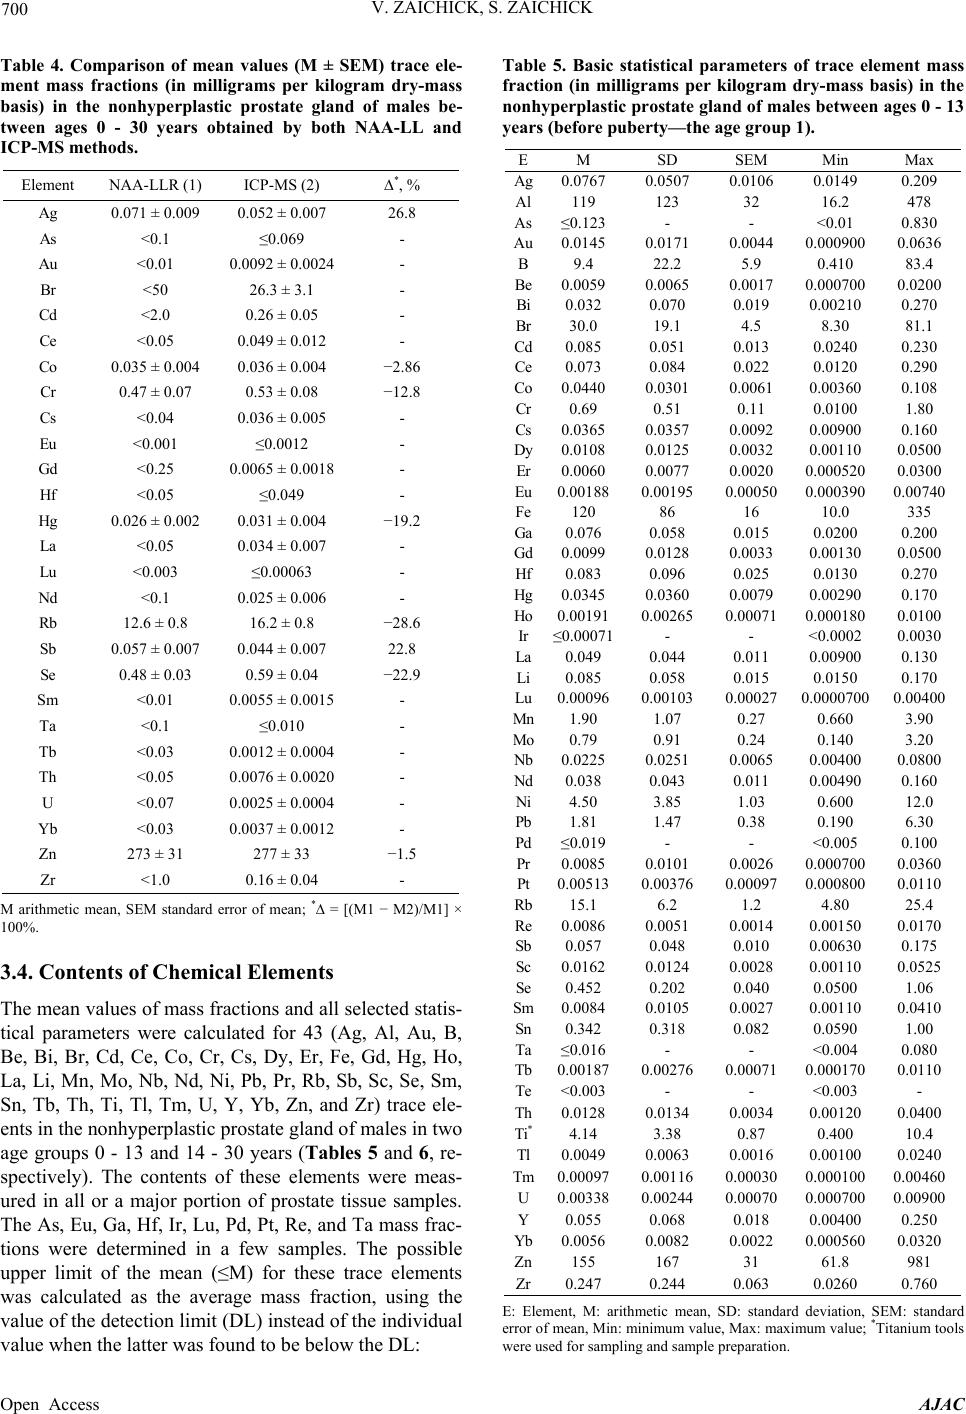 V. ZAICHICK, S. ZAICHICK 700 Table 4. Comparison of mean values (M ± SEM) trace ele- ment mass fractions (in milligrams per kilogram dry-mass basis) in the nonhyperplastic prostate gland of males be- tween ages 0 - 30 years obtained by both NAA-LL and ICP-MS methods. Element NAA-LLR (1) ICP-MS (2) ∆*, % Ag 0.071 ± 0.009 0.052 ± 0.007 26.8 As <0.1 ≤0.069 - Au <0.01 0.0092 ± 0.0024 - Br <50 26.3 ± 3.1 - Cd <2.0 0.26 ± 0.05 - Ce <0.05 0.049 ± 0.012 - Co 0.035 ± 0.004 0.036 ± 0.004 −2.86 Cr 0.47 ± 0.07 0.53 ± 0.08 −12.8 Cs <0.04 0.036 ± 0.005 - Eu <0.001 ≤0.0012 - Gd <0.25 0.0065 ± 0.0018 - Hf <0.05 ≤0.049 - Hg 0.026 ± 0.002 0.031 ± 0.004 −19.2 La <0.05 0.034 ± 0.007 - Lu <0.003 ≤0.00063 - Nd <0.1 0.025 ± 0.006 - Rb 12.6 ± 0.8 16.2 ± 0.8 −28.6 Sb 0.057 ± 0.007 0.044 ± 0.007 22.8 Se 0.48 ± 0.03 0.59 ± 0.04 −22.9 Sm <0.01 0.0055 ± 0.0015 - Ta <0.1 ≤0.010 - Tb <0.03 0.0012 ± 0.0004 - Th <0.05 0.0076 ± 0.0020 - U <0.07 0.0025 ± 0.0004 - Yb <0.03 0.0037 ± 0.0012 - Zn 273 ± 31 277 ± 33 −1.5 Zr <1.0 0.16 ± 0.04 - M arithmetic mean, SEM standard error of mean; *∆ = [(M1 − M2)/M1] × 100%. 3.4. Contents of Chemical Elements The mean values of mass fractions and all selected statis- tical parameters were calculated for 43 (Ag, Al, Au, B, Be, Bi, Br, Cd, Ce, Co, Cr, Cs, Dy, Er, Fe, Gd, Hg, Ho, La, Li, Mn, Mo, Nb, Nd, Ni, Pb, Pr, Rb, Sb, Sc, Se, Sm, Sn, Tb, Th, Ti, Tl, Tm, U, Y, Yb, Zn, and Zr) trace ele- ents in the nonhyperplastic prostate gland of males in two age groups 0 - 13 and 14 - 30 years (Tables 5 and 6, re- spectively). The contents of these elements were meas- ured in all or a major portion of prostate tissue samples. The As, Eu, Ga, Hf, Ir, Lu, Pd, Pt, Re, and Ta mass frac- tions were determined in a few samples. The possible upper limit of the mean (≤M) for these trace elements was calculated as the average mass fraction, using the value of the detection limit (DL) instead of the individual value when the latter was found to be below the DL: Table 5. Basic statistical parameters of trace element mass fraction (in milligrams per kilogram dry-mass basis) in the nonhyperplastic prostate gland of males between ages 0 - 13 years (before puberty—the age group 1). EM SD SEM Min Max Ag0.0767 0.0507 0.0106 0.0149 0.209 Al119 123 32 16.2 478 As ≤0.123 - - <0.01 0.830 Au0.0145 0.0171 0.0044 0.000900 0.0636 B9.4 22.2 5.9 0.410 83.4 Be0.0059 0.0065 0.0017 0.000700 0.0200 Bi0.032 0.070 0.019 0.00210 0.270 Br30.0 19.1 4.5 8.30 81.1 Cd0.085 0.051 0.013 0.0240 0.230 Ce0.073 0.084 0.022 0.0120 0.290 Co0.0440 0.0301 0.0061 0.00360 0.108 Cr0.69 0.51 0.11 0.0100 1.80 Cs0.0365 0.0357 0.0092 0.00900 0.160 Dy0.0108 0.0125 0.0032 0.00110 0.0500 Er0.0060 0.0077 0.0020 0.000520 0.0300 Eu0.00188 0.00195 0.00050 0.000390 0.00740 Fe120 86 16 10.0 335 Ga0.076 0.058 0.015 0.0200 0.200 Gd0.0099 0.0128 0.0033 0.00130 0.0500 Hf0.083 0.096 0.025 0.0130 0.270 Hg0.0345 0.0360 0.0079 0.00290 0.170 Ho0.00191 0.00265 0.00071 0.000180 0.0100 Ir ≤0.00071- - <0.0002 0.0030 La0.049 0.044 0.011 0.00900 0.130 Li0.085 0.058 0.015 0.0150 0.170 Lu0.00096 0.00103 0.00027 0.0000700 0.00400 Mn1.90 1.07 0.27 0.660 3.90 Mo0.79 0.91 0.24 0.140 3.20 Nb0.0225 0.0251 0.0065 0.00400 0.0800 Nd0.038 0.043 0.011 0.00490 0.160 Ni4.50 3.85 1.03 0.600 12.0 Pb1.81 1.47 0.38 0.190 6.30 Pd ≤0.019 - - <0.005 0.100 Pr0.0085 0.0101 0.0026 0.000700 0.0360 Pt0.00513 0.00376 0.00097 0.000800 0.0110 Rb15.1 6.2 1.2 4.80 25.4 Re0.0086 0.0051 0.0014 0.00150 0.0170 Sb0.057 0.048 0.010 0.00630 0.175 Sc0.0162 0.0124 0.0028 0.00110 0.0525 Se0.452 0.202 0.040 0.0500 1.06 Sm0.0084 0.0105 0.0027 0.00110 0.0410 Sn0.342 0.318 0.082 0.0590 1.00 Ta ≤0.016 - - <0.004 0.080 Tb0.00187 0.00276 0.00071 0.000170 0.0110 Te<0.003 - - <0.003 - Th0.0128 0.0134 0.0034 0.00120 0.0400 Ti*4.14 3.38 0.87 0.400 10.4 Tl0.0049 0.0063 0.0016 0.00100 0.0240 Tm0.00097 0.00116 0.00030 0.000100 0.00460 U0.00338 0.00244 0.00070 0.000700 0.00900 Y0.055 0.068 0.018 0.00400 0.250 Yb0.0056 0.0082 0.0022 0.000560 0.0320 Zn155 167 31 61.8 981 Zr0.247 0.244 0.063 0.0260 0.760 E: Element, M: arithmetic mean, SD: standard deviation, SEM: standard error of mean, Min: minimum value, Max: maximum value; *Titanium tools were used for sampling and sample preparation. Open Access AJAC  V. ZAICHICK, S. ZAICHICK 701 Table 6. Basic statistical parameters of trace element mass fraction (in milligrams per kilogram dry-mass basis) in the nonhyperplastic prostate gland of males between ages 14 - 30 years (puberty and postpuberty—the age group 2). E M SD SEM Min Max Ag 0.0421 0.0396 0.0096 0.00800 0.124 Al 37.8 28.5 7.6 6.80 115 As ≤0.012 - - <0.01 0.020 Au 0.0040 0.0043 0.0011 0.00100 0.0149 B 1.02 0.83 0.26 0.400 3.20 Be 0.00110 0.00051 0.00013 0.000700 0.00260 Bi 0.00404 0.00190 0.00053 0.00180 0.00750 Br 22.4 16.6 4.0 3.00 48.6 Cd 0.441 0.270 0.072 0.0800 1.00 Ce 0.0241 0.0217 0.0058 0.00600 0.0750 Co 0.0248 0.0091 0.0020 0.0135 0.0454 Cr 0.246 0.183 0.042 0.0470 0.687 Cs 0.0360 0.0111 0.0030 0.0240 0.0550 Dy 0.00326 0.00338 0.00090 0.000400 0.0120 Er 0.00186 0.00214 0.00057 0.000160 0.00710 Eu ≤0.00054 - - <0.0004 0.0015 Fe 72.3 26.0 5.8 38.0 127 Ga ≤0.066 - - <0.02 0.49 Gd 0.00284 0.00290 0.00078 0.000300 0.0100 Hf ≤0.013 - - <0.01 0.035 Hg 0.0283 0.0127 0.0028 0.0162 0.0713 Ho 0.00060 0.00065 0.00017 0.0000900 0.00210 Ir ≤0.00035 - - <0.0002 0.0010 La 0.0172 0.0116 0.0032 0.00800 0.0490 Li 0.0424 0.0259 0.0069 0.0150 0.0970 Lu ≤0.00028 - - <0.00007 0.0011 Mn 1.48 0.48 0.12 0.800 2.50 Mo 0.279 0.133 0.035 0.110 0.580 Nb 0.00329 0.00329 0.00088 0.00100 0.0110 Nd 0.0124 0.0107 0.0029 0.00400 0.0350 Ni 3.65 1.78 0.48 0.200 6.80 Pb 0.75 0.88 0.24 0.250 3.72 Pd ≤0.0072 - - <0.005) 0.010 Pr 0.00299 0.00279 0.00075 0.000700 0.00940 Pt ≤0.00054 - - <0.0005 0.0010 Rb 13.7 3.54 0.79 7.70 24.0 Re ≤0.00099 - - <0.0009 0.0010 Sb 0.0432 0.0231 0.0052 0.00900 0.0924 Sc 0.0087 0.0051 0.0012 0.00240 0.0207 Se 0.644 0.203 0.045 0.372 1.11 Sm 0.00246 0.00246 0.00066 0.000500 0.00790 Sn 0.096 0.095 0.025 0.0300 0.300 Ta ≤0.0044 - - <0.004 0.0090 Tb 0.00041 0.00057 0.00015 0.000070 0.00210 Te <0.003 - - <0.003) - Th 0.00210 0.00212 0.00057 0.000500 0.00850 Ti* 1.35 0.93 0.25 0.700 3.46 Tl 0.00140 0.00049 0.00013 0.000200 0.00240 Tm 0.000299 0.000345 0.000092 0.0000500 0.00120 U 0.00164 0.00106 0.00028 0.000540 0.00406 Y 0.0159 0.0199 0.0055 0.00200 0.0710 Yb 0.00175 0.00214 0.00057 0.000100 0.00690 Zn 456 188 41 155 869 Zr 0.055 0.073 0.020 0.0100 0.250 E: Element, M: arithmetic mean, SD: standard deviation, SEM: standard error of mean, Min: minimum value, Max: maximum value; *Titanium tools were used for sampling and sample preparation. i n ij i CDLn n , (2) where Ci is the individual value of the trace-element mass fraction in sample −i, ni is number of samples with mass fraction higher than the DL, nj is number of sam- ples with mass fraction lower than the DL, and n = ni + nj is number of samples that were investigated. Generally, the mass fractions of Te in prostate tissue samples were lower than the corresponding DL of ICP- MS (0.003 milligrams per kilogram on a dry mass basis). The level of Zn in prostate is much higher than con- tents of other trace element: around an order of magni- tude—Fe; two orders of magnitude—Rb; three orders of magnitude—Cr, and Se; four orders of magnitude—Ag, Co, Hg, Sb, and Sc. 3.5. Comparison with Published Data The means of Fe and Zn mass fractions obtained for prostate tissue of infant and children (age group 1) as shown in Table 5, agree well with range of mean values reported by Heinzsch et al. (1970) and Leissner et al. (1980) [2,3]. No published data referring to other trace element mass fractions in pediatric prostate glands were found. The obtained values for Ag, As, Cd, Cr, Cs, Fe, Mn, Mo, Ni, Pb, Rb, Se, Ti, Tl, and Zn mass fractions in young adult nonhyperplastic prostate glands as shown in Table 7, agree well with median or range of means cited by other researches for the normal prostate tissue of adult males, including samples received from persons who died from different diseases [14,15,19-34]. A number of values for chemical element mass fractions were not ex- pressed on a dry weight basis by the authors of the cited references. However, we calculated these values using published data for water—80% [35] and ash—1.0% on wet weight basis [11] contents in prostate of adult men. The means of Al, B, and Br are somewhat higher and of Bi and Sn are somewhat lower than the maximum and minimum mean value of previously reported data, respec- tively. The means of this work for Au, Hg, Sb, Te, U, and Y is from one to six orders of magnitude lower, than previously reported results. No published data referring to Be, Ce, Dy, Er, Eu, Ga, Gd, Hf, Ho, Ir, La, Li, Lu, Nb, Nd, Pd, Pr, Pt, Re, Sc, Sm, Ta, Tb, Th, Tm, Yb, and Zr mass fractions in prostate gland of adult men were found. 3.6. Age-Related Changes In the histologically normal prostates, we have observed a significant decrease in mass fraction of the Ag, Al, Au, B, Be, Ce, Co, Cr, Dy, Fe, Gd, La, Li Mo, Nb, Nd, Pb, Sc, Se, Sm, Sn, Th, Ti, Tl, Tm, U, and Zr with age from the time of birth up to 30 years, accompanied by an increase Open Access AJAC  V. ZAICHICK, S. ZAICHICK 702 Table 7. Median, minimum and maximum value of means of trace element mass fractions (in milligrams per kilogram dry-mass basis) in prostate tissue of adult males according to data from the literature in comparison with this work results (prostate gland of young adults, 20 - 30 years). Published data [Reference] This work E Median (na) Minimum M ± SD, (nb) Maximum M ± SD, (nb) M ± SD n = 16 Ag ≤0.1 (2) <0.05 (48) [19] 0.2 (7) [20] 0.06 ± 0.05 Al 27.7 (3) 13 ± 66 (50) [19] 47 (9) [21] 80 ± 98 As 0.045 (1) 0.05 (10) [22] 0.05 (10) [22] ≤0.069 Au ≤1.0 (2) <0.7 (48) [19] 1.3 (7) [20] 0.009 ± 0.013 B 1.2 (2) <0.47 (50) [19] 1.0 (1) [20] 5.9 ± 17.2 Be - - - 0.003 ± 0.005 Bi <0.09 (1) <0.09 (50) [19] <0.09 (50) [19] 0.018 ± 0.052 Br 14.5 (2) 12 ± 8 (4) [23] 17 (12) [24] 26 ± 18 Cd 0.79 (16) 0.06 (129) [15] 427 (55) [25] 0.26 ± 0.26 Ce - - - 0.049 ± 0.066 Co 0.55 (3) <0.09 (50) [19] 12 (9) [21] 0.035 ± 0.025 Cr 0.56 (3) 0.042 (50) [19] 1.4 (8) [20] 0.49 ± 0.45 Cs <0.47 (2) 0.06 (6) [26] 2.8 (12) [24] 0.036 ± 0.026 Dy - - - 0.008 ± 0.010 Er - - - 0.004 ± 0.006 Eu - - - ≤0.0012 Fe 150 (19) 5.71 (5) [27] 1040 (10) [28] 100 ± 71 Ga - - - ≤0.071 Gd - - - 0.007 ± 0.010 Hf - - - ≤0.049 Hg 0.65 (1) 0.7 (5) [22] 0.7 (5) [22] 0.031 ± 0.027 Ho - - - 0.001 ± 0.002 Ir - - - ≤0.00054 La - - - 0.034 ± 0.036 Li - - - 0.064 ± 0.049 Lu - - - ≤0.00063 Mn 1.0 (6) <0.47 (12) [24] 7.3 (4) [29] 1.69 ± 0.84 Mo 1.0 (2) <0.19 (50) [19] 1.8 (2) [20] 0.54 ± 0.70 Nb - - - 0.013 ± 0.020 Nd - - - 0.025 ± 0.034 Ni <0.47 (4) 0.14 (4) [30] 4.7 (12) [24] 4.1 ± 3.0 Pb 1.0 (11) 0.15 (41) [14] 8 (4) [29] 1.3 ± 1.3 Pd - - - ≤0.014 Pr - - - 0.006 ± 0.008 Pt - - - ≤0.0029 Rb 34.5(3) 4.7 (9) [21] 58 ± 33 (4) [29] 14.5 ± 5.2 Re - - - ≤0.0048 Sb 0.42 (1) 0.4 (10) [22] 0.4 (10) [22] 0.051 ± 0.038 Sc - - - 0.013 ± 0.010 Se 0.625 (7) 0.27 (129) [15] 1.5 (15) [31] 0.54 ± 0.22 Sm - - - 0.006 ± 0.008 Sn 3.3 (4) 0.66 (50) [19] 3.7 (7) [20] 0.22 ± 0.27 Ta - - - ≤0.010 Tb - - - 0.001 ± 0.002 Te 164 (1) 164 (2) [29] 164 (2) [29] <0.003 Th - - - 0.008 ± 0.011 Ti* 7.6 (3) <0.24 (50) [19] 26 (24) [30] 2.8 ± 2.9 Tl 0.25 (2) 0.0014 (1) [32] 0.5 (1) [20] 0.003 ± 0.005 Tm - - - 0.0006 ± 0.0009 U 0.4 (1) 0.4 (1) [33] 0.4 (1) [33] 0.0025 ± 0.0020 Y <80 (2) <3.3 (12) [24] 89 (12) [24] 0.036 ± 0.053 Yb - - - 0.0037 ± 0.0062 Zn 482 (48) 111 (-) [34] 2735 (10) [28] 281 ± 230 Zr - - - 0.16 ± 0.21 E: Element, M: arithmetic mean, SD: standard deviation, na: number of all references, nb: number of samples, -: no data; *Titanium tools were used for sampling and sample preparation. in mass fraction of Cd, Se and Zn (Table 8, Figure 1). In particular, a strongly pronounced (p ≤ 0.001) tendency of Table 8. Effect of age on mean values (M ± SEM) trace ele- ment mass fraction in pediatric and young adult nonhy- perplastic prostate glands. EGroup 1 0 - 13 year n = 29 Group 2 14 - 30 year n = 21 Student’s t-test p≤ Ratio Group 2 to group 1 Ag0.077 ± 0.0110.0421 ± 0.0096 0.020 0.549 Al119 ± 32 37.8 ± 7.6 0.024 0.318 As ≤0.123 ≤0.012 - - Au0.015 ± 0.0040.0040 ± 0.0011 0.030 0.276 B9.4 ± 5.9 1.02 ± 0.26 0.18 (NS) 0.109 Be0.005 ± 0.0020.0011 ± 0.0001 0.014 0.186 Bi0.032 ± 0.0190.0040 ± 0.0005 0.17 (NS) 0.126 Br30.0 ± 4.5 22.4 ± 4.0 0.22 (NS) 0.747 Cd0.085 ± 0.0130.441 ± 0.072 0.0003 5.20 Ce0.073 ± 0.0220.024 ± 0.006 0.045 0.330 Co0.0440 ± 0.00610.025 ± 0.002 0.006 0.564 Cr0.69 ± 0.11 0.246 ± 0.042 0.0006 0.357 Cs0.037 ± 0.0090.036 ± 0.003 0.96 (NS) 0.986 Dy0.011 ± 0.0030.0033 ± 0.0009 0.038 0.302 Er0.006 ± 0.0020.0019 ± 0.0006 0.064 (NS) 0.310 Eu0.0019 ± 0.0005≤0.00054 - ≤0.287 Fe120 ± 16 72.3 ± 5.8 0.0099 0.60 Ga0.076 ± 0.015≤0.066 - ≤0.868 Gd0.010 ± 0.0030.0028 ± 0.0008 0.050 0.287 Hf0.083 ± 0.025≤0.013 - ≤0.157 Hg0.035 ± 0.0080.028 ± 0.003 0.92 (NS) 0.820 Ho0.0019 ± 0.00070.0006 ± 0.0002 0.093 (NS) 0.314 Ir ≤0.00071 ≤0.00035 - - La0.049 ± 0.0110.017 ± 0.003 0.017 0.351 Li0.085 ± 0.0150.042 ± 0.007 0.022 0.499 Lu0.0010 ± 0.0003≤0.00028 - ≤0.292 Mn1.90 ± 0.27 1.48 ± 0.12 0.17 (NS) 0.779 Mo0.79 ± 0.24 0.279 ± 0.035 0.050 0.353 Nb0.0225 ± 0.00650.0033 ± 0.0009 0.010 0.146 Nd0.038 ± 0.0110.0124 ± 0.0029 0.043 0.326 Ni4.50 ± 1.03 3.65 ± 0.48 0.46 (NS) 0.811 Pb1.81 ± 0.38 0.75 ± 0.24 0.027 0.414 Pd ≤0.019 ≤0.0072 - - Pr0.0085 ± 0.00260.0030 ± 0.0007 0.061 (NS) 0.352 Pt0.0051 ± 0.0010≤0.00054 - ≤0.105 Rb15.1 ± 1.2 13.7 ± 0.79 0.33 (NS) 0.907 Re0.0086 ± 0.0014≤0.00099 - ≤0.115 Sb0.057 ± 0.0100.0432 ± 0.0052 0.22 (NS) 0.758 Sc0.0162 ± 0.00280.0087 ± 0.0012 0.020 0.537 Se0.452 ± 0.0400.644 ± 0.045 0.0027 1.42 Sm0.0084 ± 0.00270.0025 ± 0.0007 0.050 0.293 Sn0.342 ± 0.0820.096 ± 0.025 0.011 0.281 Ta ≤0.016 ≤0.0044 - - Tb0.0019 ± 0.00070.0004 ± 0.0001 0.063 (NS) 0.219 Te<0.003 <0.003 - - Th0.0128 ± 0.00340.0021 ± 0.0006 0.0083 0.164 Ti*4.14 ± 0.87 1.35 ± 0.25 0.0073 0.326 Tl0.0049 ± 0.00160.0014 ± 0.0001 0.050 0.286 Tm0.0010 ± 0.00030.0003 ± 0.0001 0.048 0.308 U0.0034 ± 0.00070.0016 ± 0.0003 0.037 0.485 Y0.055 ± 0.0180.0159 ± 0.0055 0.055 0.289 Yb0.0056 ± 0.00220.0018 ± 0.0006 0.11 (NS) 0.313 Zn155 ± 31 456 ± 41 0.000001 2.94 Zr0.247 ± 0.0630.055 ± 0.020 0.0097 0.223 E: Element, M: arithmetic mean, SEM: standard error of mean, NS: not sig- nificant. *Titanium tools were used for sampling and sample preparation. Open Access AJAC  V. ZAICHICK, S. ZAICHICK Open Access AJAC 703 Figure 1. Individual data sets for the Al, Cd, Co, Fe, Hg, Pb, Se, and Zn mass fraction in the nonhyperplastic prostate gland of males between ages 0 - 30 years and their trend lines with equations of best fit. age-related increase in Cd and Zn mass fraction was ob- served in prostate (Table 8). For example, in prostate of adolescent and young adult (group 2), Cd and Zn mass fraction was 5.2 and 2.9 times, respectively, greater than in prostate of children before puberty (group 1). An in- crease of Cd and Zn mass fraction in the prostate tissue with age from the time of birth up to 30 years is more ideally fitted by an exponential law than by a linear, polynomial, logarithmic or power law (Figure 1). An increase of Se mass fraction is more ideally fitted by a polynomial law (Figure 1). This work result for age-dependence of Fe and Zn mass fraction is in accordance with earlier findings [2,3]. For example, Heinzsch et al. [2] found that Zn mass frac- tion in normal prostate was higher after the age of 10 (age group 11 - 30 years) than before by approximately 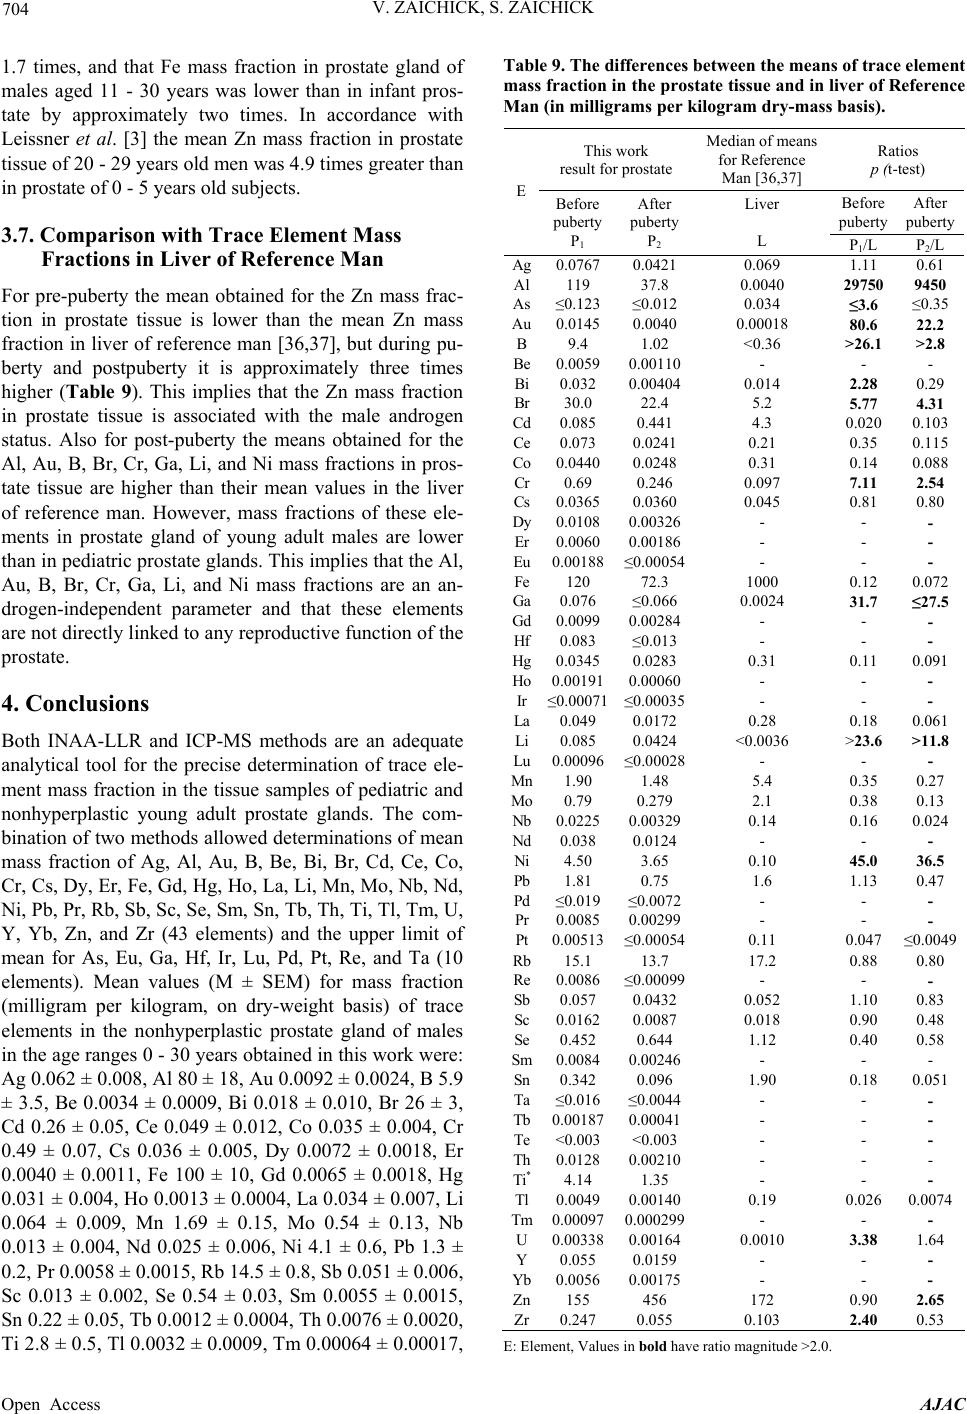 V. ZAICHICK, S. ZAICHICK 704 1.7 times, and that Fe mass fraction in prostate gland of males aged 11 - 30 years was lower than in infant pros- tate by approximately two times. In accordance with Leissner et al. [3] the mean Zn mass fraction in prostate tissue of 20 - 29 years old men was 4.9 times greater than in prostate of 0 - 5 years old subjects. 3.7. Comparison with Trace Element Mass Fractions in Liver of Reference Man For pre-puberty the mean obtained for the Zn mass frac- tion in prostate tissue is lower than the mean Zn mass fraction in liver of reference man [36,37], but during pu- berty and postpuberty it is approximately three times higher (Table 9). This implies that the Zn mass fraction in prostate tissue is associated with the male androgen status. Also for post-puberty the means obtained for the Al, Au, B, Br, Cr, Ga, Li, and Ni mass fractions in pros- tate tissue are higher than their mean values in the liver of reference man. However, mass fractions of these ele- ments in prostate gland of young adult males are lower than in pediatric prostate glands. This implies that the Al, Au, B, Br, Cr, Ga, Li, and Ni mass fractions are an an- drogen-independent parameter and that these elements are not directly linked to any reproductive function of the prostate. 4. Conclusions Both INAA-LLR and ICP-MS methods are an adequate analytical tool for the precise determination of trace ele- ment mass fraction in the tissue samples of pediatric and nonhyperplastic young adult prostate glands. The com- bination of two methods allowed determinations of mean mass fraction of Ag, Al, Au, B, Be, Bi, Br, Cd, Ce, Co, Cr, Cs, Dy, Er, Fe, Gd, Hg, Ho, La, Li, Mn, Mo, Nb, Nd, Ni, Pb, Pr, Rb, Sb, Sc, Se, Sm, Sn, Tb, Th, Ti, Tl, Tm, U, Y, Yb, Zn, and Zr (43 elements) and the upper limit of mean for As, Eu, Ga, Hf, Ir, Lu, Pd, Pt, Re, and Ta (10 elements). Mean values (M ± SΕΜ) for mass fraction (milligram per kilogram, on dry-weight basis) of trace elements in the nonhyperplastic prostate gland of males in the age ranges 0 - 30 years obtained in this work were: Ag 0.062 ± 0.008, Al 80 ± 18, Au 0.0092 ± 0.0024, B 5.9 ± 3.5, Be 0.0034 ± 0.0009, Bi 0.018 ± 0.010, Br 26 ± 3, Cd 0.26 ± 0.05, Ce 0.049 ± 0.012, Co 0.035 ± 0.004, Cr 0.49 ± 0.07, Cs 0.036 ± 0.005, Dy 0.0072 ± 0.0018, Er 0.0040 ± 0.0011, Fe 100 ± 10, Gd 0.0065 ± 0.0018, Hg 0.031 ± 0.004, Ho 0.0013 ± 0.0004, La 0.034 ± 0.007, Li 0.064 ± 0.009, Mn 1.69 ± 0.15, Mo 0.54 ± 0.13, Nb 0.013 ± 0.004, Nd 0.025 ± 0.006, Ni 4.1 ± 0.6, Pb 1.3 ± 0.2, Pr 0.0058 ± 0.0015, Rb 14.5 ± 0.8, Sb 0.051 ± 0.006, Sc 0.013 ± 0.002, Se 0.54 ± 0.03, Sm 0.0055 ± 0.0015, Sn 0.22 ± 0.05, Tb 0.0012 ± 0.0004, Th 0.0076 ± 0.0020, Ti 2.8 ± 0.5, Tl 0.0032 ± 0.0009, Tm 0.00064 ± 0.00017, Table 9. The differences between the means of trace element mass fraction in the prostate tissue and in liver of Reference Man (in milligrams per kilogram dry-mass basis). This work result for prostate Median of means for Reference Man [36,37] Ratios p (t-test) Before puberty After puberty EBefore puberty P1 After puberty P2 Liver L P1/L P2/L Ag0.0767 0.0421 0.069 1.11 0.61 Al119 37.8 0.0040 297509450 As ≤0.123 ≤0.012 0.034 ≤3.6 ≤0.35 Au0.0145 0.0040 0.00018 80.6 22.2 B9.4 1.02 <0.36 >26.1>2.8 Be0.0059 0.00110- - - Bi0.032 0.004040.014 2.28 0.29 Br30.0 22.4 5.2 5.77 4.31 Cd0.085 0.441 4.3 0.0200.103 Ce0.073 0.0241 0.21 0.35 0.115 Co0.0440 0.0248 0.31 0.14 0.088 Cr0.69 0.246 0.097 7.11 2.54 Cs0.0365 0.0360 0.045 0.81 0.80 Dy0.0108 0.00326- - - Er0.0060 0.00186- - - Eu0.00188 ≤0.00054- - - Fe120 72.3 1000 0.12 0.072 Ga0.076 ≤0.066 0.0024 31.7 ≤27.5 Gd0.0099 0.00284- - - Hf0.083 ≤0.013 - - - Hg0.0345 0.0283 0.31 0.11 0.091 Ho0.001910.00060- - - Ir ≤0.00071 ≤0.00035- - - La0.049 0.0172 0.28 0.18 0.061 Li0.085 0.0424 <0.0036 >23.6 >11.8 Lu0.00096 ≤0.00028- - - Mn1.90 1.48 5.4 0.35 0.27 Mo0.79 0.279 2.1 0.38 0.13 Nb0.0225 0.003290.14 0.16 0.024 Nd0.038 0.0124 - - - Ni4.50 3.65 0.10 45.0 36.5 Pb1.81 0.75 1.6 1.13 0.47 Pd ≤0.019 ≤0.0072- - - Pr0.0085 0.00299- - - Pt0.00513 ≤0.000540.11 0.047≤0.0049 Rb15.1 13.7 17.2 0.88 0.80 Re0.0086 ≤0.00099- - - Sb0.057 0.0432 0.052 1.10 0.83 Sc0.0162 0.0087 0.018 0.90 0.48 Se0.452 0.644 1.12 0.40 0.58 Sm0.0084 0.00246- - - Sn0.342 0.096 1.90 0.18 0.051 Ta ≤0.016 ≤0.0044- - - Tb0.001870.00041- - - Te<0.003 <0.003 - - - Th0.0128 0.00210- - - Ti*4.14 1.35 - - - Tl0.0049 0.001400.19 0.0260.0074 Tm0.000970.000299- - - U0.003380.001640.0010 3.38 1.64 Y0.055 0.0159 - - - Yb0.0056 0.00175- - - Zn155 456 172 0.90 2.65 Zr0.247 0.055 0.103 2.40 0.53 E: Element, Values in bold have ratio magnitude >2.0. Open Access AJAC  V. ZAICHICK, S. ZAICHICK 705 U 0.0025 ± 0.0004, Y 0.036 ± 0.010, Yb 0.0037 ± 0.0012, Zn 281 ± 32, and Zr 0.16 ± 0.04. The upper limit of mean mass fraction of As, Eu, Ga, Hf, Ir, Lu, Pd, Pt, Re, and Ta were: As ≤ 0.069, Eu ≤ 0.0012, Ga ≤ 0.071, Hf ≤ 0.049, Ir ≤ 0.00054, Lu ≤ 0.00063, Pd ≤ 0.014, Pt ≤ 0.0029, Re ≤ 0.0048, and Ta ≤ 0.010. In all prostate sam- ples, the content of Te was under the detection limit (<0.003). This work result reveals that there is a significant ten- dency of increase in Cd, Se and Zn mass fraction in the prostate tissue of healthy individuals with age from the time of birth up to 30 years. It means that Cd, Se and Zn mass fractions in prostate tissue are the androgen-de- pendent parameters. Our finding of positive correlation between the prostatic Zn and Se mass fractions indicates that there is a special relationship of Zn with Se-con- taining compounds in the prostate. It was also shown that high levels of Al, Au, B, Br, Cr, Ga, Li, and Ni mass fraction in prostate tissue do not indicate a direct in- volvement of these elements in the reproductive function of prostate. All the deceased were citizens of Moscow. None of those who died a sudden death had suffered from any systematic or chronic disorders before. The normal state of prostates was confirmed by morphological study. Thus, our data for mass fractions of 54 trace element mass frac- tions in intact prostate of two groups reflect the infant, childhood, and peripubertal periods (group 1) and adole- scent and young adult periods (group 2) may serve as indicative normal values for urban population of the Russian Central European region. 5. Acknowledgements The authors are grateful to the late Prof. A.A. Zhavoron- kov, Institute of Human Morphology, Russian Academy of Medical Sciences, Moscow, for supplying prostate specimens. We are also grateful to Dr. Karandaschev V., Dr. Nosenko S., and Moskvina I., Institute of Microelec- tronics Technology and High Purity Materials, Cher- nogolovka, Russia, for their help in ICP-MS analysis. REFERENCES [1] S. Zaichick, V. Zaichick, S. Nosenko and I. Moskvina, “Mass Fractions of 52 Trace Elements and Zinc Trace Element Content Ratios in Intact Human Prostates In- vestigated by Inductively Coupled Plasma Mass Spectro- metry,” Biological Trace Element Research, Vol. 149, No. 2, 2012, pp. 171-183. http://dx.doi.org/10.1007/s12011-012-9427-4 [2] E. Hienzsch, H.-J. Schneider and M. Anke, “Verglei- chende Untersuchungen zum Mengen- und Spurenele- mentgehalt der Normalen Prostata, des Prostataadenoms und des Prostatakarzinoms,” Zeitschrift für Urologie und Nephrologie, Vol. 63, No. 7, 1970, pp. 543-546. [3] K. M. Leissner, B. Fielkegard and L.-E. Tisell, “Concen- tration and Content of Zinc in Human Prostate,” Investi- gative Urology, Vol. 18, No. 1, 1980, pp. 32-35. [4] V. Zaichick, “INAA and EDXRF Applications in the Age Dynamics Assessment of Zn Content and Distribution in the Normal Human Prostate,” Journal of Radioanalytical and Nuclear Chemistry, Vol. 262, No. 1, 2004, pp. 229- 234. http://dx.doi.org/10.1023/B:JRNC.0000040879.45030.4f [5] S. Zaichick and V. Zaichick, “Relations of Morphometric Parameters to Zinc Content in Paediatric and Nonhy- perplastic Young Adult Prostate Glands,” Andrology, Vol. 1, No. 1, 2013, pp. 139-146. http://dx.doi.org/10.1111/j.2047-2927.2012.00005.x [6] S. Zaichick and V. Zaichick, “INAA Application in the Age Dynamics Assessment of Br, Ca, Cl, K, Mg, Mn, and Na Content in the Normal Human Prostate,” Journal of Radioanalytical and Nuclear Chemistry, Vol. 288, No. 1, 2011, pp. 197-202. http://dx.doi.org/10.1007/s10967-010-0927-4 [7] S. Zaichick and V. Zaichick, “The Effect of Age on Ag, Co, Cr, Fe, Hg, Sb, Sc, Se, and Zn Contents in Intact Human Prostate Investigated by Neutron Activation Ana- lysis,” Applied Radiation and Isotopes, Vol. 69, No. 6, 2011, pp. 827-833. http://dx.doi.org/10.1016/j.apradiso.2011.02.010 [8] V. Zaichick, S, Nosenko and I. Moskvina, “The Effect of Age on 12 Chemical Element Contents in Intact Prostate of Adult Men Investigated by Inductively Coupled Plas- ma Atomic Emission Spectrometry,” Biological Trace Element Research, Vol. 147, No. 1, 2012, pp. 49-58. http://dx.doi.org/10.1007/s12011-011-9294-4 [9] L.-E. Tisell, B. Fjelkegard and K. H. Leissner, “Zinc Con- centration and Content of the Dorsal, Lateral and Medial Prostatic Lobes and of Periurethral Adenomas in Man,” Journal of Urology, Vol. 128, No. 2, 1982, pp. 403-405. [10] A. Feustel and R. Wennrich, “Zinc and Cadmium in Cell Fractions of Prostatic Cancer Tissue of Different Histo- logical Grading in Comparison to BPH and Normal Pros- tate,” Urological Research, Vol. 12, No. 2, 1984, pp. 147- 150. http://dx.doi.org/10.1007/BF00257182 [11] B. E. Saltzman, S. B. Gross, D. W. Yeager, B. G. Meiners and P. S. Gartside, “Total Body Burdens and Tissue Con- centrations of Lead, Cadmium, Copper, Zinc, and Ash in 55 Human Cadavers,” Environmental Research, Vol. 52, No. 2, 1990, pp. 126-145. http://dx.doi.org/10.1016/S0013-9351(05)80248-8 [12] L. Picurelli, P. V. Olcina, M. D. Roig and J. Ferrer, “De- termination of Fe, Mg, Cu, and Zn in Normal and Patho- logical Prostatic Tissue,” Actas Urologicas Españolas, Vol. 15, No. 4, 1991, pp. 344-350. [13] L. Picurelli, P. V. Olcina, M. D. Roig, S. Günthner and J. Ferrer, “Determination and Relationship of the Copper and Zinc Concentrations in Normal and Pathologic Pros- tatic Tissue,” Trace Elements in Medicine, Vol. 8, No. 3, 1991, pp. 131-137. [14] N. B. Oldereid, Y. Thomassen, A. Attramadal, B. Olaisen and K. Purvis, “Concentrations of Lead, Cadmium and Zinc in the Tissues of Reproductive Organs of Men,” Open Access AJAC  V. ZAICHICK, S. ZAICHICK Open Access AJAC 706 Journal of Reproduction and Fertility, Vol. 99, No. 2, 1993, pp. 421-425. http://dx.doi.org/10.1530/jrf.0.0990421 [15] J. Schöpfer, G. Drasch and G. N. Schrauzer, “Selenium and Cadmium Levels and Ratios in Prostates, Livers, and Kidneys of Nonsmokers and Smokers,” Biological Trace Element Research, Vol. 134, No. 2, 2010, pp. 180-187. http://dx.doi.org/10.1007/s12011-010-8636-y [16] V. Zaichick, “Sampling, Sample Storage and Preparation of Biomaterials for INAA in Clinical Medicine, Occupa- tional and Environmental Health,” In: Harmonization of health-Related Environmental Measurements Using Nu- clear and Isotopic Techniques, IAEA, Vienna, 1997, pp. 123-133. [17] V. Zaichick, “Losses of Chemical Elements in Biological Samples under the Dry Ashing Process,” Trace Elements in Medicine (Moscow), Vol. 5, No. 3, 2004, pp. 17-22. [18] A. M. Korelo and V. Zaichick, “Software to Optimize the Multielement INAA of Medical and Environmental Sam- ples,” In: Activation Analysis in Environment Protection, Join Institute of Nuclear Research, Dubna, 1993, pp. 326- 332. [19] I. H. Tipton and M. J. Cook, “Trace Elements in Human Tissue. Part II. Adult Subjects from the United States,” Health Physics, Vol. 9, No. 2, 1963, pp. 103-145. http://dx.doi.org/10.1097/00004032-196302000-00002 [20] J. H. Tipton, R. L. Steiner, W. D. Foland, J. Mueller and M. Stanley, USAEC-ORNL-Report-CF-54-12-66, 1954. [21] S. R. Stitch, “Trace Elements in Human Tissue. I. A Semi-Quantitative Spectrographic Survey,” Biochemical Journal, Vol. 67, No. 1, 1957, pp. 97-103. [22] K. Liebscher and H. Smith, “Essential and Nonessential Trace Elements. A Method of Determining Whether an Element Is Essential or Nonessential in Human Tissue,” Archives of Environmental Health, Vol. 17, No. 6, 1968, pp. 882-891. http://dx.doi.org/10.1080/00039896.1968.10665346 [23] H. Kubo, S. Hashimoto, A. Ishibashi, R. Chiba and H. Yokota, “Simultaneous Determinations of Fe, Cu, Zn, and Br Concentrations in Human Tissue Sections,” Medical Physics, Vol. 3, No. 4, 1976, pp. 204-209. http://dx.doi.org/10.1118/1.594233 [24] A. Forssen, “Inorganic Elements in the Human Body. I. Occurrence of Ba, Br, Ca, Cd, Cs, Cu, K, Mn, Ni, Sn, Sr, Y and Zn in the Human Body,” Annales Medicinae Ex- perimentalis et Biologie (Finland), Vol. 50, No. 3, 1972, pp. 99-162. [25] J. O. Ogunlewe and D. N. Osegbe, “Zinc and Cadmium Concentrations in Indigenous Blacks with Normal, Hy- pertrophic, and Malignant Prostate,” Cancer, Vol. 63, No. 7, 1989, pp. 1388-1392. http://dx.doi.org/10.1002/1097-0142(19890401)63:7<138 8::AID-CNCR2820630725>3.0.CO;2-M [26] N. Yamagata, “The Concentration of Common Cesium and Rubidium in Human Body,” Journal of Radiation Research, Vol. 3, No. 1, 1962, pp. 9-30. http://dx.doi.org/10.1269/jrr.3.9 [27] H. Sangen, “The Influence of the Trace Metals upon the Aconitase Activity in Human Prostate Glands,” Japanese Journal of Urology, Vol. 58, No. 11, 1967, pp. 1146- 1159. [28] A. Jafa, N. M. Mahendra, A. R. Chowdhury and V. P. Kamboj, “Trace Elements in Prostatic Tissue and Plasma in Prostatic Diseases of Man,” Indian Journal of Cancer, Vol. 17, No. 1, 1980, pp. 34-37. [29] S. D. Soman, K. T. Joseph, S. J. Raut, G. D. Mulay, M. Parameswaran and V. K. Pandey, “Studies of Major and Trace Element Content in Human Tissues,” Health Phys- ics, Vol. 19, No. 5, 1970, pp. 641-656. http://dx.doi.org/10.1097/00004032-197011000-00006 [30] H. J. Koch and E. R. Smith, “The Determination of Cop- per and Zinc in Normal and Pathologic Human Thyroid Tissue,” Journal of Clinical Endocrinology, Vol. 16, No. 1, 1956, pp. 123-129. http://dx.doi.org/10.1210/jcem-16-1-123 [31] A. G. Sarafanov, T. I. Todorov, A. Kajdacsy-Balla, M. A. Gray, V. Macias and J. A. Centeno, “Analysis of Iron, Zinc, Selenium and Cadmium in Paraffin-Embedded Pro- state Tissue Specimens Using Inductively Coupled Plas- ma Mass-Spectrometry,” Journal of Trace Elements in Medicine and Biology, Vol. 22, No. 4, 2008, pp. 305-314. http://dx.doi.org/10.1016/j.jtemb.2008.03.010 [32] E. Weinig and P. Zink, “Über die Quantitative Massen- spektrometrische Bestimmung des Normalen Thallium- Geehalts Inmenschlichen Organismus,” Archive für Toxi- kologie, Vol. 22, No. 4, 1967, pp. 255-274. [33] B. Höffken and J. G. Rausch-Stroomann, “A Study of the Metabolism of Zinc Its Metalloenzymes in Diabetes Mel- litus,” Zeitschrift für Klinische Chemie und Klinische Biochemie, Vol. 7, No. 1, 1969, pp. 4-7. [34] L. R. Anspaugh, W. L. Robinson, W. H. Martin and O. A. Lowe, “Compilation of Published Information on Ele- mental Concentrations in Human Organs in Both Normal and Diseased States,” No. UCRL-51013Pt. 1971-1973. 1973, pp.1-4. [35] F. Györkey, K.-W. Min, J. A. Huff and P. Györkey, “Zinc and Magnesium in Human Prostate Gland: Normal, Hy- perplastic, and Neoplastic,” Cancer Research, Vol. 27, No. 8, 1967, pp. 1349-1353. [36] G. V. Iyengar, “Reevaluation of the Trace Element Con- tent in Reference Men,” Radiation Physics and Chemistry, Vol. 51, No. 4-6, 1998, pp. 545-560. http://dx.doi.org/10.1016/S0969-806X(97)00202-8 [37] G. V. Iyengar, W. E. Kollmer and H. G. M. Bowen, “The Elemental Composition of Human Tissues and Body Fluids. A Compilation of Values for Adults,” Verlag Chemie, Weinheim, 1978.
|