 Neuroscience & Medicine, 2013, 4, 194-207 Published Online December 2013 (http://www.scirp.org/journal/nm) http://dx.doi.org/10.4236/nm.2013.44031 Open Access NM Kinetics of Norepinephrine- and Serotonin-Induced BDNF Release in Cultured Embryonic Hippocampal Neurons* Michael Chen, Amelia Russo-Neustadt Department of Biological Sciences, California State University, Los Angeles, USA. Email: mchen@calstatela.edu Received August 22nd, 2013; revised September 20th, 2013; accepted October 15th, 2013 Copyright © 2013 Michael Chen, Amelia Russo-Neustadt. This is an open access article distributed under the Creative Commons Attribution License, which permits unrestricted use, distribution, and reproduction in any medium, provided the original work is properly cited. ABSTRACT The primary neurotransmitters targeted by currently used antidepressants, such as duloxetine, venlafaxine and fluoxet- ine, are serotonin and norepinephrine, which also are released in significant amounts in the central nervous system in response to sympathetic nervous system activation. In cultured hippocampal neurons, we have previously shown that norepinephrine induces increased expression of brain-derived neurotrophic factor (BDNF), the PI-3 K/Akt, MAPK pro-survival pathways, the BDNF receptor, TrkB, a transcription factor, and cyclic AMP response element binding pro- tein (CREB). In the present study, we extend these findings of increased BDNF expression to its kinetics of release into the surrounding media. We also evaluate these two cell survival pathways, TrkB and CREB, in response to application of serotonin and/or norepinephrine. Serotonin elicits an earlier, but brief expression and release of BDNF, whereas norepinephrine elicits a more delayed and sustained release of BDNF. In response to both norepinephrine and 5-HT, the presence of BDNF in lysates and subsequent release into the media is significantly increased out to 4 h, as is PI-3 K/Akt activation. Together, these two neurotransmitters increase BDNF expression and release covering the entire 8 h contin- uum evaluated. The results of this study provide further evidence for a G protein-coupled receptor and a crosstalk-to- TrkB receptor with transactivation signaling across pathways. Keywords: BDNF; CREB; Serotonin; Norepinephrine; Hippocampus; Kinetics 1. Introduction Neuronal activity that increases as a result of sympathetic nervous system stimulation [1], such as physical activity [2-4] or administration of antidepressant drugs [5], has been shown to increase levels of peripheral [6] or CNS [4, 7-9] brain-derived neurotrophic factor (BDNF), and whe- ther that activity is electrical stimulation [1,10], extracel- lular application of K+ [1,11-17] or Ca2+ [13] or applica- tion of excitatory neurotransmitter (e.g., kainic acid, [11,15, 18-21]), forskolin (cAMP activator [15]) or inhibitory neurotransmitter antagonist (CGP 52432, GABAB recap- tor antagonist [15]). Conversely, anything that blocks neu- rotransmission, such as tetrodotoxin (Na+ channel block- er [10,12,22]), nifedipine [11,22], BAPTA-AM (intra- cellular Ca2+ chelator [12]) pertussis toxin (G-protein inhibitor [23]), Y 25130 (5-HT3 antagonist [15]) or AMPA or NMDA receptor blocker [21], has been shown to de- crease BDNF secretion. We have recently shown that BDNF levels in cultured hippocampal neurons will increase in response to appli- cation of norepinephrine [24-26]. Such cultured condi- tions were initially designed to model any activity or intervention in vivo [27] that results in greater release of norepinephrine, which has been shown to be neuropro- tective by increasing expression, secretion and release of BDNF [7,28]. The putative purpose of antidepressants is to inhibit the reuptake or metabolism of 5-HT or norepi- nephrine; although it is not yet definitively known why the therapeutic efficacy is such that these drugs take 2 - 4 weeks to work, the prevailing thinking suggests that changes in gene expression require such a time scale [29,30]. In our hippocampal tissue culture model, application of norepinephrine elicits maximum BDNF expression at 2 hours [24]. In the present study, we extend these pre- vious results obtained with norepinephrine and subse- *Funding was provided by PHS grant MH 559776 to ARN. The authors declare no conflict of interest. 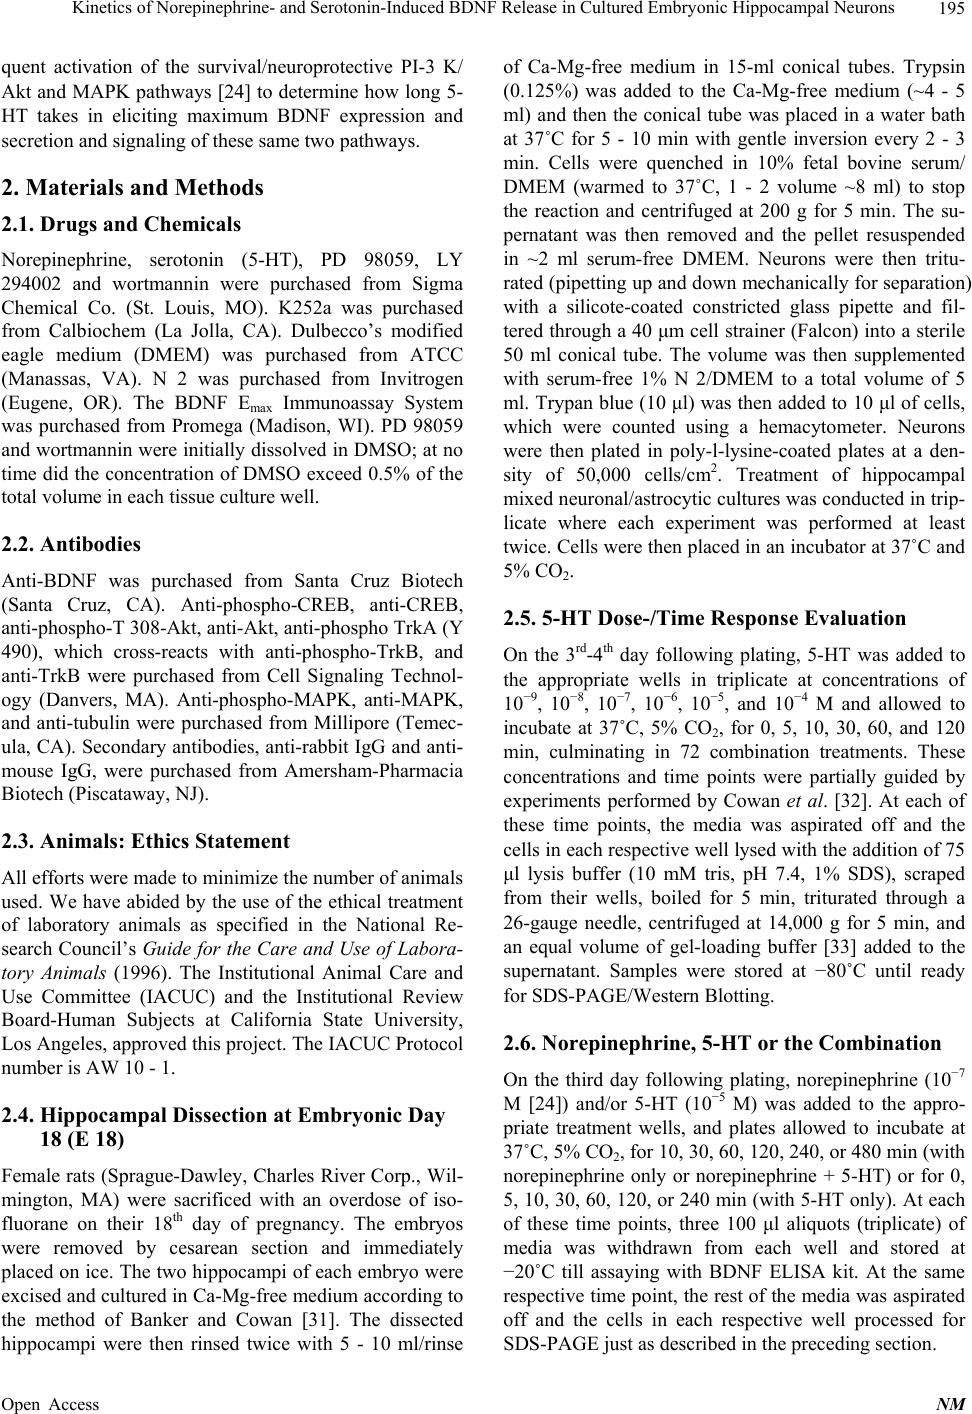 Kinetics of Norepinephrine- and Serotonin-Induced BDNF Release in Cultured Embryonic Hippocampal Neurons 195 quent activation of the survival/neuroprotective PI-3 K/ Akt and MAPK pathways [24] to determine how long 5- HT takes in eliciting maximum BDNF expression and secretion and signaling of these same two pathways. 2. Materials and Methods 2.1. Drugs and Chemicals Norepinephrine, serotonin (5-HT), PD 98059, LY 294002 and wortmannin were purchased from Sigma Chemical Co. (St. Louis, MO). K252a was purchased from Calbiochem (La Jolla, CA). Dulbecco’s modified eagle medium (DMEM) was purchased from ATCC (Manassas, VA). N 2 was purchased from Invitrogen (Eugene, OR). The BDNF Emax Immunoassay System was purchased from Promega (Madison, WI). PD 98059 and wortmannin were initially dissolved in DMSO; at no time did the concentration of DMSO exceed 0.5% of the total volume in each tissue culture well. 2.2. Antibodies Anti-BDNF was purchased from Santa Cruz Biotech (Santa Cruz, CA). Anti-phospho-CREB, anti-CREB, anti-phospho-T 308-Akt, anti-Akt, anti-phospho TrkA (Y 490), which cross-reacts with anti-phospho-TrkB, and anti-TrkB were purchased from Cell Signaling Technol- ogy (Danvers, MA). Anti-phospho-MAPK, anti-MAPK, and anti-tubulin were purchased from Millipore (Temec- ula, CA). Secondary antibodies, anti-rabbit IgG and anti- mouse IgG, were purchased from Amersham-Pharmacia Biotech (Piscataway, NJ). 2.3. Animals: Ethics Statement All efforts were made to minimize the number of animals used. We have abided by the use of the ethical treatment of laboratory animals as specified in the National Re- search Council’s Guide for the Care and Use of Labora- tory Animals (1996). The Institutional Animal Care and Use Committee (IACUC) and the Institutional Review Board-Human Subjects at California State University, Los Angeles, approved this project. The IACUC Protocol number is AW 10 - 1. 2.4. Hippocampal Dissection at Embryonic Day 18 (E 18) Female rats (Sprague-Dawley, Charles River Corp., Wil- mington, MA) were sacrificed with an overdose of iso- fluorane on their 18th day of pregnancy. The embryos were removed by cesarean section and immediately placed on ice. The two hippocampi of each embryo were excised and cultured in Ca-Mg-free medium according to the method of Banker and Cowan [31]. The dissected hippocampi were then rinsed twice with 5 - 10 ml/rinse of Ca-Mg-free medium in 15-ml conical tubes. Trypsin (0.125%) was added to the Ca-Mg-free medium (~4 - 5 ml) and then the conical tube was placed in a water bath at 37˚C for 5 - 10 min with gentle inversion every 2 - 3 min. Cells were quenched in 10% fetal bovine serum/ DMEM (warmed to 37˚C, 1 - 2 volume ~8 ml) to stop the reaction and centrifuged at 200 g for 5 min. The su- pernatant was then removed and the pellet resuspended in ~2 ml serum-free DMEM. Neurons were then tritu- rated (pipetting up and down mechanically for separation) with a silicote-coated constricted glass pipette and fil- tered through a 40 μm cell strainer (Falcon) into a sterile 50 ml conical tube. The volume was then supplemented with serum-free 1% N 2/DMEM to a total volume of 5 ml. Trypan blue (10 μl) was then added to 10 μl of cells, which were counted using a hemacytometer. Neurons were then plated in poly-l-lysine-coated plates at a den- sity of 50,000 cells/cm2. Treatment of hippocampal mixed neuronal/astrocytic cultures was conducted in trip- licate where each experiment was performed at least twice. Cells were then placed in an incubator at 37˚C and 5% CO2. 2.5. 5-HT Dose-/Time Response Evaluation On the 3rd-4th day following plating, 5-HT was added to the appropriate wells in triplicate at concentrations of 10−9, 10−8, 10−7, 10−6, 10−5, and 10−4 M and allowed to incubate at 37˚C, 5% CO2, for 0, 5, 10, 30, 60, and 120 min, culminating in 72 combination treatments. These concentrations and time points were partially guided by experiments performed by Cowan et al. [32]. At each of these time points, the media was aspirated off and the cells in each respective well lysed with the addition of 75 μl lysis buffer (10 mM tris, pH 7.4, 1% SDS), scraped from their wells, boiled for 5 min, triturated through a 26-gauge needle, centrifuged at 14,000 g for 5 min, and an equal volume of gel-loading buffer [33] added to the supernatant. Samples were stored at −80˚C until ready for SDS-PAGE/Western Blotting. 2.6. Norepinephrine, 5-HT or the Combination On the third day following plating, norepinephrine (10−7 M [24]) and/or 5-HT (10−5 M) was added to the appro- priate treatment wells, and plates allowed to incubate at 37˚C, 5% CO2, for 10, 30, 60, 120, 240, or 480 min (with norepinephrine only or norepinephrine + 5-HT) or for 0, 5, 10, 30, 60, 120, or 240 min (with 5-HT only). At each of these time points, three 100 μl aliquots (triplicate) of media was withdrawn from each well and stored at −20˚C till assaying with BDNF ELISA kit. At the same respective time point, the rest of the media was aspirated off and the cells in each respective well processed for SDS-PAGE just as described in the preceding section. Open Access NM  Kinetics of Norepinephrine- and Serotonin-Induced BDNF Release in Cultured Embryonic Hippocampal Neurons 196 2.7. SDS-PAGE/Western Blotting Equal amounts of cell lysates were applied to each lane of an SDS-PAG, electrophoresed, and the separated pro- teins subsequently electro-transferred to nitrocellulose (Amersham-Pharmacia Biotech, Piscataway, NJ). West- ern blotting on nitrocellulose membranes was performed according to the specifications of the respective manu- facturers. Protein immunoreactivity was visualized by enhanced chemiluminescence (ECL), followed by appo- sition of blots to hyperfilm (Amersham-Pharmacia Bio- tech, Piscataway, NJ). To control for inadvertent differ- ences in protein loading, all blots were then stripped in 100 mM 2-mercaptoethanol, 2% SDS, 62.5 mM tris-HCl, pH 6.7, at 55˚C for 10 min, with agitation and then re- probed with the antibody against the respective total form (anti-Akt, anti-MAPK, or anti-CREB), followed by ECL and apposition to hyperfilm. Blots first probed with anti-BDNF were stripped and then re-probed with anti- tubulin. Blots first probed with the phospho-forms, fol- lowed by the total forms, were then stripped once more and re-probed with anti-tubulin. All anti-tubulin reactions were then reacted once again with ECL and apposed to hyperfilm. Optical densities of lightly exposed phospho-proteins, BDNF, total forms (e.g., total CREB), and tubulin bands corresponding to the relative mobility of each respective signaling protein were quantified using computer-as- sisted densitometry (MCID, Interfocus Imaging Ltd, London). Optical densities of the phospho-forms were then arithmetically divided by those of their respective total forms; this quotient was then arithmetically divided by the respective tubulin band. Optical density of BDNF bands was arithmetically divided by those of their re- spective tubulin bands. All exposed bands quantified within the linear range of a standard curve were used in gathering densitometry data. 2.8. BDNF ELISA The presence of BDNF in the media in response to nore- pinephrine, 5-HT, or both at each time point was detected using the BDNF Emax Immunoassay System (Promega, Madison, WI). 2.9. Statistical Analyses For the Western data generated from the initial 5-HT dose-and time-response evaluation of BDNF immunore- activity, a 2-way ANOVA (dose × time) was calculated, using Fisher’s post hoc LSD to evaluate pair-wise com- parisons. For both the Western blot-generated optical densities and the BDNF Emax data, statistical analyses were implemented using 1-way ANOVA, followed by Fisher’s post hoc LSD to test for pair-wise statistically significant differences between any two time points. For analyzing how the activity of intracellular signaling molecules changes with respect to each other and over time, a 2-way ANOVA (molecule × time), followed by Fisher’s post hoc LSD test was conducted. For analyzing how the levels of BDNF change with respect to each other and over time, a 2-way ANOVA (condition × time), followed by Fisher’s post hoc LSD test was conducted, where condition is either lysates or media. 3. Results 3.1. Dose- and Time-Response of BDNF Immunoreactivity to 5-HT in Hippocampal Cell Lysates Application of 5-HT to E 18 hippocampal neurons sig- nificantly induced BDNF immunorectivity in a dose-[F(6, 84) = 138.38, p < 0.0001] and time-[F(5, 84) = 736.65, p < 0.0001] dependent manner. In addition, there was sig- nificant interaction between these two variables [F (30, 84) = 35.45, p < 0.0001] (Figure 1). BDNF immunoreac- tivity was increased significantly in response to only 10−9 M 5-HT in as little time as 5 min (p < 0.0001) and conti- nuing through to 10 min (p < 0.0001), compared to that of vehicle-treated controls at the corresponding zero time-points of 5 and 10 min (Figure 1). This same trend was also evident for all 5 of the higher doses evaluated (10−8, 10−7, 10−6, 10−5, and 10−4 M 5-HT), compared to vehicle-treated controls and compared to the zero time point. However, at 10−7 M 5-HT, BDNF immunoreac- tivity was significantly increased at 30 min, compared to vehicletreated controls and compared to the zero time point, but then decreased to levels comparable to those of controls (vehicle-treated at zero min) at 60 through to Figure 1. Serotonin elicits BDNF immunoreactivity in hip- pocampal neurons in a dose- and time-dependent manner. *, statistically significantly different from vehicle controls ([5- HT] = 0 M at 5 min (p < 0.001); #, statistically significantly different from vehicle controls ([5-HT] = 0 M at 10 min (p < 0.001); +, statistically significantly different from vehicle controls ([5-HT] = 0 M at 30 min (p < 0.001). Data are the mean ± SEM. Each experiment was conducted at least twice, with each sample measured in triplicate. Open Access NM  Kinetics of Norepinephrine- and Serotonin-Induced BDNF Release in Cultured Embryonic Hippocampal Neurons Open Access NM 197 120 min (Figure 1). 3.2. Kinetics of BDNF Release into the Media in Response to 5-HT, Norepinephrine, and Both As per the results displayed in Figure 1, the rest of this study was performed with 10−5 M 5-HT, as this concen- tration was one of the two that yielded the most BDNF immunoreactivity (the other being 10−4 M). Norepineph- rine was applied at a final concentration of 10−7 M, as this dose has been shown to elicit the highest BDNF immunoreactivity in a similar dose-/time-dependent ex- periment [24]. Application and incubation of the aforementioned con- centrations of 5-HT +/− norepinephrine at 5, 10, 30, 60, 120, 240, and 480 min display the results in Figure 2. There was a statistically significant interaction [F(13, 27) = 13.23, p < 0.0001] between time point and neurotrans- mitter (5-HT, norepinephrine, both, or neither (vehicle controls)) and a significant main effect of neurotransmit- ter [F(3, 27) = 76.66, p < 0.0001], but not for time point. For each time point up to and including 120 min, nore- pinephrine-induced secretion of BDNF was no different from that of vehicle; but at 240 min, norepinephrine lead to significantly more BDNF secretion into the media than that of vehicle (p = 0.002). In sharp contrast, however, 5- HT led to significantly more BDNF secretion than that of vehicle much earlier at 10 (p < 0.0001), 30 (p = 0.004) and 60 (p = 0.015) min. At 120 and 240 min, however, vehicle- and 5-HT-secreted BDNF values were compara- ble (Figure 2). When both neurotransmitters were com- bined, however, all time points revealed significantly more BDNF secretion into the media than that of vehicle alone [5 min (p < 0.0001), 10 min (p < 0.0001), 30 min (p = 0.051), 60 min (p = 0.002), 120 min (p < 0.0001), 240 min (p < 0.0001)] (Figure 2). Comparison of the amount of BDNF secretion be- tween vehicle and either neurotransmitter or both: veh vs. 5-HT [10 min (p < 0.000), 30 min (p = 0.004), 60 min (p = 0.015)]; veh vs. norepinephrine [240 min (p = 0.002), 480 min (p = 0.006)]; veh vs. norepinephrine + 5-HT (p < 0.0001 - 0.05). And comparison of the amount of BDNF secretion between either neurotransmitter alone and that of the combination treatment resulted in either statistically significant differences or a trend (Figure 2): 5-HT vs. norepinephrine + 5-HT [10 min (p = 0.057), 30 min (p = 0.031), 60 min (p = 0.056), 120 min (p < 0.0001), 240 min (p = 0.016)]; norepinephrine vs. nore- pinephrine + 5-HT [10 min (p < 0.0001), 30 min (p = 0.03), 60 min (p = 0.002), 120 min (p = 0.001), 240 min (p = 0.016), 480 min (p = 0.011)] (Figure 2). Figure 2. Serotonin and/or norepinephrine elicit the secretion of BDNF into the media from hippocampal neurons in a dose- and time-dependent manner. Serotonin caused significantly more BDNF secretion at 10, 30, and 60 min than at 5 min (p ≤ 0.005); norepinephrine elicited significantly more BDNF secretion at 120 min than at 5, 10, 30, and 60 min (p ≤ 0.004); nore- pinephrine elicited significantly more BDNF secretion at 240 min than at either 120 (p < 0.0001) or 480 (p < 0.001) min; and both neurotransmitters combined elicited as much as 2 - 5 times the amount elicited by vehicle alone at all time points. Among the combination treatment itself, there was a statistically significant decrease in BDNF secretion at 30 min, compared to that at 5 min (p = 0.022) and a lower, but not statistically significantly lower, than that at 60 min (p = 0.077). *, statistically significantly different from that of vehicle controls at the same corresponding time point at p < 0.05. #: significantly different at p < 0.05. Data are the mean ± SEM. Each experiment was conducted at least twice, with each sample measured in tripli- cate. 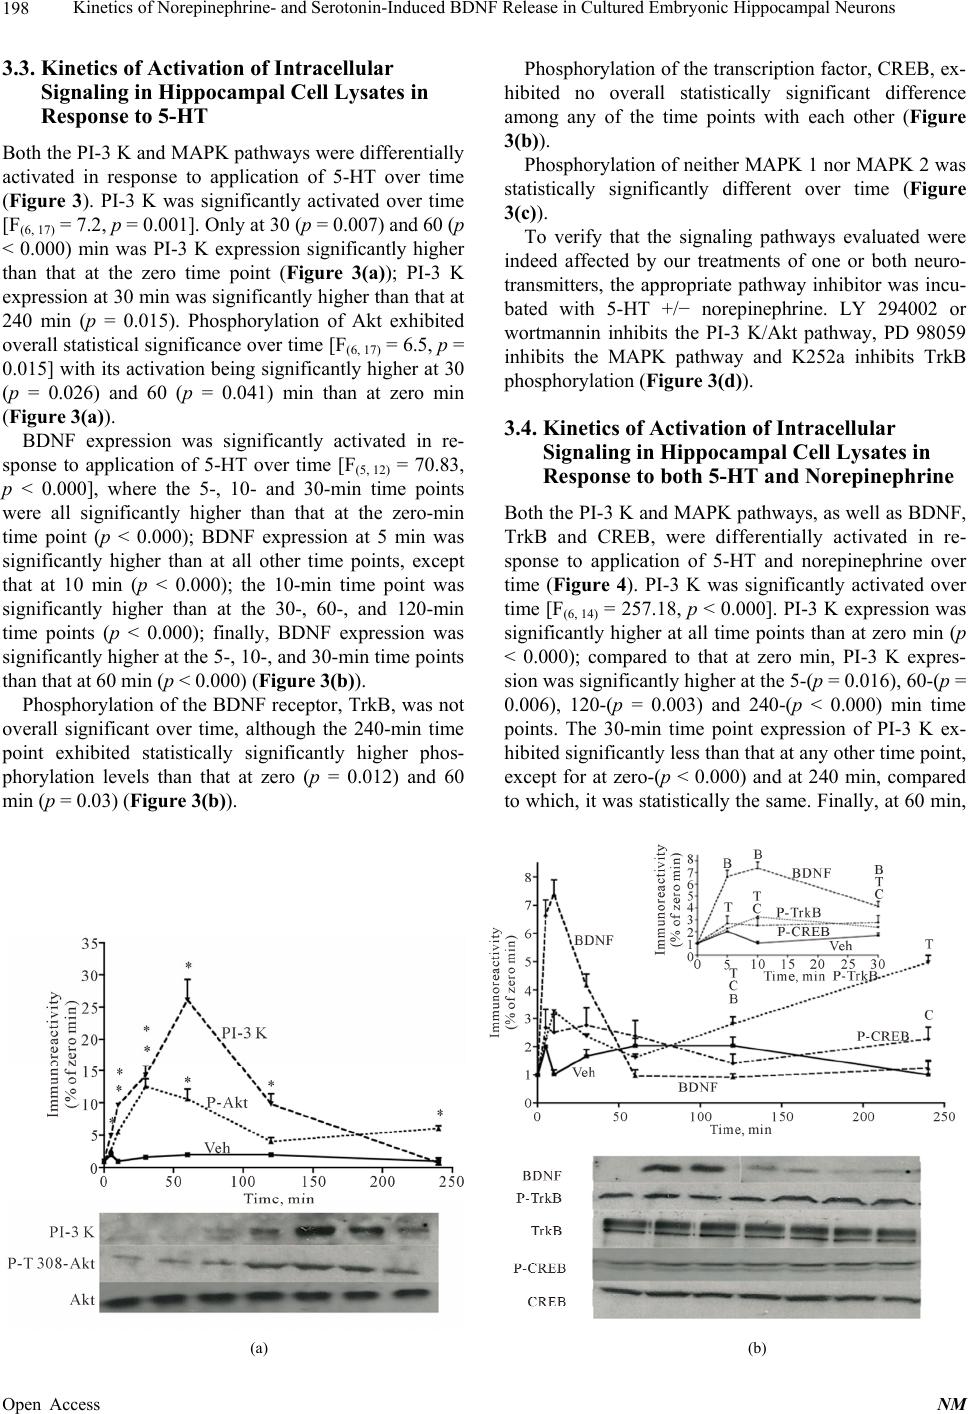 Kinetics of Norepinephrine- and Serotonin-Induced BDNF Release in Cultured Embryonic Hippocampal Neurons 198 3.3. Kinetics of Activation of Intracellular Signaling in Hippocampal Cell Lysates in Response to 5-HT Both the PI-3 K and MAPK pathways were differentially activated in response to application of 5-HT over time (Figure 3). PI-3 K was significantly activated over time [F(6, 17) = 7.2, p = 0.001]. Only at 30 (p = 0.007) and 60 (p < 0.000) min was PI-3 K expression significantly higher than that at the zero time point (Figure 3(a)); PI-3 K expression at 30 min was significantly higher than that at 240 min (p = 0.015). Phosphorylation of Akt exhibited overall statistical significance over time [F(6, 17) = 6.5, p = 0.015] with its activation being significantly higher at 30 (p = 0.026) and 60 (p = 0.041) min than at zero min (Figure 3(a)). BDNF expression was significantly activated in re- sponse to application of 5-HT over time [F(5, 12) = 70.83, p < 0.000], where the 5-, 10- and 30-min time points were all significantly higher than that at the zero-min time point (p < 0.000); BDNF expression at 5 min was significantly higher than at all other time points, except that at 10 min (p < 0.000); the 10-min time point was significantly higher than at the 30-, 60-, and 120-min time points (p < 0.000); finally, BDNF expression was significantly higher at the 5-, 10-, and 30-min time points than that at 60 min (p < 0.000) (Figure 3(b)). Phosphorylation of the BDNF receptor, TrkB, was not overall significant over time, although the 240-min time point exhibited statistically significantly higher phos- phorylation levels than that at zero (p = 0.012) and 60 min (p = 0.03) (Figure 3(b)). Phosphorylation of the transcription factor, CREB, ex- hibited no overall statistically significant difference among any of the time points with each other (Figure 3(b)). Phosphorylation of neither MAPK 1 nor MAPK 2 was statistically significantly different over time (Figure 3(c)). To verify that the signaling pathways evaluated were indeed affected by our treatments of one or both neuro- transmitters, the appropriate pathway inhibitor was incu- bated with 5-HT +/− norepinephrine. LY 294002 or wortmannin inhibits the PI-3 K/Akt pathway, PD 98059 inhibits the MAPK pathway and K252a inhibits TrkB phosphorylation (Figure 3(d)). 3.4. Kinetics of Activation of Intracellular Signaling in Hippocampal Cell Lysates in Response to both 5-HT and Norepinephrine Both the PI-3 K and MAPK pathways, as well as BDNF, TrkB and CREB, were differentially activated in re- sponse to application of 5-HT and norepinephrine over time (Figure 4). PI-3 K was significantly activated over time [F(6, 14) = 257.18, p < 0.000]. PI-3 K expression was significantly higher at all time points than at zero min (p < 0.000); compared to that at zero min, PI-3 K expres- sion was significantly higher at the 5-(p = 0.016), 60-(p = 0.006), 120-(p = 0.003) and 240-(p < 0.000) min time points. The 30-min time point expression of PI-3 K ex- hibited significantly less than that at any other time point, except for at zero-(p < 0.000) and at 240 min, compared to which, it was statistically the same. Finally, at 60 min, (a) (b) Open Access NM  Kinetics of Norepinephrine- and Serotonin-Induced BDNF Release in Cultured Embryonic Hippocampal Neurons 199 (c) (d) Figure 3. Serotonin differentially affects various signaling intermediates and pathways. For ease of comparison, all 7 signal- ing molecules were divided into 3 graphs (a)-(c): (a) vehicle, PI-3 K and P-Akt, (b) vehicle, BDNF, P-TrkB and P-CREB, and (c) vehicle, P-MAPK 1 and P-MAPK 2. These 3 graphs are displayed to provide maximum clarity with respect to the ordinate and do not reflect the relative proportions of all 7 signaling molecules (P-Akt, PI-3 K, BDNF, P-TrkB, P-CREB, P-MAPK 1, P-MAK 2). Vehicle represents the mean of the responses of all 7 signaling molecules in response to application of vehicle, which serves as baseline; its small error bars reveal that there are no statistically significant differences among all 7 mole- cules and are displayed as such to help minimize complexity of the graphs. For such direct comparisons among all 7 mole- cules, a 2-way ANOVA was conducted (molecule x time, see Methods). Levels of both P-MAPK 1 and P-MAPK 2 are signifi- cantly lower than levels of PI-3 K at 5 (p = 0.013 - 0.014), 10 (p < 0.000), 30 (p = 0.004 - 0.006), 60 (p < 0.000) and 120 (p < 0.000) min; levels of both P-MAPK 1 and P-MAPK 2 are significantly higher than levels of P-Akt throughout to 240 min (p < 0.000 - 0.043). Levels of P-CREB was significantly lower than those of PI-3 K at 5 (p = 0.001), 10 (p = 0.001), 30 (p = 0.008) and levels of P-Akt at 30 min (p = 0.022), 60 (p = 0.001) and 120 (p < 0.000) min; levels of P-CREB were significantly higher than those of both P-MAPK 1 and P-MAPK 2 up to 60 min inclusive (p = 0.009 - 0.017). (a) Compared to baseline (vehicle), PI-3 K is significantly higher from 5 - 120 min (p < 0.001). P-Akt is significantly higher than that of baseline from 10 - 240 min (p < 0.01); PI-3 K is significantly higher than P-Akt at 10 (p = 0.05), 60 (p < 0.000) and 120 (p = 0.001) min. *, statistically significantly different from zero time point at p < 0.05; one column of two *, both PI-3 K and P-Akt are statistically signifi- cantly different from zero time point at p < 0.05. (b) BDNF is significantly higher than that of baseline from 5 - 30 min (p < 0.05, inset) and significantly lower than that of baseline vehicle at 60 and 120 min (p < 0.05); P-TrkB is significantly higher than that of baseline vehicle at 10 (p = 0.043), 30 (p = 0.043), 120 (p = 0.045) and 240 (p = 0.012) min; P-CREB levels are sig- nificantly higher than that of baseline at only 30 min (p = 0.026). BDNF is significantly higher than P-TrkB at 5 (p = 0.008), 10 (p = 0.011) and 30 (p = 0.035) min; BDNF is significantly higher than P-CREB at 5 (p = 0.01) and 10 (p = 0.015) min; and P- TrkB is significantly higher than P-CREB at 120- (p = 0.016) and 240- (p = 0.009) min. Inset: B, T and C refer to BDNF, P- TrkB and P-CREB, respectively, and indicate that levels of this molecule are significantly different from that at zero min at p < 0.05. (c) Both P-MAPK1 and P-MAPK 2 levels are significantly lower than that of baseline from 30 - 120 min (p = 0.004 - 0.039). Levels of P-MAPK 1 and P-MAPK 2 did not significantly differ from each other throughout the entire duration. Data are the mean ± SEM. (d) Representative immunoblots in the presence of the appropriate inhibitor for TrkB (K252a, 10 μM), PI-3 K/Akt pathway (LY, LY 294002 (10 μM) or Wort, wortmannin (20 μM)) or MAPK (PD, PD 98059, 50 μM) pathway. Each inhibitor was added at this final concentration 1 hr prior to the application of neurotransmitter. Each experiment was conducted at least twice, with each sample measured in triplicate. PI-3 K expression was significantly higher than at all other time points, except that at 10 min and 120 min (Figure 4(a)). Akt was significantly phosphorylated over time [F (6, 14) = 72.07, p < 0.000]. Akt phosphorylation was significantly higher at all time points than at zero min (p < 0.000); Akt phosphorylation was significantly higher at both the 5- and 10-min time points than at the 30- and 240-min time points (p < 0.000). At 60 min, Akt was phosphorylated significantly higher than at all other time points (p < 0.000 - 0.009), except those at 5 and 10 min. At 120 min, phosphorylation of Akt was signifi- cantly higher than at 30 and 240 min (p < 0.000) statisti- cally the same as that at 60 min (p = 0.009) (Figure 4(a)). BDNF expression was significantly activated in re- sponse to application of 5-HT and norepinephrine over time [F(6, 14) = 17.97, p < 0.000], where the expression was significantly higher at 30 (p < 0.000), 120 (p < 0.000) and 240 (p = 0.001) min and significantly lower at 60 min (p = 0.000) than at zero min (Figure 4(b)). At both 5 and 10 min, BDNF expression was significantly lower han that at 30 (p = 0.004, 0.018, respectively), 120 t Open Access NM  Kinetics of Norepinephrine- and Serotonin-Induced BDNF Release in Cultured Embryonic Hippocampal Neurons 200 (a) (b) (c) Figure 4. Serotonin and norepinephrine administered together differentially affect various signaling intermediates and path- ways. For ease of comparison, all 7 signaling molecules were divided into 3 graphs (a)-(c): (a) vehicle, PI-3 K and P-Akt, (b) vehicle, BDNF, P-TrkB and P-CREB, and (c) vehicle, P-MAPK 1 and P-MAPK 2. These 3 graphs are displayed to provide maximum clarity with respect to the ordinate and do not reflect the relative proportions of all 7 signaling molecules (P-Akt, PI-3 K, BDNF, P-TrkB, P-CREB, P-MAPK1, P-MAPK 2). Vehicle represents the mean of the responses of all 7 signaling molecules in response to application of vehicle, which serves as baseline; its small error bars reveal that there are no statisti- cally significant differences among all 7 molecules and are displayed as such to help minimize complexity of the graphs. For such direct comparisons among all 7 molecules, a 2-way ANOVA was conducted (molecule x time, see Methods). Activity of both PI-3 K and P-Akt are significantly higher than that of both P-MAPK1 and P-MAPK 2 (p = 0.003 - 0.028), even at 30 min. P-Akt levels are significantly lower than that of BDNF (p = 0.022) and P-TrkB (p < 0.000), but is statistically the same as that as P-CREB at 30 min; then, at 60 min, P-Akt levels are significantly higher than that of BDNF (p < 0.000) and P-CREB (p = 0.033), but not statistically different from that of P-TrkB; at 240 min, P-Akt is significantly lower than that of BDNF (p = 0.012) and P-TrkB (p = 0.034), and significantly higher than that of P-CREB (p = 0.037). Finally, starting at 30 min, P-TrkB levels are significantly higher than that of both P-MAPK 1 (p = 0.004 - 0.039) and P-MAPK 2 (p < 0.000) throughout to 240 min; at 60 min, BDNF levels are significantly lower than that of P-MAPK1 (p = 0.029), but significantly higher than that of P- MAPK 2 (p < 0.000); but at 120 to 240 min, BDNF levels are significantly higher than that of both P-MAPK 1 (p < 0.001) and P-MAPK 2 (p < 0.001). (a) Expression and activity levels of both P-Akt and PI-3 K, whose time courses parallel each other, are significantly higher than that of baseline (vehicle) from 5 - 240 min (p < 0.001). *, statistically significantly different from zero time point at p < 0.05; one column of two *, both PI-3 K and P-Akt are statistically significantly different from zero time point at p < 0.05. (b) BDNF is significantly higher than that of baseline vehicle from 5 - 30 min (p < 0.05, inset) and statisti- cally the same as that of baseline at 60 min, but is significantly higher than that of baseline at 120 (p = 0.019) and 240 (p = 0.024) min; P-TrkB is significantly higher than that of baseline throughout from 5 - 240 min (p = 0.013 - 0.041); P-CREB is significantly higher than that of baseline throughout from 5 - 240 min (p = 0.001 - 0.018). BDNF is significantly higher than Open Access NM  Kinetics of Norepinephrine- and Serotonin-Induced BDNF Release in Cultured Embryonic Hippocampal Neurons 201 that of P-CREB at 30 (p = 0.039), 120 (p = 0.041) and 240 (p = 0.02) min, but is significantly lower than that of the phos- phorylated transcription factor at 60 min (p = 0.013); BDNF is significantly lower than that of P-TrkB at 30 (p = 0.026), 60 (p = 0.009), 120 (p = 0.045) and 240 (p = 0.038) min; P-TrkB levels are significantly higher than those of P-CREB starting at 30 (p < 0.001), 60 (p = 0.006), 120 (p = 0.005) and 240 (p = 0.002) min. Inset: B, T and C refer to BDNF, P-TrkB and P-CREB, respectively, and indicate that levels of this molecule are significantly different from that at zero min at p < 0.05. (c) P-MAPK 1 levels are significantly higher than that of baseline at 10 (p < 0.001), 60 (p = 0.021), 120 (p = 0.031) and 240 (p = 0.048), but not at 5 nor 30 min; P-MAPK 2 levels are significantly lower than that of baseline starting at 10 min throughout to 240 min (p < 0.001); likewise, P-MAPK1 levels are significantly higher than those of P-MAPK 2 starting at 10 min throughout to 240 min (p < 0.001). *, statistically significantly different from zero time point at p < 0.05. Data are the mean ± SEM. Each experiment was conducted at least twice, with each sample measured in triplicate. (p = 0.000, 0.000, respectively) and 240 (p = 0.013, 0.05, respectively). At 60 min, BDNF expression was signifi- cantly lower than at all other time points (p = 0.000 - 0.004). At 240 min, BDNF expression was significantly higher than that at zero and at 60 min (p = 0.001) (Figure 4(b)). Differences in phosphorylation of TrkB was signifi- cant over time [F(6, 21) = 36.86, p < 0.000]: all time points, except at 5 min, saw a statistically significant increase in TrkB phosphorylation (p < 0.000) compared with that at zero min. However, starting at 10 min, TrkB phosphory- lation was not significantly different from all subsequent time points. CREB phosphorylation was significantly different over time [F(6, 14) = 30.59, p < 0.000] in response to ap- plication of both 5-HT and norepinephrine. Starting at zero min, all time points were significantly higher (p < 0.000); at 5 min, phosphorylation was significantly lower than at all other subsequent time points (p < 0.000 - 0.014), except at 30 min; at 10 min, phosphorylation was significantly higher (p < 0.000 - 0.014), except at 60 and 120 min; at 30 min, phosphorylation was significantly higher than that at zero and significantly lower than that at 10 (p = 0.008), 60 (p < 0.000) and 120 (p = 0.023) min (Figure 4(b)). Phosphorylation of MAPK 1 was significantly differ- ent over time [F (6, 14) = 25.63, p < 0.000] in response to application of both 5-HT and norepinephrine. Phos- phorylation of MAPK 1 was significantly higher at the 10-(p = 0.012), 60-(p = 0.42) and 120-(p = 0.039) min time points than that at zero min (Figure 4(c)). Likewise, phosphorylation of MAPK 2 was significantly different over time in response to both neurotransmitters [F(6, 14) = 6.22, p = 0.0212]. MAPK 2 phosphorylation was signifi- cantly higher at the 5-min (p = 0.039 - 0.009) than at all subsequent time points (Figure 4(c)). 3.5. Kinetics of BDNF Concentrations in Lysates and Media in Response to Norepinephrine, Serotonin or both In response to application of norepinephrine, levels of BDNF between lysates and media were significantly changed over time [F(6, 14) = 46.81, p < 0.001] (Figure 5(a)). BDNF levels in lysates were significantly higher at 120 min than that 30 (p = 0.002) and 480 (p = 0.008) min (Figure 5(a)). BDNF levels in media were significantly higher at 240 min (p < 0.001) than at all other time points evaluated (Figure 5(a)). In response to application of 5-HT, levels of BDNF between lysates and media were significantly changed over time [F(6, 14) = 29.44, p < 0.001] (Figure 5(b)). BDNF levels in lysates were significantly higher at 10 min (p = 0.007) than at all other time points. BDNF lev- els in media were significantly higher at 10 (p < 0.000) and 30 (p < 0.000) min than at all other time points evaluated (Figure 5(b)). In response to application of both norepinephrine and 5-HT, levels of BDNF between lysates and media were significantly changed over time [F(6, 14) = 18.76, p = 0.002] (Figure 5(c)). BDNF levels in lysates were sig- nificantly higher at 10 min (p = 0.004) and lower at 30 min (p = 0.006) than at all other time points (Figure 5(c)). BDNF levels in media were significantly lower at 30 min (p = 0.039) than at all other time points evaluated (Figure 5(c)). 4. Discussion We have previously shown that hippocampal neurons in culture respond to application of norepinephrine by in- creasing expression of BDNF, its receptor, TrkB, activa- tion of the PI-3 K and MAPK pathways, and the tran- scription factor, CREB [24]. In that study, we demon- strated that in a dose- and time-response experiment, 10−7 M norepinephrine for 2 hr was maximally effective in eliciting BDNF expression; consistently, activation of TrkB was sustained for 4 hr and that of PI-3 K and MAPK pathways was maintained out to 8 hr [24,34]. In the current study, we extend characterization of norepi- nephrine-induced expression of BDNF, not only within hippocampal neurons themselves (lysates via immunoblot- ting, [24]), but also, to the kinetics of BDNF release into the surrounding media (Figure 5(a)). We also character- ized the kinetics of 5-HT-induced BDNF expression (Figure 5(b)) just as we did earlier with norepinephrine [24]. As expected, the time course expression of BDNF in neuronal lysates precedes that released into the media (Figures 5(a), (b)). W e show that although significant BDNF expression is Open Access NM 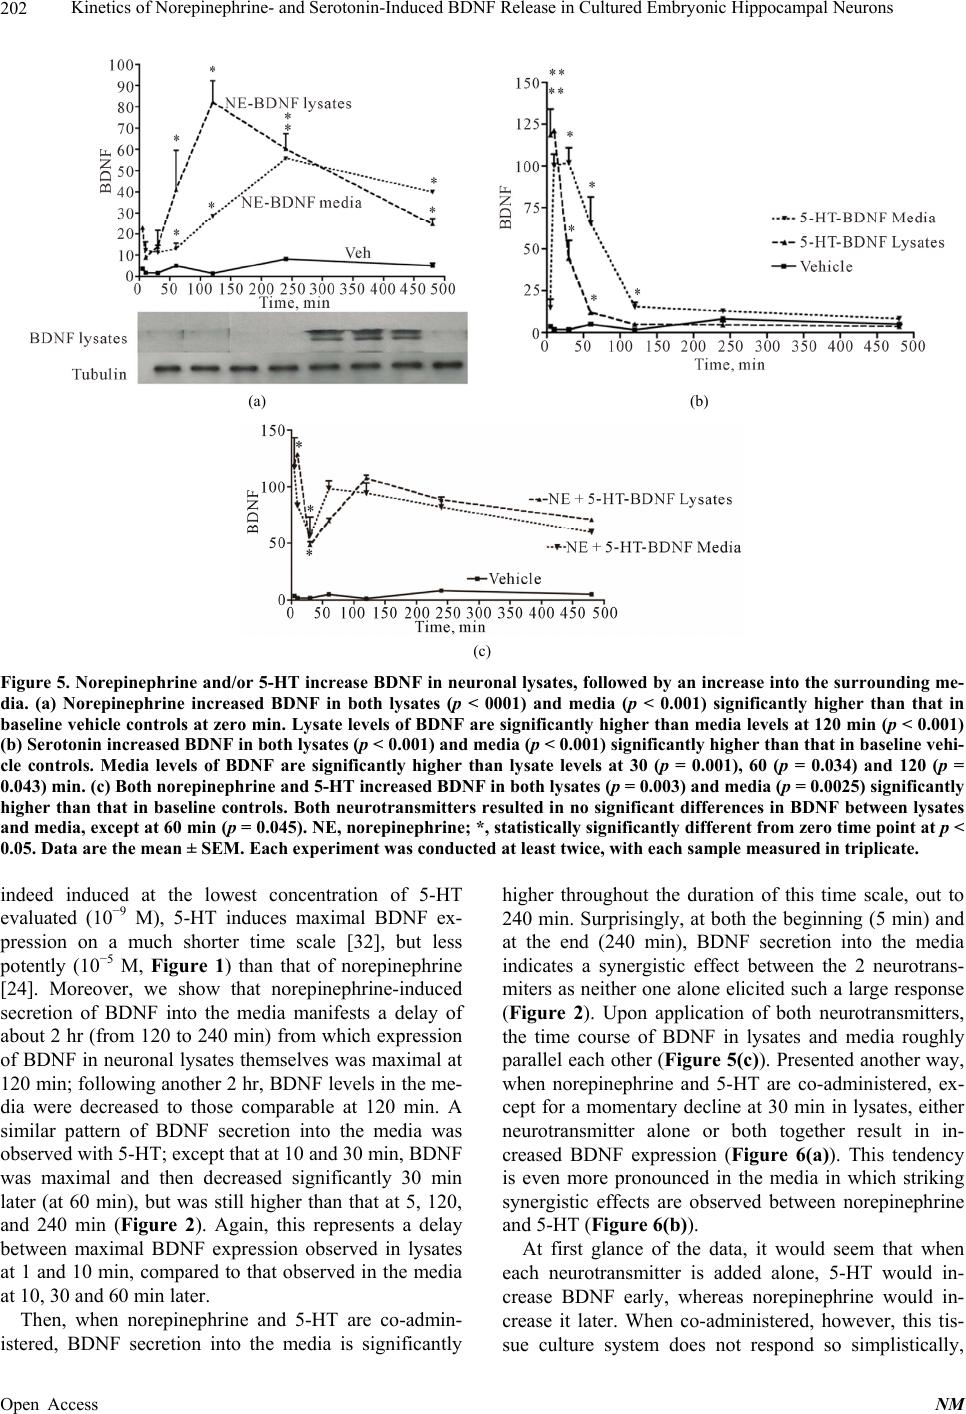 Kinetics of Norepinephrine- and Serotonin-Induced BDNF Release in Cultured Embryonic Hippocampal Neurons 202 (a) (b) (c) Figure 5. Norepinephrine and/or 5-HT increase BDNF in neuronal lysates, followed by an increase into the surrounding me- dia. (a) Norepinephrine increased BDNF in both lysates (p < 0001) and media (p < 0.001) significantly higher than that in baseline vehicle controls at zero min. Lysate levels of BDNF are significantly higher than media levels at 120 min (p < 0.001) (b) Serotonin increased BDNF in both lysates (p < 0.001) and media (p < 0.001) significantly higher than that in baseline vehi- cle controls. Media levels of BDNF are significantly higher than lysate levels at 30 (p = 0.001), 60 (p = 0.034) and 120 (p = 0.043) min. (c) Both norepinephrine and 5-HT increased BDNF in both lysates (p = 0.003) and media (p = 0.0025) significantly higher than that in baseline controls. Both neurotransmitters resulted in no significant differences in BDNF between lysates and media, except at 60 min (p = 0.045). NE, norepinephrine; *, statistically significantly different from zero time point at p < 0.05. Data are the mean ± SEM. Each experiment was conducted at least twice, with each sample measured in triplicate. indeed induced at the lowest concentration of 5-HT evaluated (10−9 M), 5-HT induces maximal BDNF ex- pression on a much shorter time scale [32], but less potently (10−5 M, Figure 1) than that of norepinephrine [24]. Moreover, we show that norepinephrine-induced secretion of BDNF into the media manifests a delay of about 2 hr (from 120 to 240 min) from which expression of BDNF in neuronal lysates themselves was maximal at 120 min; following another 2 hr, BDNF levels in the me- dia were decreased to those comparable at 120 min. A similar pattern of BDNF secretion into the media was observed with 5-HT; except that at 10 and 30 min, BDNF was maximal and then decreased significantly 30 min later (at 60 min), but was still higher than that at 5, 120, and 240 min (Figure 2). Again, this represents a delay between maximal BDNF expression observed in lysates at 1 and 10 min, compared to that observed in the media at 10, 30 and 60 min later. Then, when norepinephrine and 5-HT are co-admin- istered, BDNF secretion into the media is significantly higher throughout the duration of this time scale, out to 240 min. Surprisingly, at both the beginning (5 min) and at the end (240 min), BDNF secretion into the media indicates a synergistic effect between the 2 neurotrans- miters as neither one alone elicited such a large response (Figure 2). Upon application of both neurotransmitters, the time course of BDNF in lysates and media roughly parallel each other (Figure 5(c)). Presented another way, when norepinephrine and 5-HT are co-administered, ex- cept for a momentary decline at 30 min in lysates, either neurotransmitter alone or both together result in in- creased BDNF expression (Figure 6(a)). This tendency is even more pronounced in the media in which striking synergistic effects are observed between norepinephrine and 5-HT (Figure 6(b)). At first glance of the data, it would seem that when each neurotransmitter is added alone, 5-HT would in- crease BDNF early, whereas norepinephrine would in- crease it later. When co-administered, however, this tis- sue culture system does not respond so simplistically, Open Access NM 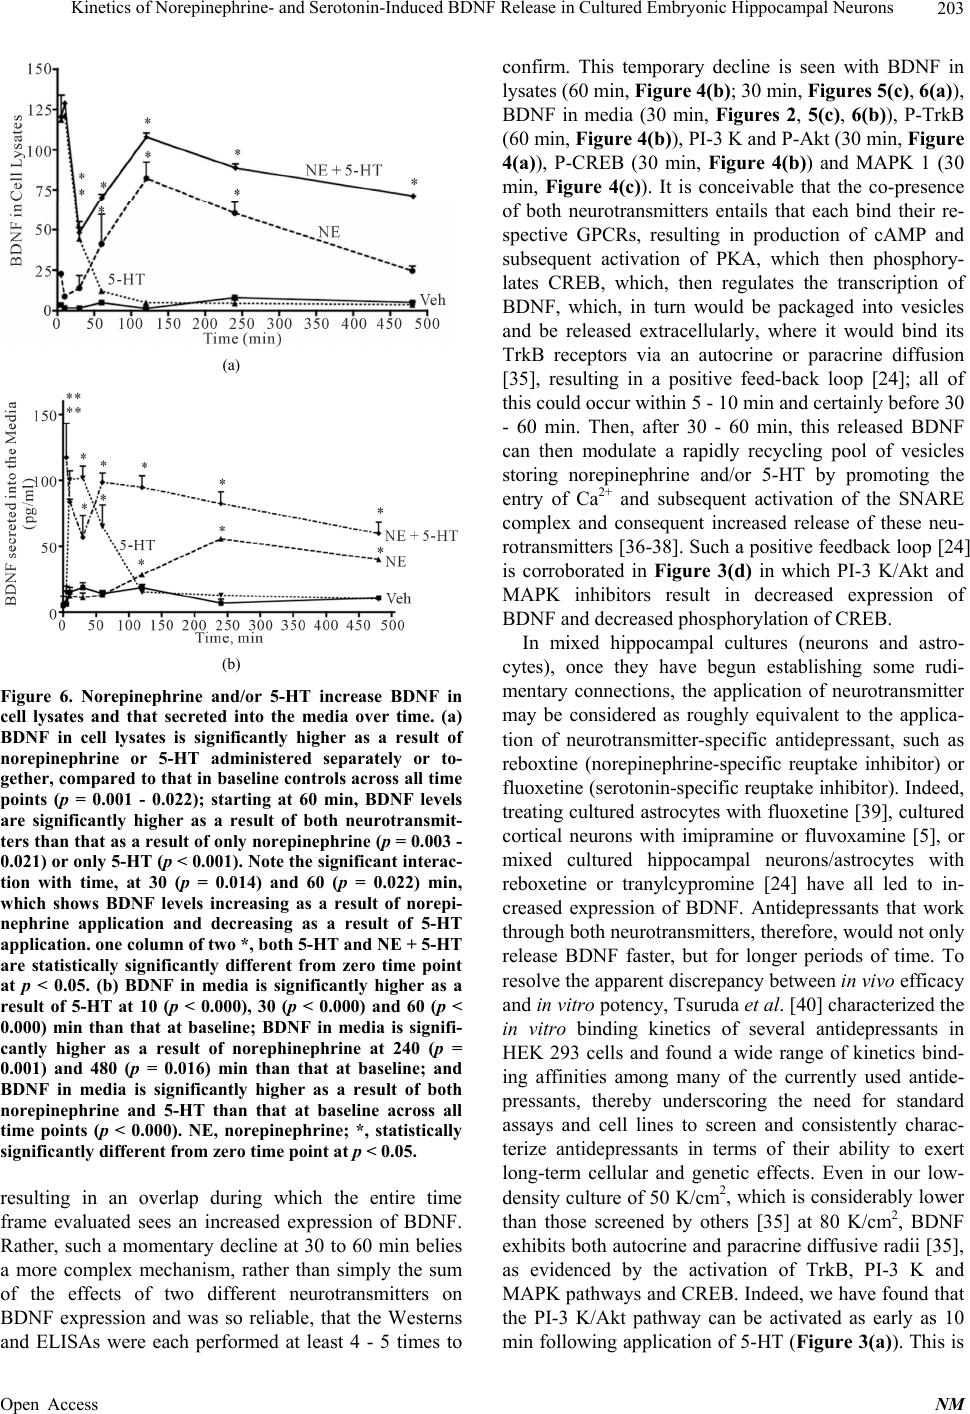 Kinetics of Norepinephrine- and Serotonin-Induced BDNF Release in Cultured Embryonic Hippocampal Neurons 203 (a) (b) Figure 6. Norepinephrine and/or 5-HT increase BDNF in cell lysates and that secreted into the media over time. (a) BDNF in cell lysates is significantly higher as a result of norepinephrine or 5-HT administered separately or to- gether, compared to that in baseline controls across all time points (p = 0.001 - 0.022); starting at 60 min, BDNF levels are significantly higher as a result of both neurotransmit- ters than that as a result of only norepinephrine (p = 0.003 - 0.021) or only 5-HT (p < 0.001). Note the significant interac- tion with time, at 30 (p = 0.014) and 60 (p = 0.022) min, which shows BDNF levels increasing as a result of norepi- nephrine application and decreasing as a result of 5-HT application. one column of two *, both 5-HT and NE + 5-HT are statistically significantly different from zero time point at p < 0.05. (b) BDNF in media is significantly higher as a result of 5-HT at 10 (p < 0.000), 30 (p < 0.000) and 60 (p < 0.000) min than that at baseline; BDNF in media is signifi- cantly higher as a result of norephinephrine at 240 (p = 0.001) and 480 (p = 0.016) min than that at baseline; and BDNF in media is significantly higher as a result of both norepinephrine and 5-HT than that at baseline across all time points (p < 0.000). NE, norepinephrine; *, statistically significantly different from zero time point at p < 0.05. resulting in an overlap during which the entire time frame evaluated sees an increased expression of BDNF. Rather, such a momentary decline at 30 to 60 min belies a more complex mechanism, rather than simply the sum of the effects of two different neurotransmitters on BDNF expression and was so reliable, that the Westerns and ELISAs were each performed at least 4 - 5 times to confirm. This temporary decline is seen with BDNF in lysates (60 min, Figure 4(b); 30 min, Figures 5(c), 6(a)), BDNF in media (30 min, Figures 2, 5(c), 6(b)), P-TrkB (60 min, Figure 4(b)), PI-3 K and P-Akt (30 min, Figure 4(a)), P-CREB (30 min, Figure 4(b)) and MAPK 1 (30 min, Figure 4(c)). It is conceivable that the co-presence of both neurotransmitters entails that each bind their re- spective GPCRs, resulting in production of cAMP and subsequent activation of PKA, which then phosphory- lates CREB, which, then regulates the transcription of BDNF, which, in turn would be packaged into vesicles and be released extracellularly, where it would bind its TrkB receptors via an autocrine or paracrine diffusion [35], resulting in a positive feed-back loop [24]; all of this could occur within 5 - 10 min and certainly before 30 - 60 min. Then, after 30 - 60 min, this released BDNF can then modulate a rapidly recycling pool of vesicles storing norepinephrine and/or 5-HT by promoting the entry of Ca2+ and subsequent activation of the SNARE complex and consequent increased release of these neu- rotransmitters [36-38]. Such a positive feedback loop [24] is corroborated in Figure 3(d) in which PI-3 K/Akt and MAPK inhibitors result in decreased expression of BDNF and decreased phosphorylation of CREB. In mixed hippocampal cultures (neurons and astro- cytes), once they have begun establishing some rudi- mentary connections, the application of neurotransmitter may be considered as roughly equivalent to the applica- tion of neurotransmitter-specific antidepressant, such as reboxtine (norepinephrine-specific reuptake inhibitor) or fluoxetine (serotonin-specific reuptake inhibitor). Indeed, treating cultured astrocytes with fluoxetine [39], cultured cortical neurons with imipramine or fluvoxamine [5], or mixed cultured hippocampal neurons/astrocytes with reboxetine or tranylcypromine [24] have all led to in- creased expression of BDNF. Antidepressants that work through both neurotransmitters, therefore, would not only release BDNF faster, but for longer periods of time. To resolve the apparent discrepancy between in vivo efficacy and in vitro potency, Tsuruda et al. [40] characterized the in vitro binding kinetics of several antidepressants in HEK 293 cells and found a wide range of kinetics bind- ing affinities among many of the currently used antide- pressants, thereby underscoring the need for standard assays and cell lines to screen and consistently charac- terize antidepressants in terms of their ability to exert long-term cellular and genetic effects. Even in our low- density culture of 50 K/cm2, which is considerably lower than those screened by others [35] at 80 K/cm2, BDNF exhibits both autocrine and paracrine diffusive radii [35], as evidenced by the activation of TrkB, PI-3 K and MAPK pathways and CREB. Indeed, we have found that the PI-3 K/Akt pathway can be activated as early as 10 min following application of 5-HT (Figure 3(a)). This is Open Access NM  Kinetics of Norepinephrine- and Serotonin-Induced BDNF Release in Cultured Embryonic Hippocampal Neurons 204 consistent with earlier findings of 10−8 M 5-HT within as little as 2 to 5 min [32] and with what others found, albeit in cerebellar granule neurons, that direct application of BDNF itself resulted in phosphorylation of Akt in as lit- tle as 5 min and was sustained for 6 h [41]. To achieve rapid and sustained activation of these survival signaling pathways, therefore, if not applying BDNF directly [32,41], but rather, using antidepressants or the neuro- transmitters themselves, at least both the noradrenergic and serotonergic systems must be targeted. This latter indirect application of BDNF provides further evidence for receptor/pathway crosstalk between GPCRs and Trk receptors ([24], and references cited therein; [42,43]). The time course for increased BDNF expression and release into the media is consistent with earlier studies that found increased BDNF kinetics on the order of sev- eral minutes [44]. High K+ concentration has been shown in cultured hippocampal neurons to secrete both pro- and mature BDNF for 90 min following K+-induced depo- larization [17], which is comparable to our findings in response to norepinephrine-induced BDNF secretion starting at 120 min. This suggests that depolarization- driven BDNF release, when it occurs slowly (longer time scale) may be mediated by noradrenergic receptor bind- ing. Faster BDNF release (or shorter time scale) may be mediated serotonergically as the current study shows. Shen et al. [45] have also shown in vivo, that in as little as 15 min of swim stress, hippocampal P-MEK is dra- matically increased. Chen and Russo-Neustadt [8] have shown that a single overnight bout of running exercise significantly increased hippocampal BDNF and P-CREB. Thus, although Aicardi et al. [46] found that in peripheral cortical slices, theta burst stimulation at a frequency known to induce LTP, the subsequent secretion of BDNF was sustained 5 - 12 min beyond the stimulation period. High K+ has also been shown to result in rapid BDNF release (400 sec, [22]). It is possible that these few min- utes beyond the stimulation interval are serotonergically mediated. Still, it is not clear why this discrepancy in kinetics of release may exist between noradrenergically and sero- tonergically mediated release of BDNF. Others have suggested that the speed of BDNF release/secretion is limited by the slow dissolution of the secretory granule peptide core following opening of the fusion pore con- necting the membranes of the granule with that of the cell [47]. It is also possible that co-localization of BDNF with other small peptides in the secretory granule in both pre- and post-synaptic terminals [48], their respective concentrations and molecular weights, their speed of binding and unbinding from the core and their speed of diffusion through the fusion pore all determine the rate of secretion into the media [47]. Moreover, secretion of BDNF is relegated to the regulated pathway of secretion and co-localization with the PSD 95 in glutamatergic synapses [49]. Those investigators found that depolariza- tion-induced release of BDNF from secretory granules typically takes the longest of all neurotrophins, on the order of about 300 sec [13,49], following a 30-sec delay onset and a half-life decay of about 230 sec [49]. Finally, there is ample evidence that because BDNF is actually secreted in its precursor form (pro-BDNF), which is then cleared from the extracellular space via rapid uptake by nearby astrocytes and neurons, which internalize pro- BDNF via formation with a complex with the p 75 re- ceptor and subsequent endocytosis. This endocytosed pro-BDNF is then routed to a fast recycling pathway for subsequent soluble NSF attachment protein receptor- dependent secretion occurring on a 5-min [50] to 10-min [16] time scale. 5. Conclusion In conclusion, our hippocampal culture study shows that norepinephrine and 5-HT differentially induce the ex- pression and release of BDNF. Serotonin elicits an earlier, but less sustained expression and release of BDNF, whereas norepinephrine elicits more delayed and more sustained release of the neurotrophin. Together, both neurotransmitters cover the entire time scale evaluated. In addition, for each neurotransmitter, the amount of BDNF in cell lysates shortly preceded those in the media. Consistent with their induced expression of BDNF, acti- vation of TrkB, CREB and the PI-3 K/Akt, but not the MAPK pathway was sustained throughout the time course evaluated. These results, taken together along with those of our earlier study [24], provide a further insight into the possible mechanisms of neurotransmitter action such as that which occurs with physical exercise and/or antidepressant therapy. REFERENCES [1] A. Gärtner and V. Staiger, “Neurotrophin Secretion from Hippocampal NeuronsEvoked by Long-Term-Potentia- tion-Inducing Electrical Stimulation Patterns,” Proceed- ings of the National Academy of Sciences USA, Vol. 99, No. 9, 2002, pp. 6386-6391. http://dx.doi.org/10.1073/pnas.092129699 [2] M. E. Hopkins, R. Nitecki and D. J. Bucci, “Physical Exercise during Adolescence versus Adulthood: Differ- ential Effects on Object Recognition Memory and BDNF Levels,” Neuroscience, Vol. 194, 2011, pp. 84-94. http://dx.doi.org/10.1016/j.neuroscience.2011.07.071 [3] T. Kobilo, Q-R. Liu, K. Gandhi, M. Mughal, Y. Shaham and H. van Praag, “Running Is the Neurogenic and Neu- rotrophic Stimulus in Environmental Enrichment,” Lear- ning & Memory, Vol. 18, No. 9, 2011, pp. 605-609. http://dx.doi.org/10.1101/lm.2283011 [4] G. Baj, V. D’Alessandro, L. Musazzi, A. Mallei, C. R. Open Access NM  Kinetics of Norepinephrine- and Serotonin-Induced BDNF Release in Cultured Embryonic Hippocampal Neurons 205 Sartori, M. Sciancalepore, D. Tardito, F. Langone, M. Popoli and E. Tongiorgi, “Physical Exercise and Antide- pressants Enhance BDNF Targeting in hippocampal CA3 Dendrites: Further Evidence of a Spatial Code for BDNF Splice Variants,” Neuropsychopharmacology, Vol. 37, No. 7, 2012, pp. 1600-1611. http://dx.doi.org/10.1038/npp.2012.5 [5] Y. Yagasaki, T. Numakawa, E. Kumamaru, T. Hayashi, T.-P. Su and H. Kunugi, “Chronic Antidepressants Poten- tiate via Sigma-1 Receptors the Brain-Derived Neurotro- phic Factor-Induced Signaling for Glutamate Release,” Journal of Biological Chemistry, Vol. 281, No. 18, 2006, pp. 12941-12949. http://dx.doi.org/10.1074/jbc.M508157200 [6] P. Rasmussen, P. Brassard, H. Adser, M. V. Pedersen, L. Leick, E. Hart, N. H. Secher, B. K. Pedersen and H. Pile- gaard, “Evidence for a Release of Brain-Derived Neuro- trophic Factor from the Brain During Exercise,” Experi- mental Physiology, Vol. 94, No. 10, 2009, pp. 1062-1069. http://dx.doi.org/10.1113/expphysiol.2009.048512 [7] A. A. Russo-Neustadt and M. J. Chen, “Brain-Derived Neurotrophic Factor and Antidepressant Activity,” Cur- rent Pharmaceutical Design, Vol. 11, No. 12, 2005, pp. 1495-1510. http://dx.doi.org/10.2174/1381612053764788 [8] M. J. Chen, A. A. Russo-Neustadt, “Running Exer- cise-Induced Up-Regulation of Hippocampal Brain-De- rived Neurotrophic Factor is CREB-Dependent,” Hippo- campus, Vol. 19, No. 10, 2009, pp. 962-972. http://dx.doi.org/10.1002/hipo.20579 [9] M. C. Lee, M. Okamoto, Y. F. Liu, K. Inoue, T. Matsui, H. Nogami and H. Soya, “Voluntary Resistance Running with Short Distance Enhances Spatial Memory Related to Hippocampal BDNF Signaling,” Journal of Applied Phy- siology, Vol. 113, No. 8, 2012, pp. 1260-1266. http://dx.doi.org/10.1152/japplphysiol.00869.2012 [10] A. Balkowiec and D. M. Katz, “Cellular Mechanisms Regulating Activity-Dependent Release of Native Brain- Derived Neurotrophic Factor from Hippocampal Neu- rons,” Journal of Neuroscience, Vol. 22, No. 23, 2002, pp. 10399-10407. [11] F. Zafra, D. Lindholm, E. Castrén, J. Hartikka, and H. Thoenen, “Regulation of Brain-Derived Neurotrophic Factor and Nerve Growth Factor mRNA in Primary Cul- tures of Hippocampal Neurons and Astrocytes,” Journal of Neuroscience, Vol. 12, No. 12, 1992, pp. 4793-4799. [12] A. Androutsellis-Theotokis, W. J. McCormack, H. F. Bradford, G. M. Stern and F. B. Pliego-Rivero, “The De- polarisation-Induced Release of [125I]BDNF from Brain Tissue,” Brain Research, Vol. 743, No. 1-2, 1996, pp. 40- 48. http://dx.doi.org/10.1016/S0006-8993(96)00981-X [13] M. Hartmann, R. Heumann and V. Lessmann, “Synaptic Secretion of BDNF after High-Frequency Stimulation of Glutamatergic Synapses,” EMBO Journal, Vol. 20, No. 21, 2001, pp. 5887-5897. http://dx.doi.org/10.1093/emboj/20.21.5887 [14] M. Kojima, N. Takei, T. Numakawa, Y. Ishikawa, S. Suzuki, T. Matsumoto, R. Katoh-Semba, H. Nawa and H. Hatanaka, “Biological Characterization and Optical Im- aging of Brain-Derived Neurotrophic Factor-Green Fluo- rescent Protein Suggest an Activity-Dependent Local Re- lease of Brain-Derived Neurotrophic Factor in Neurites of Cultured Hippocampal Neurons,” Journal of Neurosci- ence Research, Vol. 64, No. 1, 2001, pp. 1-10. http://dx.doi.org/10.1002/jnr.1080 [15] J. Goggi, I. A. Pullar, S. L. Carney and H. F. Bradford, “The Control of [125I]BDNF Release from Striatal Rat Brain Slices,” Brain Research, Vol. 967, No. 1-2, 2003, pp. 201-209. http://dx.doi.org/10.1016/S0006-8993(03)02225-X [16] S. Santi, S. Cappello, M. Riccio, M. Bergami, G. Aicardi, U. Schenk, M. Matteoli and M. Canossa, “Hippocampal Neurons Recycle BDNF for Activity-Dependent Secre- tion and LTP Maintenance,” The EMBO Journal, Vol. 25, No. 18, 2006, pp. 4372-4380. http://dx.doi.org/10.1038/sj.emboj.7601303 [17] J. Yang, C.-J. Siao, G. Nagappan, T. Marinic, D. Jing, K. McGrath, Z.-Y. Chen, W. Mark, L. Tessarollo, F. S. Lee, B. Lu and B. L. Hempstead, “Neuronal Release of Pro- BDNF,” Nature Neuroscience, Vol. 12, No. 2, 2009, pp. 113-115. http://dx.doi.org/10.1038/nn.2244 [18] A. M. Marini, S. J. Rabin, R. H. Lipsky and I. Mocchetti, (1998) “Activity-Dependent Release of Brain-Derived Neurotrophic Factor Underlies the Neuroprotective Effect of N-Methyl-D-Aspartate,” Journal of Biological Chem- istry, Vol. 273, No. 45, 1998, pp. 29394-29399. http://dx.doi.org/10.1074/jbc.273.45.29394 [19] R. H. Lipsky, K. Xu, D. Zhu, C. Kelly, A. Terhakopian, A. Novelli and A. M. Marini, “Nuclear Factor Kappa B is a Critical Determinant in N-Methyl-D-Aspartate Recep- tor-Mediated Neuroprotection,” Journal of Neurochemis- try, Vol. 78, No. 2, 2001, pp. 254-264. http://dx.doi.org/10.1046/j.1471-4159.2001.00386.x [20] X. Wu, D. Zhu, X. Jiang, P. Okagaki, K. Mearow, G. Zhu, S. McCall, K. Banaudha, R. H. Lipsky and A. M. Marini, “AMPA Protects Cultured Neurons against Glutamate Excitotoxicity through a Phosphatidylinositol 3-Kinase- Dependent Activation in Extracellular Signal-Regulated Kinase to Upregulate BDNF Gene Expression,” Journal of Neurochemistry, Vol. 90, No. 4, 2004, pp. 807-818. http://dx.doi.org/10.1111/j.1471-4159.2004.02526.x [21] X. Jiang, F. Tian, K. Mearow, P. Okagaki, R. H. Lipsky and A. M. Marini, “The Excitoprotective Effect of N-Methyl-D-Aspartate Receptors is Mediated by a Brain- Derived Neurotrophic Factor Autocrine Loop in Cultured Hippocampal Neurons,” Journal of Neurochemistry, Vol. 94, No. 3, 2005, pp. 713-722. http://dx.doi.org/10.1111/j.1471-4159.2005.03200.x [22] R. Kolarow, T. Brigadski and V. Lessmann, “Postsynap- tic Secretion of BDNF and NT-3 from Hippocampal Neurons Depends on Calcium-Calmodulin Kinase II Sig- naling and Proceeds via Delayed Fusion Pore Opening,” Journal of Neuroscience, Vol. 27, No. 39, 2007, pp. 10350-10364. http://dx.doi.org/10.1523/JNEUROSCI.0692-07.2007 [23] E. C. Gunther, C. S. Von Bartheld, L. J. Goodman, J. E. Johnson and M. Bothwell, “The G-Protein Inhibitor, Per- tussis Toxin, Inhibits the Secretion of Brain-Derived Neu- rotrophic Factor,” Neuroscience, Vol. 100, No. 3, 2000, pp. 569-579. Open Access NM  Kinetics of Norepinephrine- and Serotonin-Induced BDNF Release in Cultured Embryonic Hippocampal Neurons 206 http://dx.doi.org/10.1016/S0306-4522(00)00309-2 [24] M. J. Chen, T. V. Nguyen, C. J. Pike and A. A. Russo- Neustadt, “Norepinephrine Induces BDNF and Activates the PI-3K and MAPK Cascades in Embryonic Hippocam- pal Neurons,” Cellular Signaling, Vol. 19, No. 1, 2007, pp. 114-128. http://dx.doi.org/10.1016/j.cellsig.2006.05.028 [25] N. J. Patel, M. J. Chen and A. A. Russo-Neustadt, “Nor- pinephrine and Nitric Oxide Promote Cell Survival Sig- naling in Hippocampal Neurons,” European Journal of Pharmacology, Vol. 633, No. 1-3, 2010, pp. 1-9. http://dx.doi.org/10.1016/j.ejphar.2010.01.012 [26] D. Yang, M. Chen and A. Russo-Neustadt, “Antidepres- sants are Neuroprotective Against Nutrient Deprivation Stress in Hippocampal Neurons,” European Journal of Neuroscience, Vol. 36, No. 5, 2012, pp. 2573-2587. http://dx.doi.org/10.1111/j.1460-9568.2012.08187.x [27] R. K. Dishman, K. J. Renner, J. E. Whitte-Welkley, K. A. Burke, B. N. Bunnell, “Treadmill Exercise Training Augments Brain Norepinephrine Response to Familiar and Novel Stress,” Brain Research Bulletin, Vol. 52, No. 5, 2000, pp. 337-342. http://dx.doi.org/10.1016/S0361-9230(00)00271-9 [28] J. F. Cryan, O. F. O’Leary, S. H. Jin, J. C. Friedland, M. Ouyang, B. R. Hirsch, M. E. Page, A. Dalvi,S. A. Thomas and I. Lucki, “Norepinephrine-Deficient Mice Lack Re- sponses to Antidepressant Drugs, Including Selective Se- rotonin Reuptake Inhibitors,” Proceedings of the National Academy of Sciences USA, Vol. 101, No. 21, 2004, pp. 8186-8191. http://dx.doi.org/10.1073/pnas.0401080101 [29] D. J. Nutt, “The Neuropharmacology of Serotonin and Norepinephrine in Depression,” International Clinical Psychopharmacology, Vol. 17, Suppl. 1, 2002, pp. S1- S12. http://dx.doi.org/10.1097/00004850-200206001-00002 [30] J. E. Malberg and J. A. Blendy, “Antidepressant Action: To the Nucleus and Beyond,” Trends in Pharmacological Sciences, Vol. 26, No. 12, 2005, pp. 631-638. http://dx.doi.org/10.1016/j.tips.2005.10.005 [31] G. A. Banker and W. M. Cowan, “Rat Hippocampal Neu- rons in Dispersed Cell Culture,” Brain Research, Vol. 126, No. 3, 1977, pp. 397-442. http://dx.doi.org/10.1016/0006-8993(77)90594-7 [32] D. S. Cowan, N. N. Farley-Johnson and T. Travkina, “5-HT1A Receptors Couple to Activation of Akt, but not Extracellular-Regulated Kinase (ERK) in Cultured Hip- pocampal Neurons,” Journal of Neurochemistry, Vol. 93, No. 4, 2005, pp. 910-917. http://dx.doi.org/10.1111/j.1471-4159.2005.03107.x [33] U. K. Laemmli, “Cleavage of Structural Proteins During the Assembly of the Head of Bacteriophage T4,” Nature, Vol. 227, No. 5259, 1970, pp. 680-685. http://dx.doi.org/10.1038/227680a0 [34] A. Barnea, J. Roberts and S. D. Croll, “Continuous Ex- posure to Brain-Derived Neurotrophic Factor is Required for Persistent Activation of TrkB Receptor, the ERK Signaling Pathway, and the Induction of Neuropeptide Y Production in Cortical Cultures,” Brain Research, Vol. 1020, Vol. 1-2, 2004, pp. 106-117. [35] D. Lindholm, P. Carroll, G. Tzimagiorgis and H. Thoenen, “Autocrine-Paracrine Regulation of Hippocampal Neuron Survival by IGF-1 and the Neurotrophins BDNF, NT-3 and NT-4,” European Journal of Neuroscience, Vol. 8, No. 7, 1996, pp. 1452-1460. http://dx.doi.org/10.1111/j.1460-9568.1996.tb01607.x [36] W. J. Tyler and L. D. Pozzo-Miller, “BDNF Enhances Quantal Neurotransmitter Release and Increases the Number of Docked Vesicles at the Active Zones of Hip- pocampal Excitatory Synapses,” Journal of Neuroscience, Vol. 21, No. 12, 2001, pp. 4249-4258. [37] W. J. Tyler, S. P. Perrett and L. D. Pozzo-Miller, “The Role of Neurotrophins in Neurotransmitter Release,” The Neuroscientist, Vol. 8, No. 6, 2002, pp. 524-531. http://dx.doi.org/10.1177/1073858402238511 [38] W. J. Tyler, X.-L. Zhang, K. Hartman, J. Winterer, W. Muller, P. K. Stanton and L. Pozzo-Miller, “BDNF In- creases Release Probability and the Size of a Rapidly Recycling Vesicle Pool within Rat Hippocampal Excita- tory Synapses,” Journal of Physiology, Vol. 574, No. 3, 2006, pp. 787-803. http://dx.doi.org/10.1113/jphysiol.2006.111310 [39] I. Alleman, H. Fiumelli, P. J. Magistretti and J.-L. Martin, “Fluoxetine Regulates the Expression of Neurotro- phic/Growth Factors and Glucose Metabolism in Astro- cytes,” Psychopharmacology, Vol. 216, No. 1, 2011, pp. 75-84. http://dx.doi.org/10.1007/s00213-011-2190-y [40] P. R. Tsuruda, J. Yung, W. J. Martin, R. Chang, N. Mai and J. A. M. Smith, “Influence of Ligand Binding Ki- netics on Functional Inhibition of Human Recombinant Serotonin and Norepinephrine Transporters,” Journal of Pharmacological and Toxicological Methods, Vol. 61, No. 2, 2010, pp. 192-204. http://dx.doi.org/10.1016/j.vascn.2009.12.003 [41] D. Zhu, R. H. Lipsky and A. M. Marini, “Co-Activation of the Phosphatidylinositol-3-Kinase/Akt Signaling Path- way by N-Methyl-D-Aspartate and TrkB Receptors in Cerebellar Granule Cell Neurons,” Amino Acids, Vol. 23, No. 1-3, 2002, pp. 11-17. http://dx.doi.org/10.1007/s00726-001-0103-9 [42] H. Yano and M. V. Chao, “Neurotrophin Receptor Struc- ture and Interactions,” Pharmaceutica Acta Helvetiae, Vol. 74, No. 2-3, 2000, pp. 253-260. http://dx.doi.org/10.1016/S0031-6865(99)00036-9 [43] Q. Ma, “Beneficial Effects of Moderate Voluntary Physi- cal Exercise and Its Biological Mechanisms on Brain Health,” Neuroscience Bulletin, Vol. 24, No. 4, 2008, pp. 265-270. http://dx.doi.org/10.1007/s12264-008-0402-1 [44] V. Lessmann, K. Gottmann and M. Malcangio, “Neuro- trophin Secretion: Current Facts and Future Prospects,” Progress in Neurobiology, Vol. 69, No. 5, 2003, pp. 341- 374. http://dx.doi.org/10.1016/S0301-0082(03)00019-4 [45] C.-P. Shen, Y. Tsimberg, C. Salvadore and E. Meller, “Activation of Erk and JNK MAPK Pathways by Acute Swim Stress in Rat Brain Regions,” BMC Neuroscience, Vol. 5, 2004, pp. 36. http://dx.doi.org/10.1186/1471-2202-5-36 [46] G. Aicardi, E. Argilli, S. Cappello, S. Santi, M. Riccio, H. Thoenen and M. Canossa, “Induction of Long-Term Po- Open Access NM  Kinetics of Norepinephrine- and Serotonin-Induced BDNF Release in Cultured Embryonic Hippocampal Neurons Open Access NM 207 tentiation and Depression is Reflected by Corresponding Changes in Secretion of Endogenous Brain-Derived Neurotrophic Factor,” Proceedings of the National Aca- demy of Sciences of the United States of America, Vol. 101, No. 44, 2004, pp. 15788-15792. http://dx.doi.org/10.1073/pnas.0406960101 [47] V. Lessmann and T. Brigadski, “Mechanisms, Locations, and Kinetics of Synaptic BDNF Secretion: An Update,” Neuroscience Research, Vol. 65, No. 1, 2009, pp. 11-22. http://dx.doi.org/10.1016/j.neures.2009.06.004 [48] I. Buldyrev, N. M. Tanner, H.-Y. Hsieh, E. G. Dodd, L. T. Nguyen and A. Balkowiec, “Calcitonin Gene-Related Peptide Enhances Release of Native Brain-Derived Neu- rotrophic Factor from Trigeminal Ganglion Neurons,” Journal of Neurochemistry, Vol. 99, No. 5, 2006, pp. 1338-1350. http://dx.doi.org/10.1111/j.1471-4159.2006.04161.x [49] T. Brigadski, M. Hartmann and V. Lessmann, “Differen- tial Vesicular Targeting and Time Course of Synaptic Se- cretion of the Mammalian Neurotrophins,” Journal of Neuroscience, Vol. 25, No. 33, 2005, pp. 7601-7614. http://dx.doi.org/10.1523/JNEUROSCI.1776-05.2005 [50] M. Bergami, S. Santi, E. Formaggio, C. Cagnoli, C. Verderio, R. Blum, B. Berninger, M. Matteoli and M. Canossa, “Uptake and Recycling of Pro-BDNF for Tran- smitter-Induced Secretion by Cortical Astrocytes,” Jour- nal of Cell Biology, Vol. 183, No. 2, 2008, pp. 213-221. http://dx.doi.org/10.1083/jcb.200806137
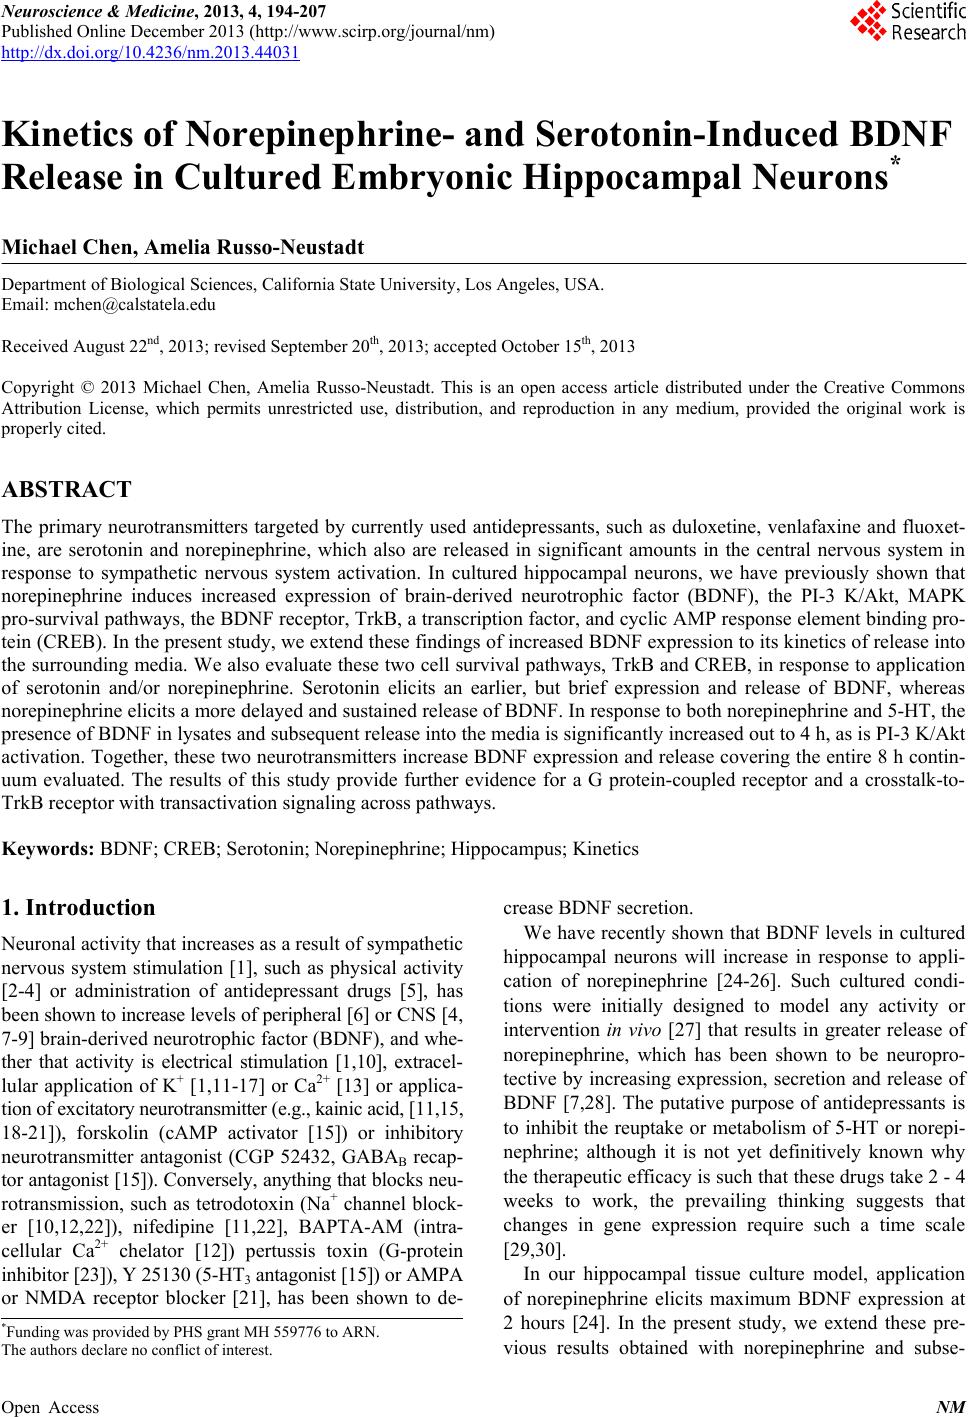
|