Journal of Computer and Communications, 2013, 1, 19-22
Published Online December 2013 (http://www.scirp.org/journal/jcc)
http://dx.doi.org/10.4236/jcc.2013.17005
Open Access JCC
19
In Deep UV Quantitativ e Anal ys is of Multi-Element Low
Alloy Steel by Laser-Induced Breakdown Spectroscopy
Yong Xin, Lanxiang Sun*, Zhibo Cong, Lifeng Qi, Yang Li, Zhijia Yang
Lab. of Networked Control Systems, Shenyang Institute of Automation, Chinese Academy of Sciences, Shenyang 110016, China.
Email: xinyong@sia.cn, *sunlanxiang@sia.cn
Received August 2013
ABSTRACT
The multi-element components of low alloy steel were quantified by using laser-induced breakdown spectroscopy
(LIBS) in deep UV. The Nd:YAG pulsed laser was used to produce plasma. The spectrum was simultaneously obtained
by deep UV spectrometer. This paper studied the influence of experiment parameters on LIBS spectral intensity, such as
delay, energy of laser, and the distance between the focusing lens and the surface of the sample. With the optimal exp e-
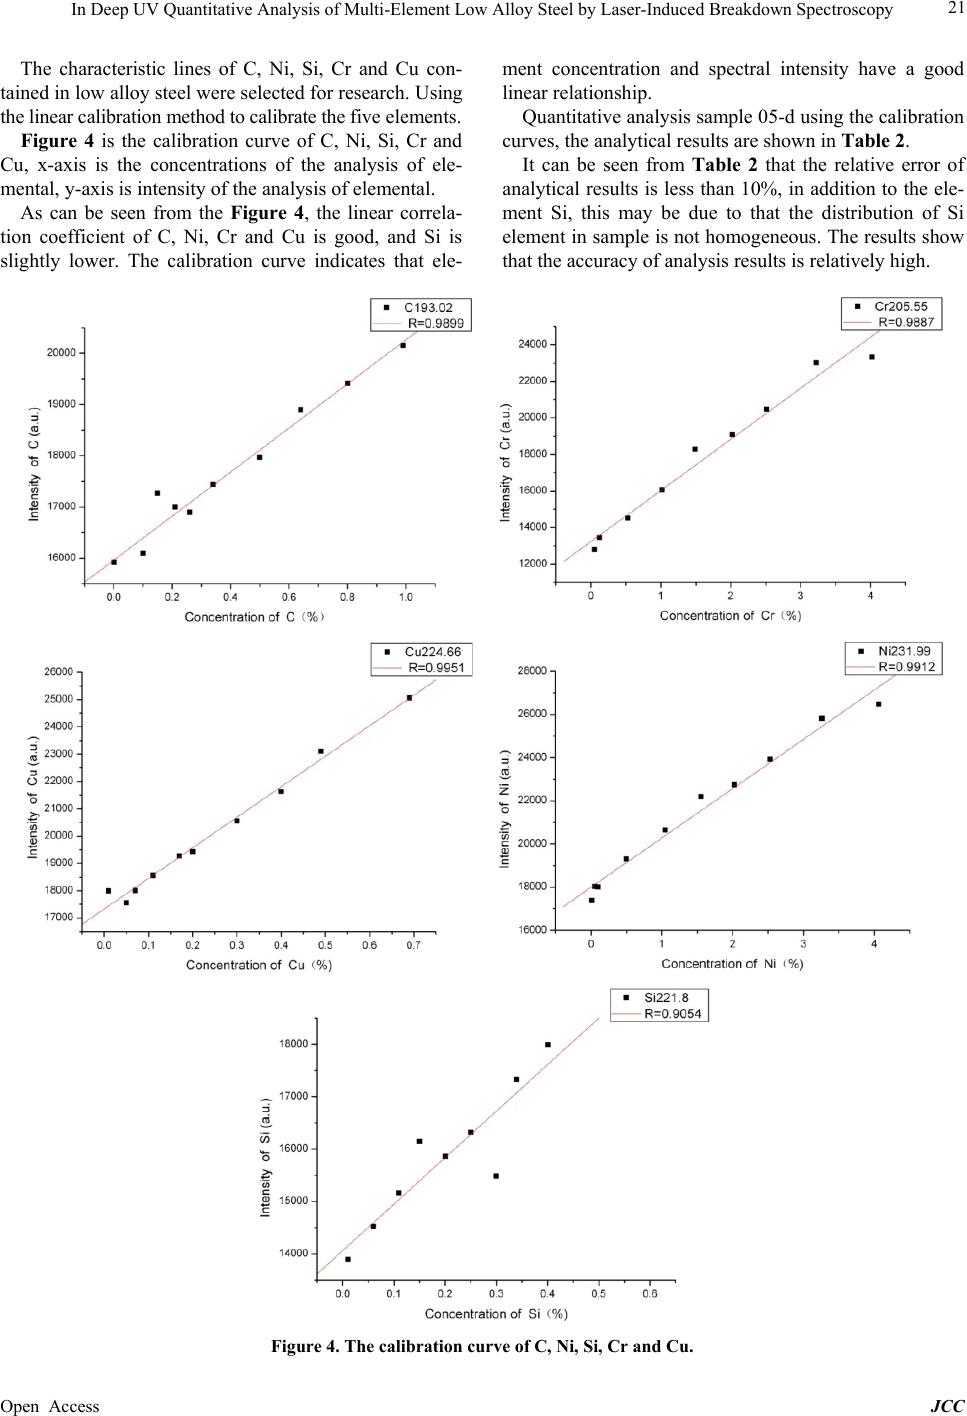
riment parameters, the characteristic lines of C, Ni, Si, Cr and Cu contained in low alloy steel were selected for quantit -
ative analysis and the calibration curves of these elements were obtained. The linear correlation coefficient was good.
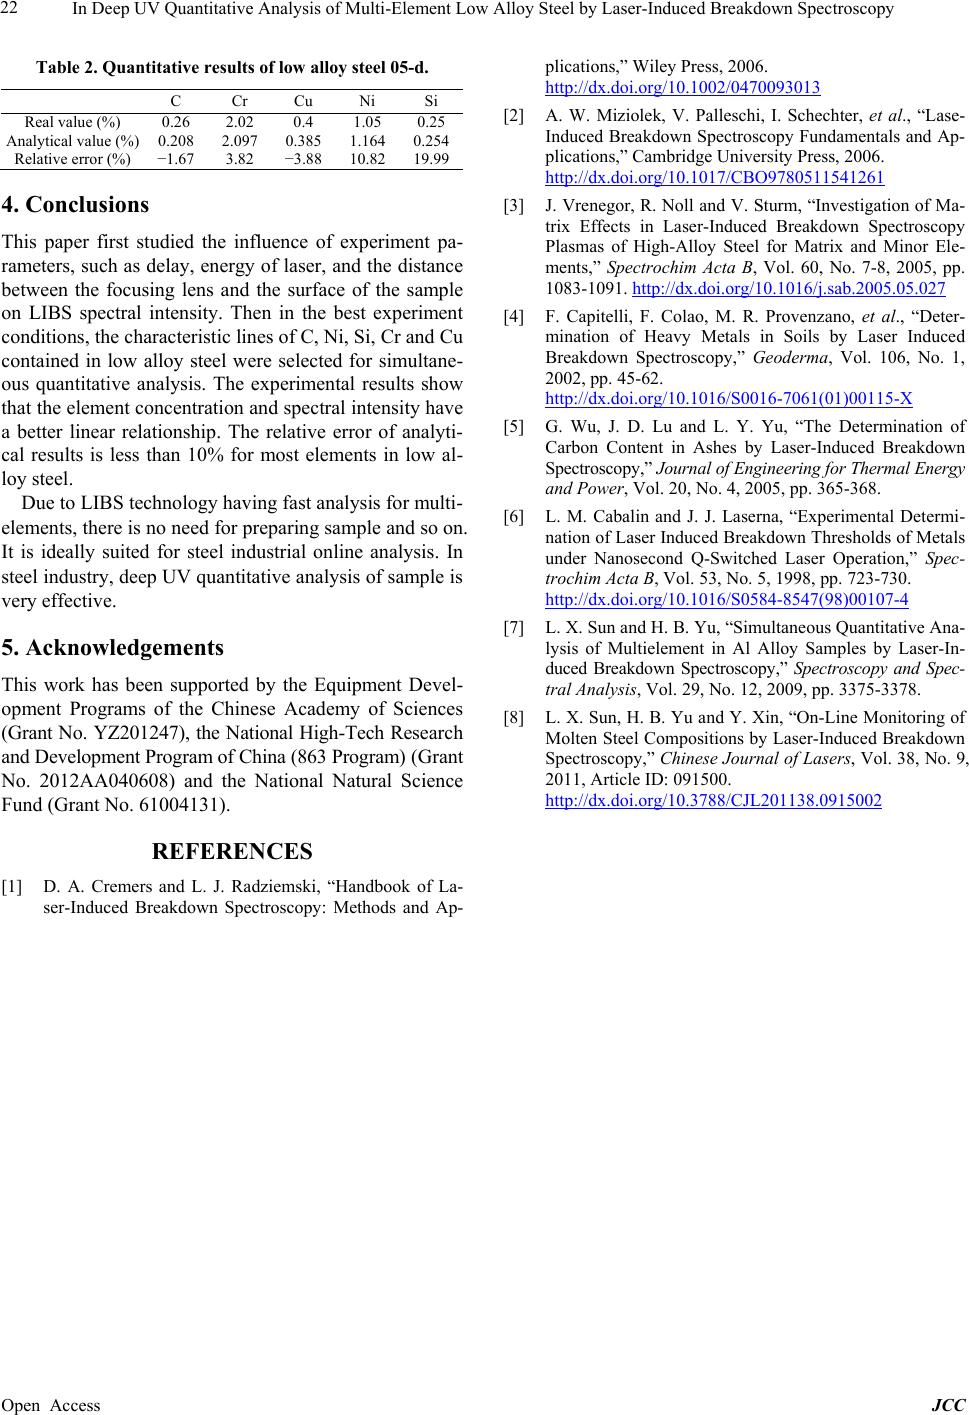
Using the calibration curves to quantitative analysis for the sample 05-d, and the relative error of analytical results is
less than 10% for most elements.
Keywords: Laser-Induced Breakdown Spectroscopy; Plasma; Quantitative Analysis; Deep UV
1. Introduction
Laser-Induced Breakdown Spectroscopy (LIBS) is a re-
cently developed qualitative and quantitative technology
that is based on the interaction of laser and material. Due
to its simultaneous and fast analysis for multi-elements,
no need for preparing sample and simultaneous determi-
nation of solid, liquid and gas, LIBS attracted attentions
of scholars at home and abroad [1-8], and had significant
application value. NOLL team of Germany ILT [3] adopted
LIBS to analyze the component of solid high alloyed
steel and made quantitative analysis for nine elements
including Ni, Cr, Cu, Mo, Si, Ti, Mn, Al, and C. Capitelli
et al. [4] analyzed the content of Cr, Cu, Fe, Mn and Ni
etc., but the result was not as good as that of ICP-OES.
Lu Jidong [5] form Huazhong University of Science and
Technology studied the carbon content of ashes by LIBS
technology. In addition, Sun lanxiang et al. [7,8] from
Shenyang Institute of Automation Chinese Academy of
Science also made a series of researches on steel alloy by
LIBS.
In the steel industry, it is very important for real-time
online analysis of C, Si, Cr, etc., element of the compo-
nent content. For the C element, the characteristic line
193.03 nm has no strong influence on other lines. So we
choose a deep UV, high resolution of spectrometer (175
nm - 250 nm) to collect the signal of plasma spectrum.
Since LIBS experiment is susceptible to the influence
of laser energy, wavelength, surrounding environment and
delay, etc., the fluctuation of experiment data is large,
and the accuracy is not high. Therefore, there are many
problems that need to be solved in quantitative analysis.
In this pape r , we first systematically studied the influence
of experiment parameters on LIBS spectral intensity,
then in the optimum parameters. The C, Ni, Si, Cr and
Cu in low-alloy steel were quantitatively analyzed.
2. Experimental
2.1. Experimental System
As shown in Figure 1, the experimental system is self-
built. The lase r is Nd:Y AG pulse laser ( CFR20 0, Big Sky
Company) with a wavelength of 1064 nm, pulse width of
10 ns, and the largest pulse energy of 200 mJ. The deep
UV fiber optic spectrometer (AvaSpec-ULS2048-USB2)
has a response wavelength of 175 - 250 nm, optical res-
olution of 0.05 - 0.08 nm (FWHM) and shortest inte-
gration time of 1ms. The signal delay controller is
self-developed trigger module suitable to the LIBS sys-
tem.
The experimental process: the laser of 1064 nm was
reduced by laser attenuator to appropriate energy and then
was focused onto sample by plano-convex lens with a
focal length of 150 mm to produce plasma. The plasma
*
Corresponding author.
In Deep UV Quantitative Analysis of Multi-Element Low Alloy Steel by Laser -Induced Breakdown Spectroscopy
Open Access JCC
20
spectrum was focused onto fiber optic spectrometer
by collection system, and the spectrum was finally ob-
tained. In this experiment, the energy is monitored
real-time by energy meter and the delay between laser
and spectrometer is controlled by signal delay control-
ler.
2.3. Analysis Sample
The analysis sample is low alloy steel standards, which is
made in JFE Techno-Research Corporation of Japan. The
composi tion of low alloy steel is shown in Table 1.
Figure 1. The schematic diagram of the LIBS experiment
setup.
3. Result and Discussion
3.1. The Influence of Experimental
Parameters on the Spectrum
The early evolution of laser-induced plas ma, ther e is strong
continuous background radiation. The characteristic lines
are submerged in a continuous background radiation. Due
to the spectral intensity of the continuous background
decay rate faster than the characteristic lines, the signal
to noise ratio of lines will r each the maximum at a time.
So choose a suitable delay is crucial for LIBS spectros-
copy.
The distance between the focusing lens and the surface
of the sample will determine the size of focus spot, and
will affect the power density of the laser, which is fo-
cused on the sample surface, so it will have an important
effect on plasma spectroscopy.
As Figures 2 and 3 show, the best experiment condi-
tion: delay is 0.83 us, the distance between the focusing
lens and the surface of the sample is 145 mm (focal
length is 150 mm), pules energy is 140 mJ.
3.2. Quantitative Analysis
During the experiment, before testing the sample, the
sample is conducted with pre-treatment (shot by laser for
30 times) to remove the oxide layer and impurity on the
sample surface. 300 data were collected under each ex-
periment condition.
Table 1. Composition of Samples.
Sample
No. Concentration%
C Si Ni Cr Cu Mn P S Mo V Ti
01-g
02-d
03-d
04-d
05-d
06-d
07-d
08-d
09-d
10-d
0.0009
0.1
0.149
0.21
0.26
0.34
0.5
0.64
0.8
0.99
<0.01
0.6
0.4
0.06
0.25
0.34
0.3
0.15
0.2
0.11
0.01
0.05
0.1
0.5
1.05
1.55
2.02
2.53
3.26
4.06
0.01
4.02
3.22
2.51
2.02
1.49
1.02
0.53
0.12
0.05
0.01
0.07
0.69
0.11
0.4
0.49
0.2
0.3
0.17
0.05
0.01
0.15
0.75
2.0
1.6
1.29
1.02
0.51
0.31
0.1
0.01
-
-
0.008
0.013
0.048
0.038
0.028
0.018
0.003
0.002
0.0032
0.006
0.016
0.0017
0.0013
0.026
0.02
0.0029
0.009
0.001
0.5
0.4
0.3
0.092
0.2
0.6
1.02
0.82
0.059
0.001
0.4
0.027
-
0.3
0.058
0.11
0.16
0.2
0.49
0.001
0.022
0.1
0.3
0.014
0.054
0.2
0.16
-
-
Figure 2. The delay versus the intensity of spectrum.
Figure 3. The distance versus the intensity of spectrum.
In Deep UV Quantitative Analysis of Multi-Element Low Alloy Steel by Laser -Induced Breakdown Spectroscopy
Open Access JCC
21
The characteristic lines of C, Ni, Si, Cr and Cu con-
tained in low alloy steel were selected for research. Using
the linear calibration method to ca libra te t he five elements.
Figure 4 is the calibration curve of C, Ni, Si, Cr and
Cu, x-axis is the concentrations of the analysis of ele-
mental, y-axis is intensity of the analysis of elemental.
As can be seen from the Figure 4, the linear correla-
tion coefficient of C, Ni, Cr and Cu is good, and Si is
slightly lower. The calibration curve indicates that ele-
ment concentration and spectral intensity have a good
linear relationship.
Quantitative analysis sample 05-d using the calibration
curves, the analytical results are shown in Table 2 .
It can be seen from Table 2 that the relative error of
analytical results is less than 10%, in addition to the ele-
ment Si, this may be due to that the distribution of Si
element in sample is not homogeneous. The results show
that the accuracy of analysis results is relatively high.
Figure 4. The calibration curve of C, Ni, Si, Cr and Cu.
In Deep UV Quantitative Analysis of Multi-Element Low Alloy Steel by Laser -Induced Breakdown Spectroscopy
Open Access JCC
22
Table 2. Quantitative results of low alloy steel 05-d.
C Cr Cu Ni Si
Analytical value (%)
0.26
0.208
1.67
2.02
2.097
3.82
0.4
0.385
3.88
1.05
1.164
10.82
0.25
0.254
19.99
4. Conclusions
This paper first studied the influence of experiment pa-
rameters, such as delay, energy of laser, and the distance
between the focusing lens and the surface of the sample
on LIBS spectral intensity. Then in the best experiment
conditions, the characteristic lines of C, Ni, Si, Cr and Cu
contained in low alloy steel were selected for simultane-
ous quantitative analysis. The experimental results show
that the element concentration and spectral intensity have
a better linear relationship. The relative error of analyti-
cal results is less than 10% for most elements in low al-
loy steel.
Due to LIBS technology having fast analysis for multi-
elements, ther e is no need for preparing sample and so on.
It is ideally suited for steel industrial online analysis. In
steel industry, deep UV quantitative analysis of sample is
very effective.
5. Acknowledgements
This work has been supported by the Equipment Devel-
opment Programs of the Chinese Academy of Sciences
(Grant No. YZ201247), the National High-Tech Research
and Development Program of China (863 Program) (Grant
No. 2012AA040608) and the National Natural Science
Fund (Grant No. 61004131).
REFERENCES
[1] D. A. Cremers and L. J. Radziemski, “Handbook of La-
ser-Induced Breakdown Spectroscopy: Methods and Ap-
plications,” Wiley Press, 2006.
http://dx.doi.org/10.1002/0470093013
[2] A. W. Miziolek, V. Palleschi, I. Schechter, et al., “Lase-
Induced Breakdown Spectroscopy Fundamentals and Ap-
plications,” Cambridge University Press, 2006.
http://dx.doi.org/10.1017/CBO9780511541261
[3] J. Vrenegor, R. Noll and V. Sturm, “Investigation of Ma-
trix Effects in Laser-Induced Breakdown Spectroscopy
Plasmas of High-Alloy Steel for Matrix and Minor Ele-
ments,” Spectrochim Acta B, Vol. 60, No. 7-8, 2005, pp.
1083-1091. http://dx.doi.org/10.1016/j.sab.2005.05.027
[4] F. Capitelli, F. Colao, M. R. Provenzano, et al., “Deter-
mination of Heavy Metals in Soils by Laser Induced
Breakdown Spectroscopy,” Geoderma, Vol. 106, No. 1,
2002, pp. 45-62.
http://dx.doi.org/10.1016/S0016-7061(01)00115-X
[5] G. Wu, J. D. Lu and L. Y. Yu, “The Determination of
Carbon Content in Ashes by Laser-Induced Breakdown
Spectroscopy,” Journal of Enginee ring for Thermal Ene rgy
and Power, Vol. 20, No. 4, 2005, pp. 365-368.
[6] L. M. Cabalin and J. J. Laserna, “Experimental Determi-
nation of Laser Induced Breakdown Thresholds of Metals
under Nanosecond Q-Switched Laser Operation,” Spec-
trochim Acta B, Vol. 53, No. 5, 1998, pp. 723-730.
http://dx.doi.org/10.1016/S0584-8547(98)00107-4
[7] L. X. Sun and H. B. Yu, “Simultaneous Quantitative Ana-
lysis of Multielement in Al Alloy Samples by Laser-In-
duced Breakdown Spectroscopy,” Spectroscopy and Spec-
tral Analysis, Vol. 29, No. 12, 2009, pp. 3375-3378.
[8] L. X. Sun, H. B. Yu and Y. Xin, “On-Li ne Monitoring of
Molten Steel Compositions by Laser-Induced Breakdown
Spectroscopy,” Chinese Journal of Lasers, Vol. 38, No. 9,
2011, Article ID: 091500.
http://dx.doi.org/10.3788/CJL201138.0915002