 J. Biomedical Science and Engineering, 2011, 4, 136-145 doi:10.4236/jbise.2011.42020 Published Online February 2011 (http://www.SciRP.org/journal/jbise/ JBiSE ). Published Online February 2011 in SciRes. http://www.scirp.org/journal/JBiSE Mathematical modeling of the biphasic dopaminergic response to glucose Matthias Chung1, Britta Göbel2, Achim Peters3, Kerstin M. Oltmanns4, Andr eas Moser5 1Department of Mathematics, Texas State University, San Marcos, USA; 2Institute of Mathematics and Image Computing, Graduate School for Computing in Medicine and Life Sciences, University of Lübeck, Lübeck, Germany; 3Medical Clinic I, University of Lübeck, Lübeck, Germany; 4Department of Psychiatry and Psychotherapy, University of Lübeck, Lübeck, Germany; 5Department of Neurology, University of Lübeck, Lübeck, Germany. E-mail: mc85@txstate.edu; goebel@mic.uni-luebeck.de Received 3 November 2010; revised 9 December 2010; accepted 12 January 2011. ABSTRACT In this work, we specify potential elements of the brain to sense and regulate the energy metabolism of the organism. Our numerical investigations base on neurochemical experiments demonstrating a biphasic association between brain glucose level and neuronal activity. The dynamics of high and low affine KATP channels are most likely to play a decisive role in neuronal activity. We develop a coupled Hodgkin-Huxley model describing the in- teractive behavior of inhibitory GABAergic and excitatory dopaminergic neurons projecting into the caudate nucleus. The novelty in our approach is that we include the synaptic coupling of GA BAergic and dopaminergic neurons as well as the interac- tion of high and low affine KATP channels. Both are crucial mechanisms described by kinetic models. Simulations demonstrate that our new model is co- herent with neurochemical in vitro experiments. Even experimental interventions with glibencla- mide and glucosamine are reproduced by our new model. Our results show that the considered dy- namics of high and low affine KATP channels may be a driving force in energy sensing and global reg- ulation of the energy metabolism, which supports central aspects of the new Selfish Brain Theory. Moreover, our simulations suggest that firing fre- quencies and patterns of GABAergic and dopa- minergic neurons are correlated to their neuro- chemical outflow. Keywords: Neuronal Model; Coupled Neurons; Dopa- mine; GABA; K-ATP Channels; Biphasic; Glibencla- mide; Glucosamine 1. INTRODUCTION Neurochemical experiments show that extracellular glu- cose level influences the neurochemical activity of neu- rons. More precisely, Steinkamp and colleagues showed that decreasing glucose levels cause a neuronal biphasic response [1]. In their study, slices of the rat caudate nu- cleus are examined in vitro in a superfusion chamber treated by artificial cerebrospinal fluid. The glucose lev- el in the fluid varies from 0 to 10 mM while the dopa- mine outflow is measured concomitantly. The effect of different glucose concentrations on dopamine and GA- BA (γ-aminobutyric acid) outflow is investigated by means of high-performance liquid chromatography and electrochemical detection. We will focus on the neuro- chemical mechanisms in Section 2.1. During glucose reduction from 10 to 0 mM, a biphasic effect on dopamine outflow can be observed, Figure 1(a). In the first phase (glucose concentration of 10 down to 7 mM in the incubation medium), an increase in dopamine outflow is observed. This phase is followed by a decline of dopamine outflow at glucose concentrations from 6 down to 0 mM. To investigate the modes of action, Steinkamp et al. repeated this experiment with three dif- ferent interventions. First, they added glibenclamide in a concentration of 1 µM to the cerebrospinal fluid changing the dopaminergic outflow, Figure 1(c). While dopamine outflow remains unchanged at high glucose levels, its outflow is reversed in the second phase (glucose levels lower than 4 mM). In a second intervention, Steinkamp and colleagues increased the glibenclamide concentration in the cerebrospinal fluid to 10 µM. Here, the effects of glucose variation on dopa- mine is completely antagonized, both phases are annihi- lated, Figure 1(d). The third intervention adds glucosa- mine to the cerebrospinal fluid (5 mM). Here, biphasic dopamine outflow is completely abolished, Figure 1(b).  M. Chung et al. / J. Biomedical Science and Engineering 4 (2011) 136-145 137 (a) (b) (c) (d) Figure 1. The effect of glucose reduction from 10 down to 0 mM on dopamine outflow in percent of basal level ± SD according to [1]. (a) Dopamine outflow under normal conditions. (b) Dopamine outflow in the absence (gray) and presence (black) of glucosamine (5 mM). (c) Dopamine outflow in the absence (gray) and presence (black) of glibenclamide (1 µM). (d) Dopamine outflow in the absence (gray) and presence (black) of glibenclamide (10 µM). We present a new mathematical model to deepen the understanding of the experimental observations and the underlying neurochemical processes. Our model consists of a coupled Hodgkin-Huxley model focusing on the interaction between dopaminergic and GABAergic neu- rons. Our model supports the plausibility of interacting KATP channels controlling the outflow of the neuro- transmitters dopamine and GABA. Moreover, our model suggests that the firing frequencies and pattern of dopa- minergic and GABAergic neurons are correlated to the actual outflow of dopamine and GABA. Before we present our model in Section 2.2, we ad- dress the neurochemical basis in the following Section 2.1. Section 3 shows our simulation results. We close our investigations with a discussion in Section 4. 2. METHODS Before we develop our mathematical modeling, we in- vestigate the underlying neurochemical mechanisms, describing the interaction and the signaling of dopa- minergic and GABAergic neurons. 2.1. Neuro ch emical Mechani sms Extracellular glucose passes cell membrane barriers of neurons via its specific glucose transporters, i.e., GLUT3 located on neuronal membranes. GLUT3 is a passive glu- cose transporter. Therefore, intra- and extracellular glucose concentrations are given by a diffusion process [2], and the transport is only driven by the concentration gradient. In the cytoplasm, glucose is instantly converted into glu- C opyright © 2011 SciRes. JBiSE  M. Chung et al. / J. Biomedical Science and Engineering 4 (2011) 136-145 138 cose-6-phosphate and afterwards, decomposed to ATP (adenosine triphosphate) through glycolysis and respira- tory chain. This mechanism provides ATP as the essential energy source for neurons, see Figur e 2 (top left). KATP channels are divided into two classes. On the one hand, low affine KATP channels binding ATP only in high concentrations while, on the other hand, high affine KATP channels binding ATP even in low concen- trations. These channels are heterogeneously distributed on various types of neurons. Open KATP channels are permeable for potassium ions (K+ ions) diffusing through the cell membrane along the electrochemical gradient. An increase in ex- tracellular potassium leads to a hyperpolarization of the neuron, and action potentials cannot be generated. Intra- cellular binding of ATP to nucleotide binding sites or extracellular binding of sulfonylurea to KATP channels cause these channels to close, and a depolarization of the neuron becomes likely. Thereby, ATP concentrations directly affect the neuronal activity via KATP channels. When an action potential occurs, the synapses of do- paminergic neurons release dopamine as a neurotransmit- ter whereas GABAergic neurons release GABA. It has been shown that low affine KATP channels are densely distributed on GABAergic neurons while high affine KATP channels are highly concentrated on dopaminergic Figure 2. Schematic representation of the neurophysiological model of interacting dopaminergic and GABAergic neurons (right) with magnification of the intra-neuronal pathways (top left) and of the interneuronal synapse (bottom left). C opyright © 2011 SciRes. JBiSE  M. Chung et al. / J. Biomedical Science and Engineering 4 (2011) 136-145 139 neurons [3,4]. Hence, dopaminergic neurons are more active at low ATP concentrations than GABAergic neu- rons. The neurotransmitter GABA binds ionotropic GABAA receptors. Activated GABAA receptors lead to confor- mation changes within the membrane, i.e., open pores allow chloride ions (Cl− ions) to pass along the electro- chemical gradient. Typically, an influx of Cl− ions into the neuron occurs. Here, the neuron tends toward the resting potential. GABAA receptors are densely distrib- uted on the post-synaptic membrane of dopaminergic neurons so that the GABAergic neurons modulate do- pamine outflow by inhibition of dopaminergic activity. Evidence exists that systemic signal propagation from GABAergic onto dopaminergic neurons occurs in neu- ronal networks, see Figur e 2 (bottom left) [5]. In case of high extracellular glucose concentrations, low and high affine KATP channels bind ATP. Both neuron types fire and release their neurotransmitter. This implies a GABA mediated inhibition of dopamine out- flow, which is regulated by extracellular glucose via high and low affine KATP channels. When extracellular glucose decreases, the ATP concentration in the cyto- plasm drops and merely high affine KATP channels bind ATP causing these channels to close. The dopaminergic neurons release their neurotransmitter. Furthermore, the dopamine release is increased by reduced GABAergic activity. When the extracellular glucose concentration is further reduced, a decline of the neurotransmitter dopa- mine can be observed. In this phase, neither high nor low affine KATP channels bind ATP, and the dopaminergic and GABAergic neurons aspire towards their resting potential. This interpretation leads to the biphasic ob- servation shown in Figure 1(a). Glibenclamide extracellularly binds to sulfonylurea subunits of KATP channels resulting in a consecutive inhibition of the channels [6,7]. Hence, glibenclamide and intracellular ATP regulate the KATP channels in a similar manner. Adding a low concentration of gliben- clamide to the cerebrospinal fluid now leads to an eleva- tion of the dopaminergic outflow at low glucose concen- trations, see Figure 1(c). Since this intervention corre- sponds to a slightly elevated intraneuronal ATP concen- tration, the effect is predominant at low extracellular glucose concentrations. Adding a high concentration of glibenclamide leads to a permanent inhibition of the KATP channels, and a constant dopaminergic outflow can be observed, see Figure 1(d). Glucosamine inhibits glucose phosphorylation by hexokinases and therefore blocks ATP production through glycolysis. Adding glucosamine leads to a re- duction of the intracellular ATP concentration [8]. Hence, the biphasic dopamine outflow is completely abolished by adding glucosamine, see F igure 1(b) . To systemically analyze the neurochemical interaction between GABAergic and dopaminergic neurons and to simulate the experiments, we now turn to a mathematical model of a coupled neuronal system. Various mathe- matical models of single dopaminergic and GABAergic midbrain neurons have been investigated over the years. They range from single to multiple compartment models of single neurons, see [9,10,11,12]. A review on single dopaminergic neuron models by Kuznetsov et al. can be found online [13]. All of these detailed models base on a Hodgkin-Huxley type model and incorporate various currents and fluxes, such as T-, L-, and N-type calcium, potassium, hyperpolarization activated, and NMDA in- duced currents. Despite their detailed modeling ap- proaches most of these models fail to mirror realistic time series of synaptic stimulations [13,10]. These mod- els aim to investigate electrophysiological behavior. We do not aim to model the precise neurochemical behavior and realistic time series of synaptic stimulations of mid- brain dopaminergic and GABAergic neurons. Our focus is on the functional mechanism of glucose dependent neuronal activity and the synaptic coupling of GABAer- gic and dopaminergic neurons rather than on a detailed electrophysiological description. These features are not covered and analyzed in previous dopaminergic and GABAergic neuronal models. Hence, previous models may not be considered to investigate functional mecha- nism of glucose dependent neuronal activity. Here, we investigate a rather simple Hodgkin-Huxley type model to reduce ambiguity to massive number of parameters. 2.2. Coupled Neuronal Model Based on the neurophysiologic mechanisms described in the last section, we present a mathematical model, which simulates the behavior of a neuronal network in the midbrain. More precisely, we investigate a Hodgkin- Huxley type model of synaptic coupledGABAergic- dopaminergic neurons [14]. Hodgkin-Huxley type mod- els describe how action potentials of a single neuron proceed in time. The model can be specified by the sys- tem of differential equations Na K L P 1() (1) , (1 ), (1 ) mm nn hh VIIII C mmm nnn hhh , with 3 Na NaNa 4 KK K LL L (), (), () IgmhVV IgnVV IgVV C opyright © 2011 SciRes. JBiSE  M. Chung et al. / J. Biomedical Science and Engineering 4 (2011) 136-145 140 and the functions 75 13.5 40 75 1 mV V e , /42.248 1.2262 V me , (95 )/11.8 95 1 V nV e , /22.222 0.025 V ne , /24.186 0.0035V he , ( 51.25)/5.2 0.017 (51.25) 1 hV V e . Here, is the membrane potential and is its de- rivative in time, is the capacitance, and VV C a , are the currents of sodium and potassium ion channels, re- spectively. Furthermore, is a leakage current while is an externally applied current. The currents a , and can be described as a product of maximal conductance a , and , voltage dependent gat- ing variables m, n and h (with its derivatives , and ) and deviation between actual membrane potential and its reversal potentials m n h a V, V and V. The gating variables , and consist of functions m mn h , n , h and m , n , h reflecting the membrane potential dependent rate constants of channel opening and closing, respectively. As for the constants, we choose typical values for GABAergic neurons given by literature [15]: 55 Na V , mV 97m K V , , 70 mV L V 2 mScm112 Na g 1μC, , , 2 224mScm K g2 g0.1mScm L 2 Fcm and P representing the ion pumps and an ex- ternally applied current (bias). The neuronal activity of a GABAergic neuron can be described by the Hodgkin- Huxley model (see equations above and compare Figure 3 top). 2 μAcm 10I As previously discussed, some potassium channels are ATP and therewith glucose dependent. In turn, KATP channel kinetics depends on the extracellular glucose concentration. We assume that the linear transformation calculates the intra-neuronal ATP concentration 0.0014 0.033AG from the extracellular glucose concen- tration (compare [16]). This transformation seems to be arbitrary at first sight. However, the observed glucose levels of 0 to 10 mM in the experimental superfusion system lead to intra-neuronal ATP concentrations of 33 to 47 µM, the relevant range of KATP channel kinetics (compare [17]). Note the neurochemical experiment in- cludes hyperphysiological glucose levels (see Section 1). In order to mathematically simulate the addition of glu- cosamine, we modify the ATP production by glucose utilization, i.e., G 0.0A0140.033G with 0.05 . Furthermore, we introduce an ATP dependent mo- notonously increasing function ;: A AK . The constant A illustrates the affinity of the KATP channel. The kinetics of the KATP channels can be de- scribed by max (; ) 1· A A v AK K A , where ma is the saturated closing rate of the KATP channels, A x v is the ATP concentration causing half- maximal channel closing, and is the Hill coefficient. We choose max 0.1v , for low affine and for high affine KATP channels and 0.05mM A K 0.02mM AK 1.8H (compare [17]). The parameter represents the addition of the KATP channel blocker glibenclamide. Without glibenclamide, we set 1 , 1.03 models a low glibenclamide concentration and 4 reflects adding a high glibenclamide concentration. Since the closing probability of the KATP channels de- pends on the ATP concentration, we receive the follow- ing modification of n for the GABAergic neuron /22.222 (;)0.025 V nA AK e . Here, we assume that KATP and voltage dependent po- tassium channels interact. Hence, we model the closing rate n as product of ATP and voltage dependent channels. The open probability is independent of ATP, and n does not need to be modified. The same Hodgkin-Huxley model holds for the do- paminergic neuron if we for once neglect the inhibitory effect of the GABAergic neuron. Taking the effect of the GABAA receptors on the dopaminergic neuron into ac- count, we couple two Hodgkin-Huxley models. We in- troduce the synaptic current GABA , which depends on the membrane potential V of the GABAergic neuron (see first equation of equations above). It describes the in- hibitory chemical connection between GABAergic and dopaminergic neuron. We use “~” to identify the specific values of the dopaminergic neuron I NaKL GABA P 1 VIIII C I , with the synaptic current () GABA synsyn IgrVV . In neuronal models, synaptic events are often formal- ized as stereotyped, time-varying conductance wave- forms. The α-function is most commonly used [18]. Al- ternatively, one can compute synaptic conductances using a kinetic model [19]. This approach is consistent with the formalism, which describes conductances of ion channels in the Hodgkin-Huxley model. It allows a more realistic C opyright © 2011 SciRes. JBiSE 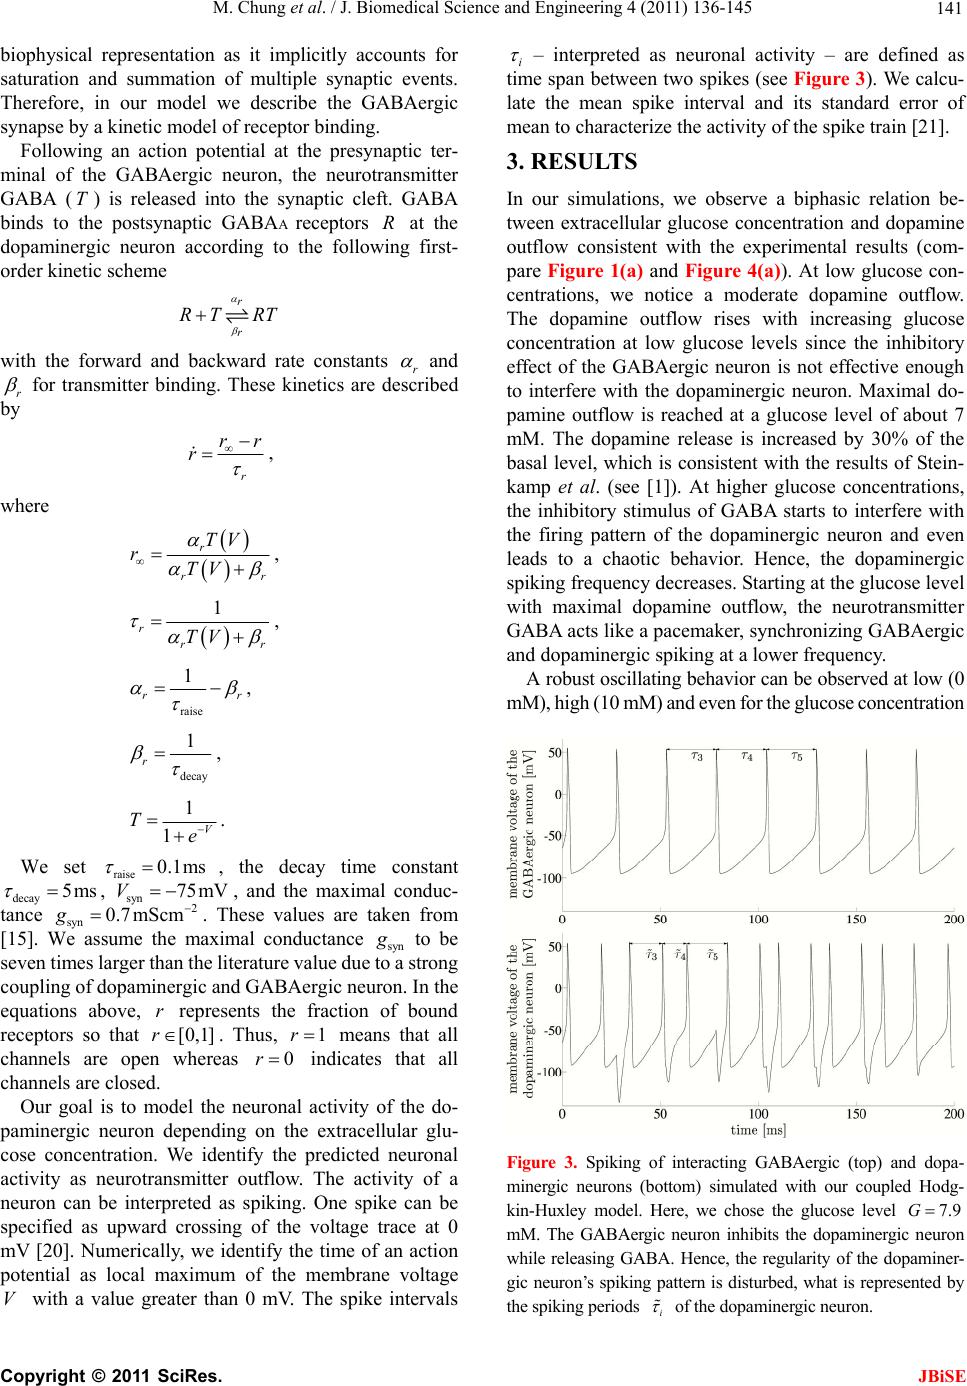 M. Chung et al. / J. Biomedical Science and Engineering 4 (2011) 136-145 Copyright © 2011 SciRes. 141 biophysical representation as it implicitly accounts for saturation and summation of multiple synaptic events. Therefore, in our model we describe the GABAergic synapse by a kinetic model of receptor binding. JBiSE Following an action potential at the presynaptic ter- minal of the GABAergic neuron, the neurotransmitter GABA () is released into the synaptic cleft. GABA binds to the postsynaptic GABAA receptors at the dopaminergic neuron according to the following first- order kinetic scheme TR r r RT RT with the forward and backward rate constants r and r for transmitter binding. These kinetics are described by r rr r , where r rr TV rTV , 1 rrr TV , raise 1 rr , decay 1 r , 1 1V Te . We set raise 0.1ms , the decay time constant decay5ms g , , and the maximal conduc- tance syn. These values are taken from [15]. We assume the maximal conductance syn syn 75mV 2 0.7 mScmV to be seven times larger than the literature value due to a strong coupling of dopaminergic and GABAergic neuron. In the equations above, represents the fraction of bound receptors so that . Thus, means that all channels are open whereas indicates that all channels are closed. r [0,1]r1r 0r Our goal is to model the neuronal activity of the do- paminergic neuron depending on the extracellular glu- cose concentration. We identify the predicted neuronal activity as neurotransmitter outflow. The activity of a neuron can be interpreted as spiking. One spike can be specified as upward crossing of the voltage trace at 0 mV [20]. Numerically, we identify the time of an action potential as local maximum of the membrane volta V with a value greater than 0 mV. The spike intervals i ge – interpreted as neuronal activity – are defined as time span between two spikes (see Figure 3). We calcu- late the mean spike interval and its standard error of mean to characterize the activity of the spike train [21]. 3. RESULTS In our simulations, we observe a biphasic relation be- tween extracellular glucose concentration and dopamine outflow consistent with the experimental results (com- pare Figure 1(a) and Figure 4(a)). At low glucose con- centrations, we notice a moderate dopamine outflow. The dopamine outflow rises with increasing glucose concentration at low glucose levels since the inhibitory effect of the GABAergic neuron is not effective enough to interfere with the dopaminergic neuron. Maximal do- pamine outflow is reached at a glucose level of about 7 mM. The dopamine release is increased by 30% of the basal level, which is consistent with the results of Stein- kamp et al. (see [1]). At higher glucose concentrations, the inhibitory stimulus of GABA starts to interfere with the firing pattern of the dopaminergic neuron and even leads to a chaotic behavior. Hence, the dopaminergic spiking frequency decreases. Starting at the glucose level with maximal dopamine outflow, the neurotransmitter GABA acts like a pacemaker, synchronizing GABAergic and dopaminergic spiking at a lower frequency. A robust oscillating behavior can be observed at low (0 mM), high (10 mM) and even for the glucose concentration Figure 3. Spiking of interacting GABAergic (top) and dopa- minergic neurons (bottom) simulated with our coupled Hodg- kin-Huxley model. Here, we chose the glucose level 7.9G mM. The GABAergic neuron inhibits the dopaminergic neuron while releasing GABA. Hence, the regularity of the dopaminer- gic neuron’s spiking pattern is disturbed, what is represented by the spiking periods i of the dopaminergic neuron. 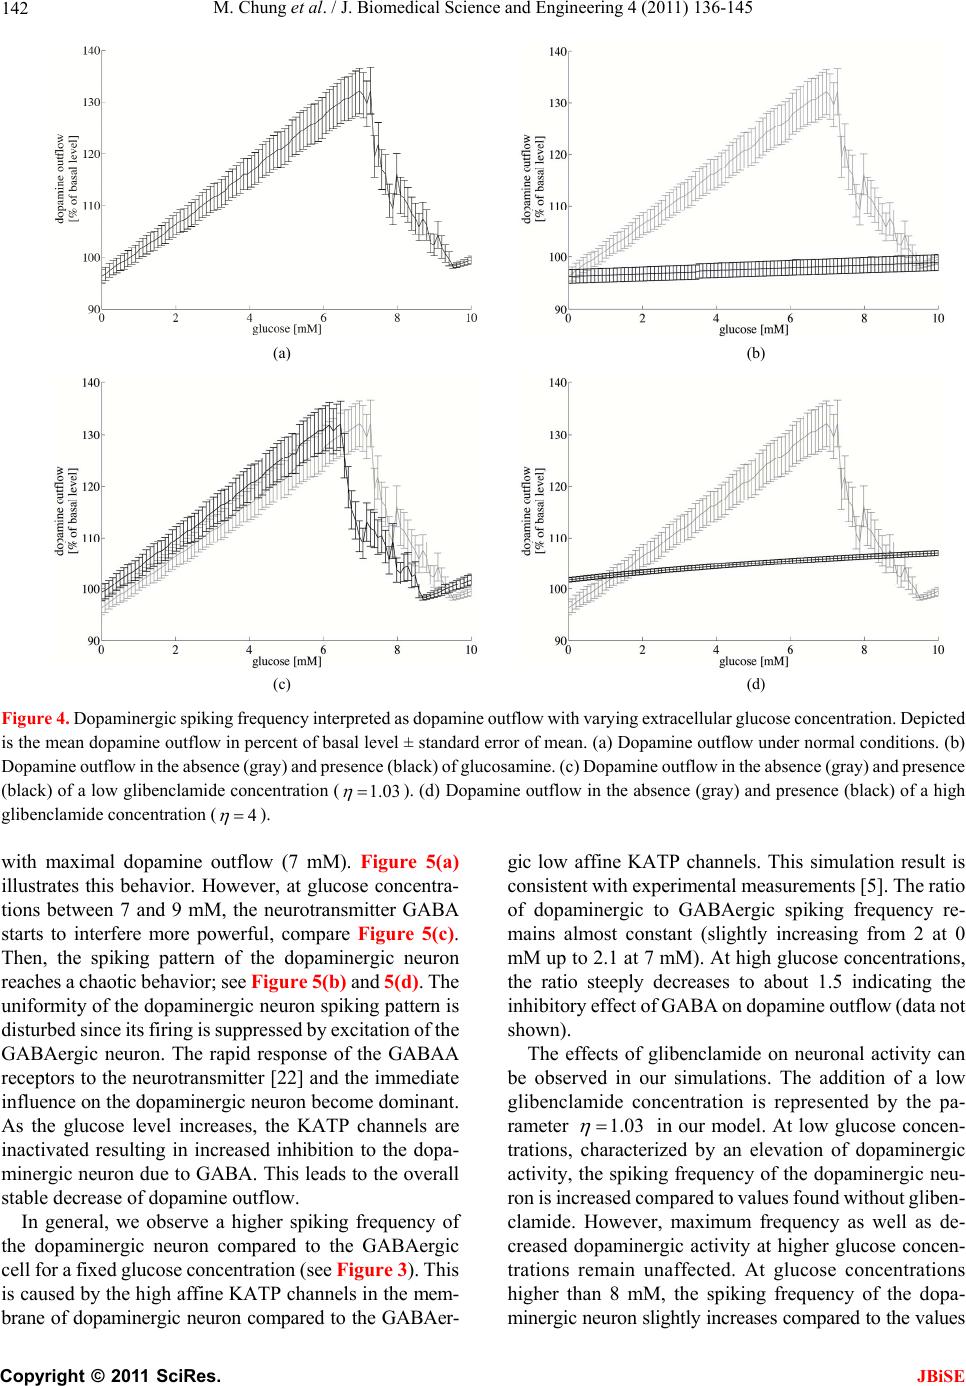 M. Chung et al. / J. Biomedical Science and Engineering 4 (2011) 136-145 142 (a) (b) (c) (d) Figure 4. Dopaminergic spiking frequency interpreted as dopamine outflow with varying extracellular glucose concentration. Depicted is the mean dopamine outflow in percent of basal level ± standard error of mean. (a) Dopamine outflow under normal conditions. (b) Dopamine outflow in the absence (gray) and presence (black) of glucosamine. (c) Dopamine outflow in the absence (gray) and presence (black) of a low glibenclamide concentration (1.03 ). (d) Dopamine outflow in the absence (gray) and presence (black) of a high glibenclamide concentration (4 ). with maximal dopamine outflow (7 mM). Figure 5(a) illustrates this behavior. However, at glucose concentra- tions between 7 and 9 mM, the neurotransmitter GABA starts to interfere more powerful, compare Figure 5(c). Then, the spiking pattern of the dopaminergic neuron reaches a chaotic behavior; see Figure 5 (b) and 5(d). The uniformity of the dopaminergic neuron spiking pattern is disturbed since its firing is suppressed by excitation of the GABAergic neuron. The rapid response of the GABAA receptors to the neurotransmitter [22] and the immediate influence on the dopaminergic neuron become dominant. As the glucose level increases, the KATP channels are inactivated resulting in increased inhibition to the dopa- minergic neuron due to GABA. This leads to the overall stable decrease of dopamine outflow. In general, we observe a higher spiking frequency of the dopaminergic neuron compared to the GABAergic cell for a fixed glucose concentration (see Figure 3 ). This is caused by the high affine KATP channels in the mem- brane of dopaminergic neuron compared to the GABAer- gic low affine KATP channels. This simulation result is consistent with experimental measurements [5]. The ratio of dopaminergic to GABAergic spiking frequency re- mains almost constant (slightly increasing from 2 at 0 mM up to 2.1 at 7 mM). At high glucose concentrations, the ratio steeply decreases to about 1.5 indicating the inhibitory effect of GABA on dopamine outflow (data not shown). The effects of glibenclamide on neuronal activity can be observed in our simulations. The addition of a low glibenclamide concentration is represented by the pa- rameter 1.03 in our model. At low glucose concen- trations, characterized by an elevation of dopaminergic activity, the spiking frequency of the dopaminergic neu- ron is increased compared to values found without gliben- clamide. However, maximum frequency as well as de- creased dopaminergic activity at higher glucose concen- trations remain unaffected. At glucose concentrations higher than 8 mM, the spiking frequency of the dopa- minergic neuron slightly increases compared to the values C opyright © 2011 SciRes. JBiSE 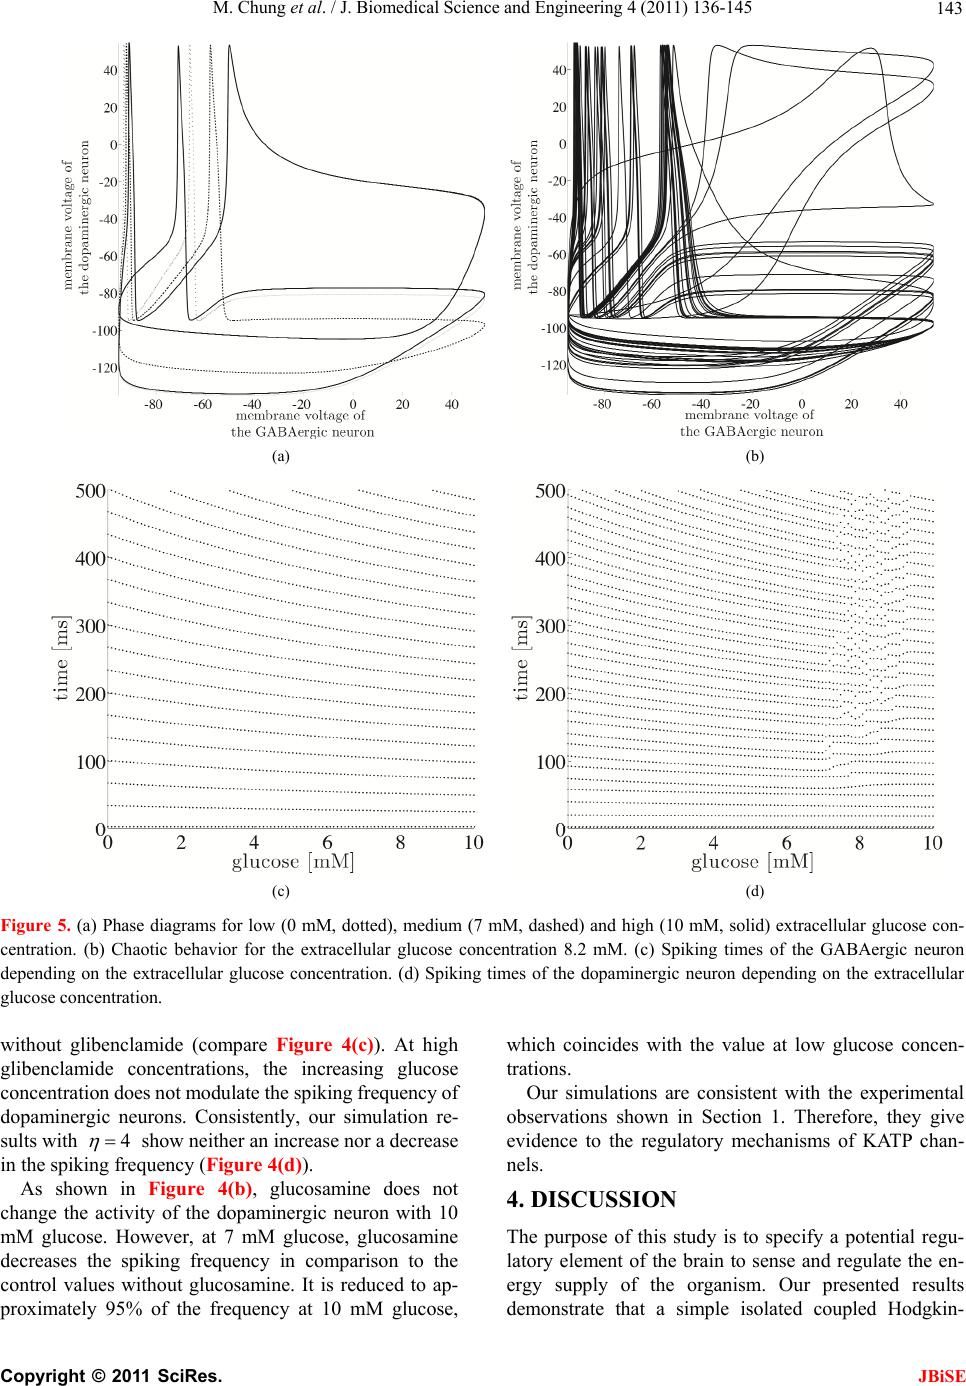 M. Chung et al. / J. Biomedical Science and Engineering 4 (2011) 136-145 143 (a) (b) (c) (d) Figure 5. (a) Phase diagrams for low (0 mM, dotted), medium (7 mM, dashed) and high (10 mM, solid) extracellular glucose con- centration. (b) Chaotic behavior for the extracellular glucose concentration 8.2 mM. (c) Spiking times of the GABAergic neuron depending on the extracellular glucose concentration. (d) Spiking times of the dopaminergic neuron depending on the extracellular glucose concentration. without glibenclamide (compare Figure 4(c)). At high glibenclamide concentrations, the increasing glucose concentration does not modulate the spiking frequency of dopaminergic neurons. Consistently, our simulation re- sults with 4 show neither an increase nor a decrease in the spiking frequency (Figure 4(d)). As shown in Figure 4(b), glucosamine does not change the activity of the dopaminergic neuron with 10 mM glucose. However, at 7 mM glucose, glucosamine decreases the spiking frequency in comparison to the control values without glucosamine. It is reduced to ap- proximately 95% of the frequency at 10 mM glucose, which coincides with the value at low glucose concen- trations. Our simulations are consistent with the experimental observations shown in Section 1. Therefore, they give evidence to the regulatory mechanisms of KATP chan- nels. 4. DISCUSSION The purpose of this study is to specify a potential regu- latory element of the brain to sense and regulate the en- ergy supply of the organism. Our presented results demonstrate that a simple isolated coupled Hodgkin- Copyright © 2011 SciRes. JBiSE  M. Chung et al. / J. Biomedical Science and Engineering 4 (2011) 136-145 144 Huxley model simulates the interactive behavior of GABAergic and dopaminergic neurons accurately. The simulations are consistent with the results of the in vitro cell experiments [1]. The model reflects the observed neuronal biphasic response. Furthermore, simulations on interventions with glibenclamide and glucosamine show consistent dynamics with experimental observations. To our best knowledge, there do not exist any experi- mental data on the frequency of firing in neuronal net- works consisting of dopaminergic and GABAergic neu- rons. The relation between spiking frequency and neuro- transmitter outflow of neurons remains unknown. Our model for the first time predicts the spiking behavior of neuronal networks consisting of dopamine and GABA neurons under varying glucose concentrations. Moreover, our simulation results suggest that the dopamine outflow of a dopaminergic neuron is congruent to its spiking frequency. One may argue that our developed coupled Hodg- kin-Huxley model is too comprehensive to address the observed biphasic dynamics. Apart from this model, there exist several other mathematical models describing the behavior of neurons, which give an even more simplified representation. For example, one could mention the Leaky-Integrate-and-Fire model or the FitzHugh-Na- gumo model. Unlike these models, the Hodgkin-Huxley model particularly describes ion channel gating resulting in excitation of neurons. Since weinvestigate the KATP channel dynamics that cause the associated changes in neuronal activity, the Hodgkin-Huxley model is adequate to model extracellular glucose dependent dopamine out- flow. Furthermore, one may argue that our model is over- simplified since we only investigate an isolated two- neuron model. But one has to take into account that sim- ple and robust biological mechanisms are more likely to evolutionary prevail. Therefore, the development of a simple stable system is required. Here, we simply address coupled dopaminergic and GABAergic neurons with different KATP channels as essential regulatory mecha- nism behind the dopamine outflow. Our future research will investigate and simulate the behavior of larger neu- ronal networks with coupled dopaminergic and GABAer- gic neurons as basic subunits. The principle of interacting excitatory and inhibitory elements like high and low affine KATP channels can be found in many other biological systems (see [23,24]). For instance, almost all known ligands bind to at least two receptor types. In most cases, the formed complexes have opposing actions. Considered in closed loops these posi- tive and negative feedbacks are shown to generate ho- meostatic systems [25]. This gives additional evidence for our presented concept and may reveal the potential control mechanism of the biphasic dopamine response in a global brain energy sensing concept. How does the brain sense energy, and how does the brain send control signals to the body? The answer to these questions is fairly unknown. The Selfish Brain Theory [26] specifies KATP channels to be involved in sensing the energy supply in the brain so that the biphasic dopamine release may be explained by the dynamic of high and low affine KATP channels. Our neuronal model supports the plausibility of interacting KATP channels controlling dopamine and GABA outflow. Suppose the maximal dopaminergic outflow as an energy resting state. A deviation from this glucose resting state will result in a dopaminergic response and might be identified as a brain energy sensing mechanism. In this way, the brain might be able to sense its energy supply via the intra-neuronal ATP concentration and to react accordingly. It has been demonstrated that the cau- date nucleus is highly involved in learning, memory, and feedback processes, in particular [27,28]. These proc- esses play a decisive role in the energy metabolism of the whole organism. This may be evidence that the brain is the superior administrative instance and has the strongest position in the competition for energy within the body. Hence, consistent with the Selfish Brain The- ory on a systemic scale the described mechanisms may be a driving force for a global regulation in energy me- tabolism. 5. ACKNOWLEDGEMENTS The authors M. C., B. G., and K. M. O. thank the Graduate School for Computing in Medicine and Life Sciences at the University of Lübeck funded by the German Research Foundation [DFG GSC 235/1] for its support. REFERENCES [1] Steinkamp, M., Li, T., Fuellgraf, H. and Moser, A. (2007) K(ATP)-dependent neurotransmitter release in the neu- ronal network of the rat caudate nucleus. Neurochemistry international, 50, 159-163. doi:10.1016/j.neuint.2006.07.011 [2] Baldwin, S.A. (1993) Mammalian passive glucose trans- porters: members of an ubiquitous family of active and passive transport proteins. Biochimica et Biophysica Acta, 1154, 17-49. [3] Karschin, C., Ecke, C., Ashcroft, F.M. and Karschin, A. (1997) Overlapping distribution of K(ATP) channel- forming Kir6.2 subunit and the sulfonylurea receptor SUR1 in rodent brain. FEBS Letters, 401, 59-64. doi:10.1016/S0014-5793(96)01438-X [4] During, M.J., Leone, P., Davis, K.E., Kerr, D. and Sher- win, R.S. (1995) Glucose modulates rat substantia nigra GABA release in vivo via ATP-sensitive potassium channels. Journal of Clinical Investigation, 95, 2403-2408. Copyright © 2011 SciRes. JBiSE  M. Chung et al. / J. Biomedical Science and Engineering 4 (2011) 136-145 Copyright © 2011 SciRes. 145 JBiSE doi:10.1172/JCI117935 [5] Ramrath, L., Levering, J., Conrad, M., Thuemen, A., Fuellgraf, H. and Moser, A. (2009) Mathematical identi- fication of a neuronal network consisting of GABA and DA in striatal slices of the rat brain. Computational and Mathematical Methods in Medicine, 10, 273-285. doi:10.1080/17486700802616526 [6] Conti, L.R., Radeke, C.M., Shyng, S.-L. and Vandenberg, C.A. (2001) Transmembrane topology of the sulfonylurea receptor SUR1. Journal of Biology and Chemistry, 276, 41270-41278. doi:10.1074/jbc.M106555200 [7] Ashcroft, F.M. and Gribble, F.M. (200) New windows on the mechanism of action of K(ATP) channel openers. Trends in Pharmacological Sciences, 21, 439-445. doi:10.1016/S0165-6147(00)01563-7 [8] Levin, B.E., Routh, V.H., Kang, L., Sanders, N.M. and Dunn-Meynell, A.A. (2004) Neuronal glucosensing: what do we know after 50 years? Diabetes, 53, 2521-2528. doi:10.2337/diabetes.53.10.2521 [9] Destexhe, A., Mainen, Z. and Sejnowski, T.J. (1998) Methods in Neuronal Modeling, Chapter Kinetic models of synaptic transmission. 2nd Edition, MIT Press, Cam- bridge. doi:10.1152/jn.00422.2007 [10] Canavier, C., Oprisan, S., Callaway, J.C., Ji, H. and She- pard, P. (2007) Computational model predicts a role for ERG current in repolarizing plateau potentials in dopa- mine neurons: implications for modulation of neuronal activity. Journal of Neurophysiology, 98, 3006-3022. [11] Amini, B., Clark, J.W. and Canavier, C.C. (1999) Calcium dynamics underlying pacemaker- like and burst firing in midbrain dopaminergic neurons: a computational study. Journal of Neurophysiology, 82, 2249-2261. [12] Komendantov, A. and Canavier, C. (2002) Electrical coupling between model midbrain dopamine neurons: effects on firing pattern and synchrony. Journal of Neu- rophysiology, 87, 1526-1541. [13] Kuznetsov, A.S. (2010) Models of midbrain dopaminer- gic neurons. Scholarpedia. http://www. schol a rpe di a. org/ a rtic le/ Mode l s_of_midbra i n _dopaminergic_neurons, doi:10.4249/scholarpedia.1812, 2(10), 1812. [14] Hodgkin, A.L. and Huxley, A.F. (1952) A quantitative description of membrane current and its application to conduction and excitation in nerve. The Journal of Phy- siology, 117, 500-544. [15] Nomura, M., Fukai, T. and Aoyagi, T. (2003) Synchrony of fast-spiking interneurons interconnected by GABAer- gic and electrical synapses. Neural Computation, 15, 2179-2198. doi:10.1162/089976603322297340 [16] Ainscow, E.K., Mirshamsi, S., Tang, T., Ashford, M.L.J. and Rutter, G.A. (2002) Dynamic imaging of free cyto- solic ATP concentration during fuel sensing by rat hypo- thalamic neurones: evidence for ATP-independent control of ATP-sensitive K(+) channels. The Journal of Physi- ology, 544, 429-445. doi:10.1113/jphysiol.2002.022434 [17] Nichols, C.G., Lederer, W.J. and Cannell, M.B. (1991) ATP dependence of K(ATP) channel kinetics in isolated membrane patches from rat ventricle. Biophysical Journal, 60, 1164-1177. doi:10.1016/S0006-3495(91)82152-X [18] Rall, W. (1967) Distinguishing theoretical synaptic po- tentials computed for different soma-dendritic distribu- tions of synaptic input. Journal of Neurophysiology, 30, 1138-1168. [19] Destexhe, A., Mainen, Z. and Sejnowski, T.J. (1994) An efficient method for computing synaptic conductances based on a kinetic model of receptor binding. Neural Computation, 6, 14-18. doi:10.1016/S0006-3495(91)82152-X [20] Lundstrom, B.N. and Fairhall, A.L. (2006) Decoding stimulus variance from a distributional neural code of in- ter-spike intervals. The Journal of Neuroscience Online, 26, 9030-9037. [21] Wang, M., Hou, Z. and Xin, H. (2004) Double-system- size resonance for spiking activity of coupled Hodgkin- Huxley neurons. ChemPhysChem, 5, 1602-1605. doi:10.1002/cphc.200400255 [22] Clements, J.D. (1996) Transmitter timecourse in the synaptic cleft: its role in central synaptic function. Trends in Neurosciences, 19, 163-171. doi:10.1016/S0166-2236(96)10024-2 [23] Calabrese, E.J. (2004) Hormesis: a revolution in toxicol- ogy, risk assessment and medicine. EMBO Reports, 5, S37-S40. doi:10.1038/sj.embor.7400222 [24] Peters, A., Conrad, M., Hubold, C., Schweiger, U., Fischer, B. and Fehm, H.L. (2007) The principle of ho- meostasis in the hypothalamus-pituitary-adrenal system: new insight from positive feedback. American Journal of Physiology: Regulatory, Integrative and Comparative Physiology, 293, R83-98. doi:10.1152/ajpregu.00907.2006 [25] Conrad M., Hubold, C., Fischer, B. and Peters A. (2009) Modeling the hypothalamus–pituitary–adrenal system: homeostasis by interacting positive and negative feedback. Journal of Biological Physics, 35, 149-162. doi:10.1007/s10867-009-9134-3 [26] Peters, A., Schweiger, U., Pellerin, L., Hubold, C., Olt- manns, K.M., Conrad, M., Schultes, B., Born, J. and Fehm, H.L. (2004) The selfish brain: competition for energy resources. Neuroscience and Biobehavioral Reviews, 28, 143-180. doi:10.1016/j.neubiorev.2004.03.002 [27] Graybiel, A.M. (2005) The basal ganglia: learning new tricks and loving it. Current Opinio n in Neurobiology, 15, 638-644. doi:10.1016/j.conb.2005.10.006 [28] Packard, M.G. and Knowlton, B.J. (2002) Learning and memory functions of the basal ganglia. Annual Review of Neuroscience, 25, 563-593. doi:10.1146/annurev.neuro.25.112701.142937
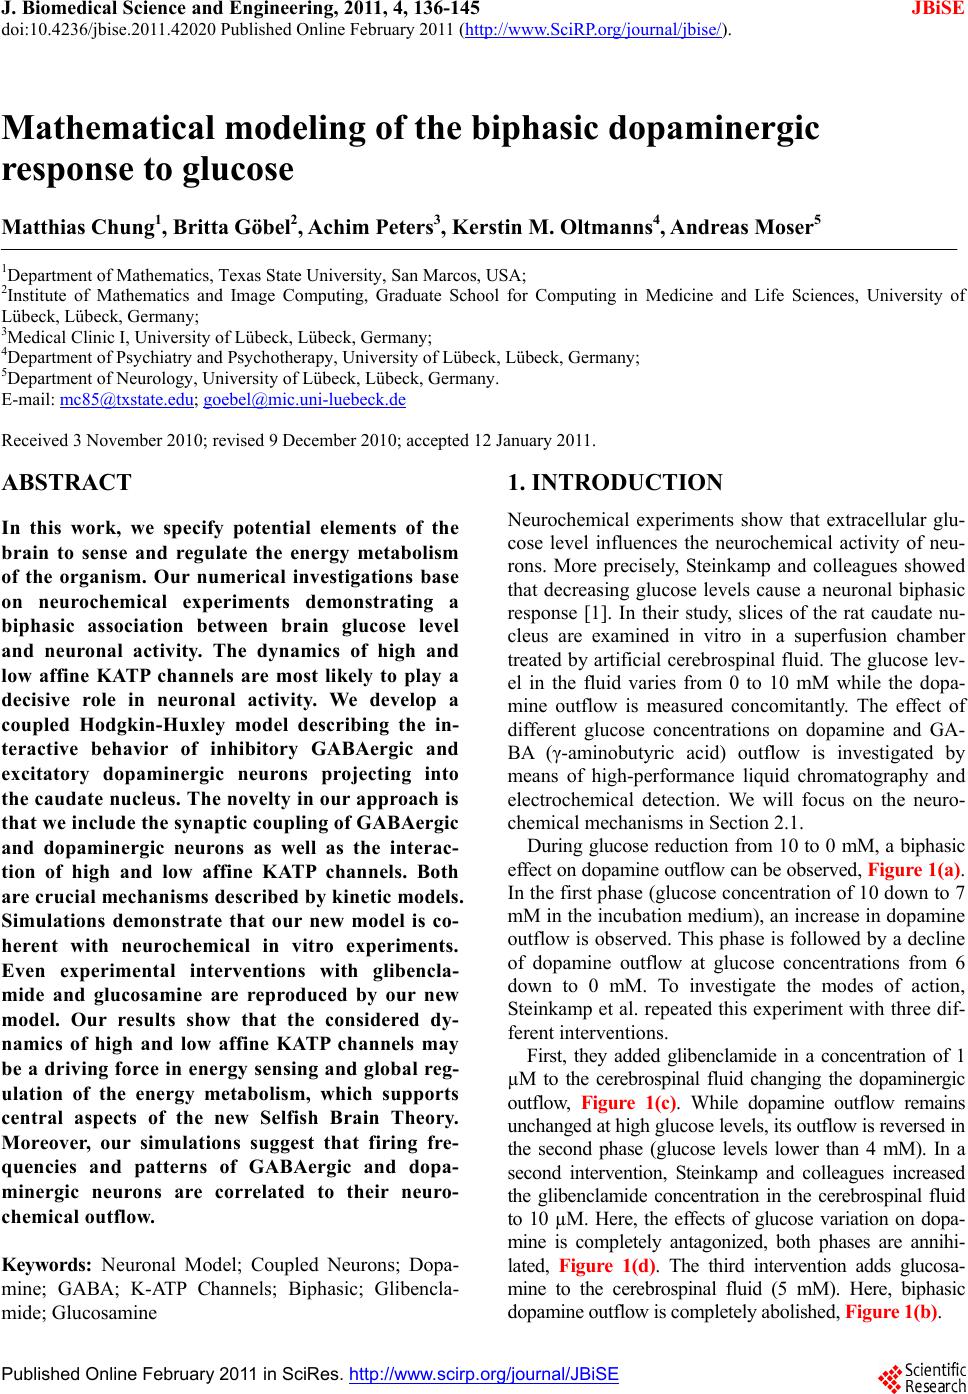
|