J. Biomedical Science and Engineering, 2011, 4, 122-129
doi: 10.4236/jbise.2011.42018 Published Online February 2011 (http://www.SciRP.org/journal/jbise/ JBiSE
).
Published Online February 2011 in SciRes. http://www.scirp.org/journal/JBiSE
Development of forearm impedance plethysmography for the
minimally invasive monitoring of cardiac pumping function
Jia-Jung Wang1, Wei-Chih Hu2, Ts ia r Kao3, Chun-Peng Liu4, Shih-Kai Lin4
1Department of Biomedical Engineering, I-Shou University, Kaohsiung, Taiwan;
2Department of Biomedical Engineering, Chung- Yuan Christian University, Chungli, Taiwan;
3Department of Biomedical Engineering, Hungkuang University, Taichung, Taiwan;
4Department of Internal Medicine, Kaohsiung Veterans General Hospital, Kaohsiung, Taiwan
Email: wangjj@isu.edu.tw; weichih@be.cycu.edu.tw; tskao@sunrise.hk.edu.tw; cpliu@vghks.gov.tw
Received 25 November 2010; revised 30 November 2010; accepted 3 December 2010.
ABSTRACT
It is essential to continuously and non-invasively
monitor the cardiac pumping function in clinical set-
ting. Thus, the study aimed to explore a regional im-
pedance phethysmographic method to assess the
changes in stroke volume. To do this, we developed a
plethysmographic device that was capable of deliver-
ing a single-frequency current with constant amplitude
and of recording electrical impedance signals of bio-
logical tissue. The electrical impedance plethy-
smographic waveform form the lower arm was meas-
ured with the impedance plethysmographic device,
and simultaneously the end-systolic and end- diastolic
volumes of the left ventricle were obtained with a
two-dimension echocardiographic system in fourteen
healthy subjects before and immediately after a
thirty-second breath-hold maneuver. For the 14 sub-
jects, a linear correlation coefficient of 0.79 (p < 0.001)
was obtained between the changes in peak amplitude
of the forearm impedance waveform and the changes
in stroke volume before and just after the breath-hold
test. In addition, the changes in the mean area under
the impedance curve and the change in stroke volume
were also correlated linearly (r = 0.71, p < 0.005). In
summary, the forearm impedance plethysmography
may be employed to evaluate the beat-to-beat altera-
tion in cardiac stroke volume, suggesting its potential
for long-term monitoring cardiac pumping perform-
ance.
Keywords: Impedance Plethysmography; Stroke Volume;
Breath-Hold Maneuver; Im pedance; Echocardiography
1. INTRODUCTION
The electrical impedance cardiography, one of the
plethysmography, has been extensively applied to assess
cardiac parameters, because of its minimal invasiveness
of nature. The stroke volume, cardiac output, diastolic
filling, ventricular contractility, and so forth, have been
evaluated using this impedance plethysmography in pre-
vious literature [1-5]. According to the electrode ar-
rangement and location, there are three most popular
electrical impedance technologies applied for non-inva-
sively assessing cardiac pumpin g function.
The first and the most commercially available is the
thoracic electrical impedance cardiography, which util-
izes a number of electrodes placed at the root of the neck
and set around the lower part of the chest cage in the
cardiac parameter measurement [6-8]. Since the elec-
trodes arranged are close to the heart, the thoracic im-
pedance cardiography may provide with more reliable
cardiac parameter. However, the electrode location and
arrangement makes it inconvenient and unwieldy in ac-
tual clinics. Second, the whole-body electrical imped-
ance cardiography requires either four pairs of electrodes
that are applied to four limbs, or two pairs of electrodes
in which one pair is placed on a wrist and the other on
the contralateral ankle [9-11]. Evidently, it is necessary
for users to spend more time in appropriately disposing
the eight electrodes in the whole-body impedance car-
diography. Since the four limbs are concurrently meas-
ured with the technique, an impedance signal accompa-
nied by more artifacts from the four extremity’s motion
will be yielded.
Third, the regional electrical impedance cardiography
usually uses two current electrodes and two sensing
electrodes that are placed on a local or regional position
of a limb [3,12]. Previous reports have indicated that the
regional impedance cardiography is as accurate as the
thoracic or the whole-body electrical impedance cardio-
graphy [2,13], with advantage of using peripheral rather
than thoracic impedance waves.
The objective of the study is to propose a forearm
J. J. Wang et al. / J. Biomedical Science and Engineering 4 (2011) 122-129 123
impedance plethysmographic approach and to validate it
by making a comparison between the changes and the
per cent changes in peak amplitude of or mean area un-
derneath the impedance wave from a forearm recorded
with the plethysmography, and those in cardiac stroke
volume measured with the echocardiography.
2. METHODS
2.1. Theory of Impedance Plethysmography
In the impedance plethysmography, the blood volume
changes (Vb) in relation to the changes in electrical
impedance (Z) can be governed by Nyboer’s formula
as follows [14]:
2
2
0
,
bL
V
Z
 Z (1)
where is the resistivity of blood, L is the length be-
tween the voltage sensing electrodes and Zo is the initial
value of the electrical impedance of the body segment.
This formula can be cautiously modified to determine
ventricular stroke volume from dZ/dt waveform [15].
Small variation in the instantaneous impedance of the
forearm segment may rise from arterial and venous
blood circulation, respiration, body motion, and so on. In
the study, properly applied at desired location on the
forearm surface, the measurement electrodes may re-
sponse to the changes in the forearm impedance that is
caused predominantly by the radial arterial blood flow.
2.2. Impedance Measuring Apparatus
An impedance measuring device with tetra-polar elec-
trodes (ECG electrodes, Unomedical Ltd., Great Britain)
was developed in the work to record the electrical im-
pedance waveform in a lower arm. Figure 1 shows its
schematic block diagram and the location of the elec-
trodes on the medial surface of a forearm.
The impedance measuring device was composed of a
Wein-Bridge oscillator designed to produce a sinusoidal
wave with a frequency of 100 kHz. A voltage to current
converter output a sinusoidal current of constant ampli-
tude (less than 1 mA) that acted as a carrier. The sinu-
soidal current could be passed through the forearm seg-
ment with the help of two spot electro des called the cur-
rent el (A and D). One of the two current electrodes was
placed on a position as close to the wrist as possible,
whereas the other was placed on a position close to the
cubital fossa. Voltage signal generated along the current
pathway was detected by means of another pair of spot
electrodes called the voltage sensing electrodes or meas-
urement electrodes (B and C). Between the two current
electrodes, the two voltage sensing electrodes were
placed over the radial artery.
An instrumentation amplifier (AD620AN) was applied
D ifferen tial
amplifier
V ol tage to
current
co nvert er
Band-reject
filter
Full-wave
demodulator
Gain-
selective
a m p lifier
A
BC
D
Band-pass
filter
Oscillator
(100 kHz )
Forearm
Impedance
signa l
Figure 1. Block diagram of the impedance measuring device.
Constant amplitude sinusoidal current is passed through the
forearm segment by means of the current electrodes A and D.
Along the current path, two voltage sensing electrodes B and C
are appropriately applied to pick up the voltage that is propor-
tional to instantaneous impedance of the forearm segment.
to pick up the voltage difference between the two meas-
urement electrodes, due to its high input impedance. The
gain of this instrumentation amplifier could be properly
adjusted to output an alternating voltage signal whose
amplitude was within ±1 V and modulated by the 100 kHz
carrier. To increase the signal to noise ratio, a twin T
band-rejection filter was used to significantly remove the
superimposed noise (60 Hz noise) mostly arising from the
power line. Moreover, we utilized a full-wave rectifying
demodulator to rectify the alternating signal passing
through the band-rejection filter. In addition, a four-order
low-pass filter (30 Hz) and a one-order high-pass filter
(0.5 Hz) of the band-pass circuit were used to demodulate
the 100 kHz carrier and to remove the dc bias and
low-frequency drift, respectively. After the filtered signal
was appropriately amplified by the gain-selective ampli-
fier (20,000 to 200,000), we could obtain the continuous
impedance signal of the forearm segment.
2.3. Breath-Hold Maneuver
The experimental population included 14 male young
subjects with an average age of 22.4 ± 0.8 years, an av-
erage height of 175.1 ± 3.6 cm, an average weight of
73.9 ± 9.7 Kg, an average systolic blood pressure of
131.8 ± 10.8 (from 112 to 151) mmHg, an average dia-
stolic blood pressure of 75.1 ± 7.6 (from 66 to 89)
C
opyright © 2011 SciRes. JBiSE
J. J. Wang et al. / J. Biomedical Science and Engineering 4 (2011) 122-129
Copyright © 2011 SciRes.
124
3. RESULTS mmHg, and an average heart rate of 79.5 ± 12.0 (from
60 to 95) beats per minute. All the subjects had no car-
diac disease and vascular stenosis. In order to non- inva-
sively induce a consid erable change in ventricular stroke
volume, all the subjects were asked to undertake twice a
thirty-second breath-hold maneuver in supine position.
The Institutional Ethics Committee of the Kaohsiung
Veterans General Hospital approved the study protocol
and all subjects gave their consent.
A typical impedance waveform of the forearm segment
recorded from one of the fourteen subjects is shown in
Figure 2. The peak-to-peak amplitude of the impedance
waveform was decreased in the end of the thirty-second
breath-hold maneuver, as compared with the baseline.
Besides, the peak-to-peak amplitude became noticeably
greater immediately after the 30-second breath-hold
maneuver than in the baseline condition. Even with su-
perimposed noise, the impedance waveform showed a
periodic fluctuation in a beat-to-beat manner. In the
photo-plethysmographic waveform, its peak-to-peak
amplitude also decreased in the end of the maneuver as
compared with the baseline. Interestingly, the pattern of
the photo-plethysmographic waveform during the simple
breath-hold interval was similar to that during the Val-
salva’s maneuver.
2.4. Stroke Volume Measurement with
Echocardiography
Based on the electrocardiogram signals, the left ventricu-
lar end-systolic and end-diastolic volumes of the 14 sub-
jects in supine position were measured by means of a
2-dimension ultrasound system (SONOS-7500, Philips) at
the Cardiovascular Center of the Kaohsiung Veterans
General Hospital, Taiwan. The volume measurements
with the echocardiography were performed in the two
conditions: hemodynamic variable-stable condition (base-
line) as well as immediately after a 30-second breath-hold
maneuver. The stroke volume was defined as the differ-
ence between the end-diastolic and end-systolic volumes.
Tab le 1 summarizes the parameters that are measured
in the 14 subjects before and right away after the 30-
second breath-hold maneuver with the forearm imped-
ance plethysmography and the 2-dimension echocardi-
ography, respectively. The short-term breath-hold ma-
neuver significantly increased the peak amplitude of the
forearm impedance from 1.89±0.53 to 2.26±0.42 volt
2.5. Data Analysis
Before extracting any values from the electrical imped-
ance signals, the waveform was deliberately adjusted to
set its minimum value to zero; that is, all values of the
digitized data in the impedance waveform became larger
than or equal to zero. The study employed ensemble
averaging technique to minimize motion artifacts, exter-
nal pick up and internal noise of the developed device.
For individual subjects, a record containing 5 to 7 con-
tinuous cycles of the impedance waveform was used to
determine the peak amplitude and the mean area beneath
the impedance curve. To observe the alteration of one
variable (M), such as the peak amplitude, mean area and
stroke volume, in the pre- and post- 30-second breath-
hold experiment, the percent change in that variable
(%M), can be calculated using the following equ ation,
0 10203040
Impedance signal
0 10203040
PPG
Time [sec]
0 10203040
ECG
Breath-hol dBaseline Recovery
(a)
(b)
(c)
0
0
% 100%,
aft
MM
MM

(2)
where M0 and Maft are the variables measured before
and just after the 30-second breath-hold maneuver, re-
spectively.
The quantitative data were expressed as mean ± STD.
If a p value was less than 0.05 in paired t-test analysis,
then the means of two variables measured before and
just after the breath-hold maneuver were considered sig-
nificantly different. To compare the changes and the
percent changes in the peak amplitude of and the mean
area under the impedance waveform with those in the
stoke volume, 2-tailed Pearson’s correlation is utilized.
Figure 2. Time course of (a) electrical impedance signal
measured from a forearm, (b) photo-plethysmographic (PPG)
signal recorded from a fingertip of the same arm, and (c) elec-
trocardiogram signal (ECG) from the lead-II.
JBiSE
J. J. Wang et al. / J. Biomedical Science and Engineering 4 (2011) 122-129
Copyright © 2011 SciRes.
125
Table 1. Values of the parameters obtained with the forearm impedance plethysmogrphy as well as the echocardiography in the 14
subjects, respectively.
JBiSE
(ml)
Variable
Peak Amplitude
(volt) Mean Area
(volt×sec) ESV
(ml) EDV SV
(ml)
Condition PRE POST PRE POSTPRE POSTPRE POST PRE POST
Max 2.86 3.11 1.112 1.106 54.9 52.5 124.0 124.0 69.4 71.5
Min 1.25 1.61 0.281 0.296 25.0 21.7 62.9 76.1 37.9 46.1
Mean 1.89 2.26 0.506 0.576 37.9 34.4 89.3 91.2 51.5 56.8
STD 0.53 0.42 0.229 0.203 9.6 9.6 16.1 14.7 7.9 8.1
P value <0.002 <0.02 <0.002 <0.3 <0.004
(p<0.002). The mean area (0.506±0.229 volt×sec) under
the impedance waveform yielded before the maneuver
was smaller than that (0.576±0.203 volt×sec) immedi-
ately after the maneuver (p<0.02). In the echocardio-
graphic measurement, the short-time breath-hold sig-
nificantly decreased the ventricular end-systolic volume
from 37.9±9.6 to 34.4±9.6 ml (p<0.002). Interestingly,
the end-diastolic volume had a tendency to decline just
after the breath-hold maneuver, but with no significant
difference as compared with the baseline. Furthermore,
the cardiac stroke volume (56.8±8.1 ml) instantly after
the 30-second breath-hold maneuver became signifi-
cantly greater than that (51.5±7.9 ml) in the baseline
condition (p<0.00 4).
the maximum amplitude in the subjects.
Changes in the maximum amplitude of forearm im-
pedance with respect to changes in the cardiac stroke
volume measured before and just after the 30-second
breath-hold trial are plotted in Figure 4. Fascinatingly,
the 14 subjects showed high correlation (r = 0.785,
<0.001) between the peak amplitude changes and the
stroke volume changes. Likewise, between the baseline
condition and the post-breath-h old maneuver, the percent
change in the peak amplitude of forearm impedance
linearly correlates well with the percent change in the
stoke volume for the 14 subjects (r = 0.790, p < 0.001),
as shown in Figure 5.
The data measured in the co ntrol condition along with
those measured instan tly after the 30-second breath- hold
trial were used together to investigate the linear relation
between the mean area under the forearm impedance
waveform and the ventricular stroke volume. Figure 6
shows that the mean area underneath the impedance
waveform is hardly proportional to the cardiac stroke
volume.
The pooled data yielded before and immediately after
the 30-second breath-hold maneuver were used to ex-
amine the linear relation between the ventricular stroke
volume and the peak amplitude of electrical impedance
of the forearm segment. As shown in Figur e 3, the stroke
volume tends to be positively proportional to the maxi-
mum amplitude of impedance, but correlates weakly with Figure 7 demonstrates the relation between the changes
Peak ampl i tude of impe dan ce [volt]
1.0 1.5 2.0 2.5 3.0 3.5
Stroke v olu me [ml]
30
40
50
60
70
80
Y=3.75X+46.35
r=0.228
Change in peak amplitude of impedance [volt]
-0.4-0.20.0 0.2 0.4 0.6 0.8 1.0
Ch ang e in stroke volume [ml]
-10
-5
0
5
10
15
Y=12.86X+0.5183
r=0.785
Figure 3. Relationship between the peak amplitude of forearm
impedance waveform and the stroke volume. The 28 data
points in the plot are pooled ones of the 14 subjects measured
before and immediately after the 30-second breath-hold ma-
nipulation.
Figure 4. Relationship between the change in maximum am-
plitude of regional impedance waveform and the change in
stroke volume before and just after the 30-second breath-hold
manipulation.
J. J. Wang et al. / J. Biomedical Science and Engineering 4 (2011) 122-129
126
Percent chang e in pe ak amp lit ud e of imp edanc e [ % ]
-0.20.0 0.2 0.4 0.60.8
Percent change in stroke volume [%]
-0.2
-0.1
0.0
0.1
0.2
0.3
0.4
Y=0.442X+5.5302
r=0.790
Figure 5. Relationship between the percent change in maxi-
mum amplitude of regional impedance waveform and the per-
cent change in stroke volume before and just after the
30-second breath-hold manipulation.
Mean are a un d e r the impedanc e wav eform [volt*se c ]
0.2 0.4 0.6 0.81.0 1.2
Stroke volume [ml]
30
40
50
60
70
80
Y= -2.92X+55.71
r= -0.024
Figure 6. Relationship between the mean area under the fore-
arm impedance waveform and the stroke volume in the 14
subjects using the data obtained before and just after the
30-second breath-hold manipulation.
in mean area under the impedance waveform and the
changes in cardiac stroke volume measured before and
just after the 30-second breath-hold experiment. It was
found that there was a correlation coefficient of 0.715
(p<0.005) between the peak amplitude changes and the
stroke volume changes for the 14 subjects. As well,
Figure 8 shows that between the baseline condition and
the post-breath-hold maneuver, the percent change in the
mean area under the forearm impedance waveform line-
arly correlates with the percent change in the stoke vol-
ume for the 14 subjects (r = 0.704, p < 0.005).
Change in mean area under the impedance waveform [volt*sec]
-0.15-0.10-0.050.00 0.05 0.10 0.15 0.20 0.25
Chang e in strok e volume [ml]
-10
-5
0
5
10
15
Y=46.00X+2.030
r=0.715
Figure 7. Relationship between the change in mean area under
the forearm impedance waveform and the change in stroke
volume before and just after the 30-second breath-hold ma-
nipulation.
Percent change in mean area [%]
-0.20.0 0.2 0.4 0.6 0.8
Percent change in stroke volume [%]
-0.2
-0.1
0.0
0.1
0.2
0.3
0.4
Y=0.3891X+0.0356
r=0.704
Figure 8. Relationship between the percent change in mean
area under the forearm impedance waveform and the percent
change in stroke volume before and just after the 30-second
breath-hold manipulation.
4. DISCUSSION
Several previous studies have reported the potential
usefulness of the whole-body or the thoracic impedance
cardiography in the evaluation of stroke volume in pa-
tients with different diseases or clinical situations
[2,16,17]. However, these two kinds of cardiography
require more pairs of electrodes and spend more time in
placing the electrodes on desired locations appropriately.
On the other hand, in the proposed forearm impedance
plethysmography, less pairs of the electrodes are needed
and only the medial surface of a forearm is used as the
C
opyright © 2011 SciRes. JBiSE
J. J. Wang et al. / J. Biomedical Science and Engineering 4 (2011) 122-129
Copyright © 2011 SciRes.
127
measurement region. This may make the proposed
method more suitable for actually clinical applications.
In the whole-body and thoracic impedance cardiogra-
phy, an electrical current delivered by a current source
should pass through the core body or at least the thoracic
tissue. Thus, it is hardly to describe the actual current
pathway. Also, a portion of the delivered current may
really go through the heart, perhap s resulting in a risk of
microshock. In contrast, the current sent out by the de-
veloped device in the study only passes through the
forearm segment, without possibility of cardiac mi-
croshock.
In accordance with the Kirchov’s law, electrical cur-
rent tends to pass through human tissue with higher
conductivity. If an alternating current with a frequency
of 100 KHz is here applied to the forearm segment, both
the radial arterial lumen filled with blood and the ex-
tracellular fluid should gain higher current density, due
to their lower resistance [18]. Therefore, when the two
measurement electrodes are deliberately placed just over
the radial artery, the voltage between the sensing elec-
trodes is proportional to the forearm segment impedance.
Since the forearm impedance follows the radial arterial
blood flow. So, th e change in the voltage chiefly reflects
that in the radial arterial blood flow. To demonstrate this,
we first put a pneumatic cuff around the upper arm and
then inflate it up to different pressure levels. When the
internal cuff pressure is increased up to about 60 mmHg,
the blood flow in the veins inside the upper arm will
possibly stop, leading to little change in the amplitu de of
the electrical impedance waveform in the lower arm. But,
when the cuff is inflated to the mean arterial pressure
resulting in a partially occlusio n in the brachial artery of
underlying, a moderate reduction in the impedance am-
plitude is found. As the cuff is further increased up to a
supra-systolic pressure level, the impedance a mplitude is
significantly decreased, as shown in Figure 9.
It is assumed in the study that the amount of blood
flow through the radial artery of interest is linearly pro-
portional to the stroke volume produced by the left ven-
tricle in stable conditions. Consequently, the change in
the radial arterial flow may correlate linearly with the
change in the stroke volume. Based on the above de-
scription, the change in the amplitude of as well as the
change in the area under the forearm impedance wave-
form might be proportional to that in the stroke volume.
The present data in Figu res 4 and 7 are likely to su ppor t
this hypothesis. That might be partially the reason that
the regional impedance cardiography may provide more
accuracy than the thoracic or the whole-body cardiogra-
phy in assessing the stroke volume [3].
To accurately determine the subject’s stroke volume
of the patients with different diseases or clinical situa-
tions using the whole-body impedance cardiography all
the times becomes controversial [19,20], because the
electrical current in this approach passes through more
0510 15 20 25 30
Impedance signal
Time [sec]
0510 15 20 25 30
PPG
Inflation
duration
(0 to 150 mmHg)
Baseline Occlusion
(150 mmHg)
(a)
(b)
Figure 9. (a) Fluctuation of impedance amplitude becomes smaller when the upper arm is pressurized to be 150 mmHg. (b) Pho-
to-plethysmographic signal simultaneously recorded from a fingertip in the same arm.
JBiSE
J. J. Wang et al. / J. Biomedical Science and Engineering 4 (2011) 122-129
128
complicated conductive components, compared to the
present study. In the present study, we apply an alternat-
ing current of 100 KHz to the circle-type current elec-
trodes placed directly on the top of the radial artery,
which may result in a higher current density in the radial
lumen. Thus, the change in the forearm impedance am-
plitude may probably follow the change in the radial
blood flow. It suggests that the change in the impedance
amplitude can be more specifically reflected the change
in the stroke volume.
Several factors associated with the impedance changes
are present between individuals. One is the position of
surface electrodes. In most cases, the distance between
the two inner or outer electrodes is different from each
other in the measurement situation, resulting in a con-
siderable change in impedance amplitude. Second is due
to the distinct diameters of radial arteries and different
peripheral tissue compositions. Third is related to the
variation in biological impedance of tissue of interest.
Unfortunately, the present device fails to directly deter-
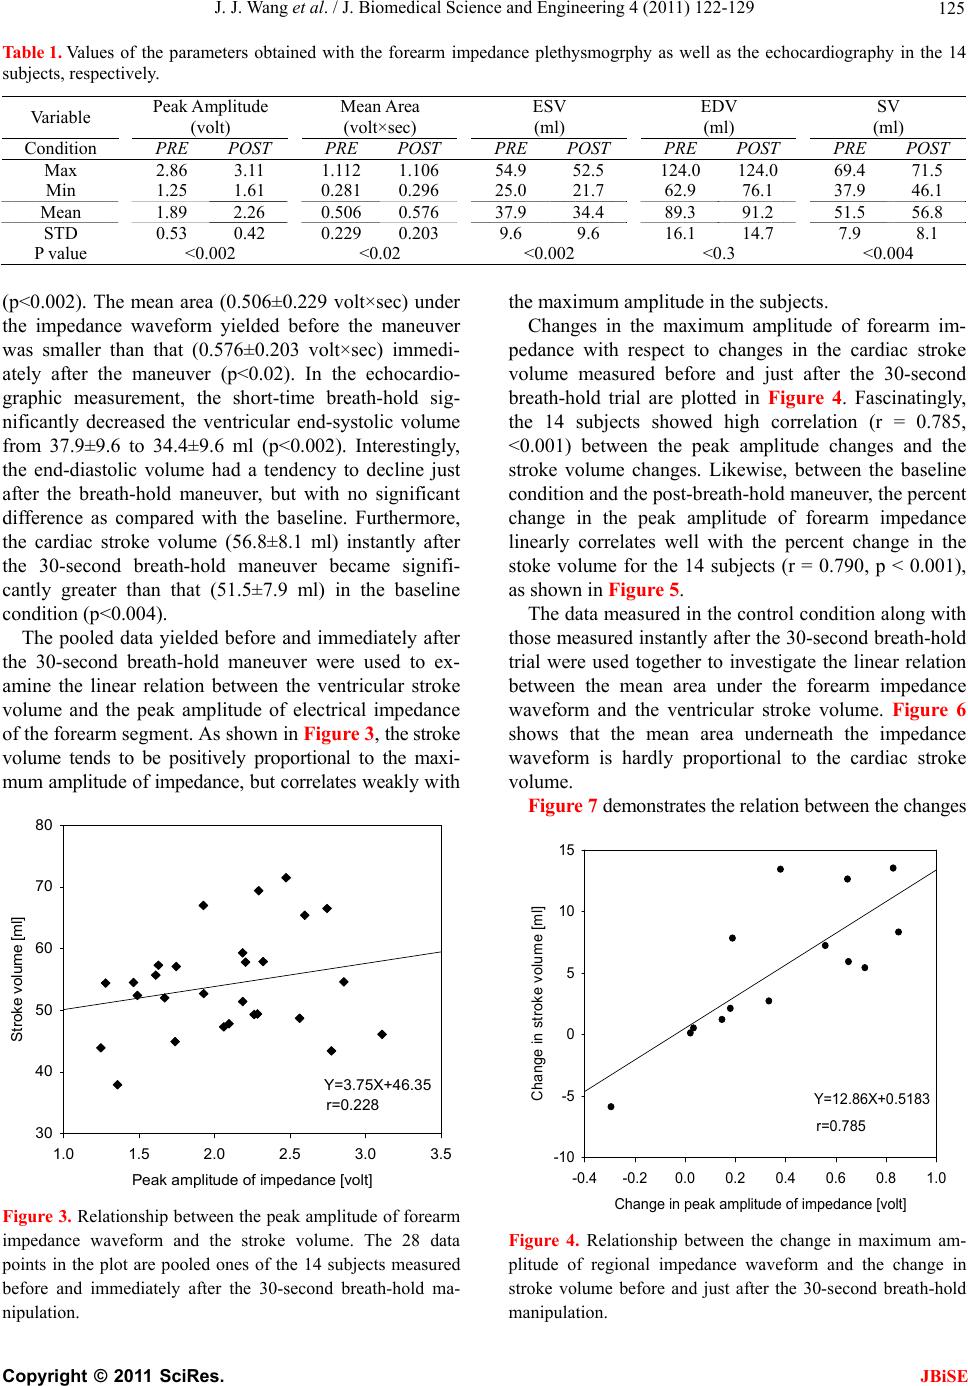
mine the absolute stroke volume. Our results show a
correlation coefficient of less than 0.3 between the
maximum impedance amplitude and stroke volume, with
a similar low coefficient between the underneath area of
the impedance wave and the stroke volume.
5. CONCLUSION
Linear relationships between the changes in amplitude of
and in the area under the forearm impedance waveform
and the changes in stroke volume are shown. Thus, the
forearm impedance plethysmography proposed may be
utilized to assess the beat-to-beat change in cardiac
stroke volume, suggesting its potential for long-term
monitoring ventricular pumping function.
6. ACKNOWLEDGEMENTS
This study was supported by the National Science Council, Taiwan, the
Republic of China, under grant numbers NSC 98-2221-E-214-005-
MY3 and NSC 98-2221-E-075B-001-MY2.
REFERENCES
[1] Absi, M.A., Lutterman, J. and Wetzel, G.T. (2010)
Noninvasive cardiac output monitoring in the pediatric
cardiac Intensive Care Unit. Current Opinion in
Cardiology, 25, 77-79.
doi:10.1097/HCO.0b013e3283362452
[2] Cohen, A.J., Arnaudov, D., Zabeeda, D., Schultheis, L.,
Lashinger, J. and Schachner, A. (1998) Non-invasive
measurement of cardiac output during coronary artery
bypass grafting. European Journal of Cardio-Thoracic
Surgery, 14, 64-69. doi:10.1016/S1010-7940(98)00135-3
[3] Cotter, G., Schachner, A., Sasson, L., Dekel, H. and
Moshkovitz, Y. (2006) Impedance cardiography revisited.
Physiological Measurement, 27, 817-827.
doi:10.1088/0967-3334/27/9/005
[4] Peng, Z.Y., Critchley, L.A., Fok, B.S. and James, A.E.
(2004) Evaluation of impedance based indices of cardiac
contractility in dogs. Journal of Clinical Monitoring and
Computing, 18, 103-109.
doi:10.1023/B:JOCM.0000032720.02801.e6
[5] Woltjer, H.H., Bogaard, H.J., Scheffer, G.J., van der
Spoel, H.I., Huybregts, M.A. and de Vries, P.M. (1996)
Standardization of non-invasive impedance cardiography
for assessment of stroke volume: comparison with
thermodilution. British Journal of Anaesthesia, 77,
748-752.
[6] Atallah, M.M. and Demain, A.D. (1995) Cardiac output
measurement: lack of agreement between thermodilution
and thoracic electric bioimpedance in two clinical
settings. Journal of Clinical Anesthesia, 7, 182-185.
doi:10.1016/0952-8180(94)00050-E
[7] Hahn, G., Sipinkova, I., Baisch, F. and Hellige, G. (1995)
Changes in the thoracic impedance distribution under
different ventilatory conditions. Physiological Measure-
ment, 16, A161-A173.
doi:10.1088/0967-3334/16/3A/016
[8] Imhoff, M., Lehner, J.H. and Lohlein, D. (2000)
Noninvasive whole-body electrical bioimpedance cardiac
output and invasive thermodilution cardiac output in
high-risk surgical patients. Critical Care Medicine, 28,
2812-2818. doi:10.1097/00003246-200008000-00022
[9] Kubicek, W.G., Kottke, J., Ramos, M.U., Patterson, R.P.,
Witsoe, D.A., Labree, J.W., Remole, W., Layman, T.E.,
Schoening, H. and Garamela, J. T. (1974) The Minnesota
impedance cardi ograph-theory and applications. Biomedical
Engineering, 9, 410-416.
[10] Leitman, M. , Sucher, E., Kalu ski, E., Wolf, R., Pele g, E.,
Moshkovitz, Y., Milo-Cotter, O., Vered, Z. and Cotter, G.
(2006) Non-invasive measurement of cardiac output by
whole-body bio-impedance during dobutamine stress
echocardiography: clinical implications in patients with
left ventricular dysfunction and ischaemia. European
Journal of Heart Failure, 8, 136-140.
doi:10.1016/j.ejheart.2005.06.006
[11] Cotter, G., Moshkovitz, Y., Kaluski, E., Cohen, A.,
Miller, J. H., Goor, D. and Vered, Z. (2004) Accurate,
noninvasive continuous monitoring of cardiac output by
whole-body electrical bioimpedance. Chest, 125,
1431-1440. doi:10.1378/chest.125.4.1431
[12] Critchley, L.A., Peng, Z.Y., Fok, B.S. and James, A.E.
(2005) The effect of peripheral resistance on impedance
cardiography measurements in the anesthetized dog.
Anesthesia and Analgesia, 100, 1708-1712 .
doi:10.1213/01.ANE.0000150602.40554.EB
[13] Wong, K.L. and Hou, P.C. (1996) The accuracy of
bioimpedance cardiography in the measurement of
cardiac output in comparison with thermodilution
method. Acta Anaesthesiologica Sinica, 34, 55-59.
[14] Nyboer, J. (1960) Regional pulse volume and perfusion
flow measurements: electrical impedance plethysmography.
Archives of Internal Medicine, 105, 264-276.
[15] Patterson, R.P., Wang, L. and Raza, S.B. (1991)
Impedance cardiography using band and regional
electrodes in supine, sitting, and during exercise. IEEE
C
opyright © 2011 SciRes. JBiSE
J. J. Wang et al. / J. Biomedical Science and Engineering 4 (2011) 122-129
Copyright © 2011 SciRes.
129
JBiSE
Transactions on Biomedical Engineering, 38, 393-400.
doi:10.1109/10.81557
[16] Adamicza, A., Tut sek, L ., Daroczy , B., Bari , F. and Nagy ,
S. (1994) The measurement of cardiac output in dogs by
impedance cardiography with different electrode arrange-
ments. Acta Physiological Hungarica, 82, 37-52.
[17] Paredes, O.L., Shite, J., Shinke, T., Watanabe, S., Otake,
H., Matsumoto, D., Imuro, Y., Ogasawara, D., Sawada, T.
and Yokoyama, M. (2006) Impedance cardiography for
cardiac output estimation: reliability of wrist-to-ankle
electrode configuration. Circulation Journal, 70,
1164-1168. doi:10.1253/circj.70.1164
[18] Wtorek, J. and Plinski, A. (2005) The contribution of
blood-flow-induced conductivity changes to measured
impedance,” IEEE Transactions on Biomedical Enginee-
ring, 52, 41-49. doi:10.1109/TBME.2004.839633
[19] Miles, D.S., Gotshall, R.W., Quinones, J.D., Wulfeck,
D.W. and Kreitzer, R.D. (1990) Impedance cardiography
fails to measure accurately left ventricular ejection
fraction. Critical Care Medicine, 18, 221-228.
doi:10.1097/00003246-199002000-00019
[20] Stout, C.L., Van de Water, J.M., Thompson, W.M.,
Bowers, E.W., Sheppard, S.W., Tewari, A.M. and Dalton
M.L. (2006) Impedance cardiography: can it replace
thermodilution and the pulmonary artery catheter? The
American Surgeon, 72, 728-732.