Paper Menu >>
Journal Menu >>
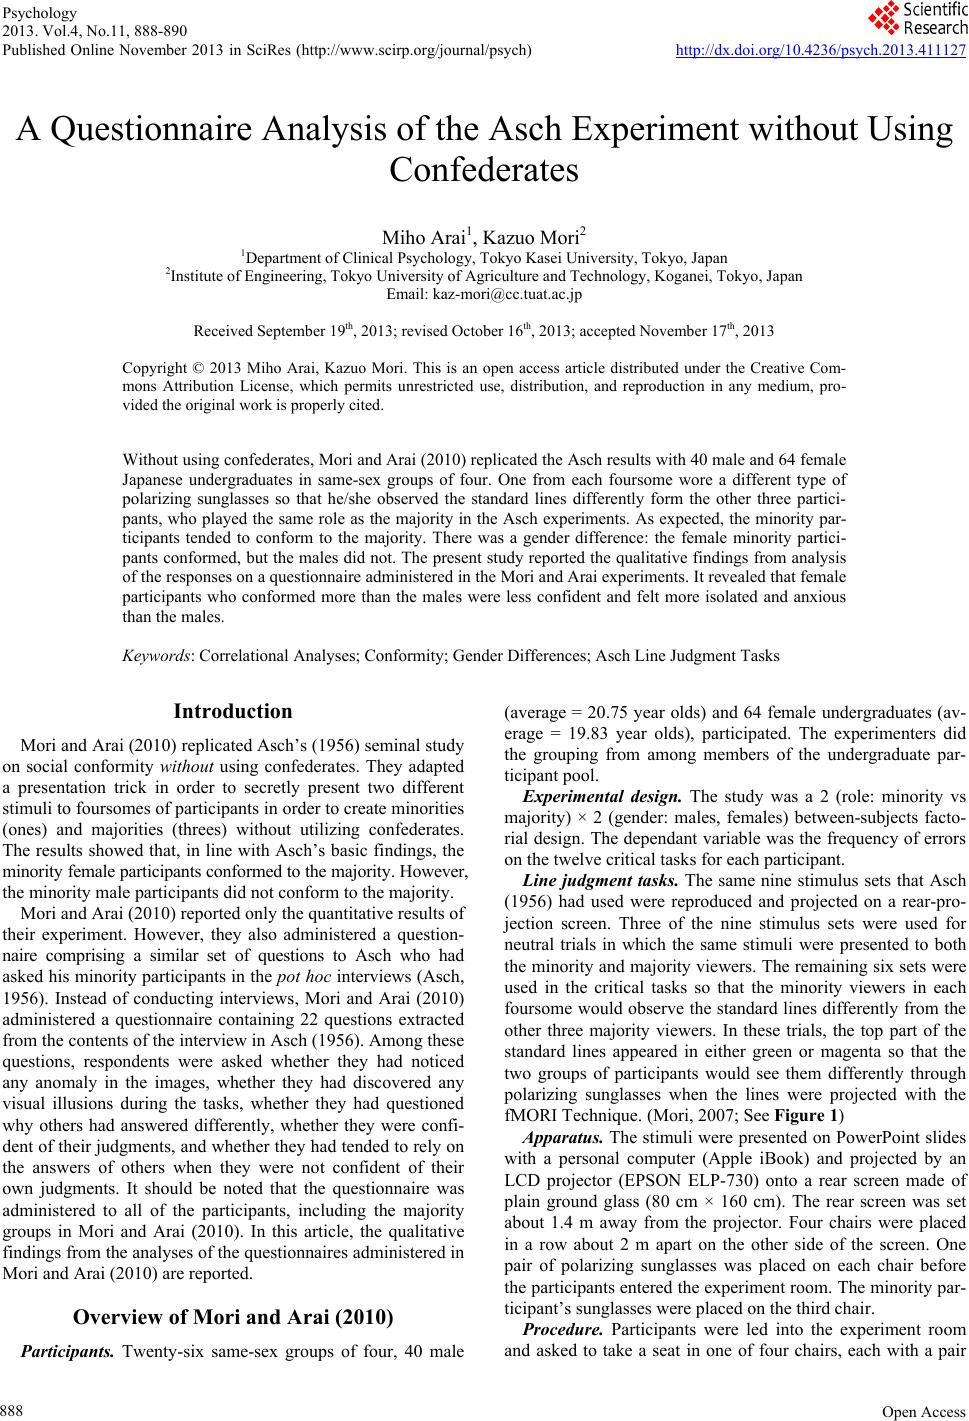 Psychology 2013. Vol.4, No.11, 888-890 Published Online November 2013 in SciRes (http://www.scirp.org/journal/psych) http://dx.doi.org/10.4236/psych.2013.411127 Open Access 888 A Questionnaire Analysis of the Asch Experiment without Using Confederates Miho Arai1, Kazuo Mori2 1Department of Clinical Psychology, Tokyo Kasei University, Tokyo, Japan 2Institute of Engineering, Tokyo University of Agriculture and Technology, Koganei, Tokyo, Japan Email: kaz-mori@cc.tuat.ac.jp Received September 19th, 2013; revised October 16th, 2013; accepted November 17th, 2013 Copyright © 2013 Miho Arai, Kazuo Mori. This is an open access article distributed under the Creative Com- mons Attribution License, which permits unrestricted use, distribution, and reproduction in any medium, pro- vided the original work is properly cited. Without using confederates, Mori and Arai (2010) replicated the Asch results with 40 male and 64 female Japanese undergraduates in same-sex groups of four. One from each foursome wore a different type of polarizing sunglasses so that he/she observed the standard lines differently form the other three partici- pants, who played the same role as the majority in the Asch experiments. As expected, the minority par- ticipants tended to conform to the majority. There was a gender difference: the female minority partici- pants conformed, but the males did not. The present study reported the qualitative findings from analysis of the responses on a questionnaire administered in the Mori and Arai experiments. It revealed that female participants who conformed more than the males were less confident and felt more isolated and anxious than the males. Keywords: Correlational Analyses; Conformity; Gender Differences; Asch Line Judgment Tasks Introduction Mori and Arai (2010) replicated Asch’s (1956) seminal study on social conformity without using confederates. They adapted a presentation trick in order to secretly present two different stimuli to foursomes of participants in order to create minorities (ones) and majorities (threes) without utilizing confederates. The results showed that, in line with Asch’s basic findings, the minority female participants conformed to the majority. However, the minority male participants did not conform to the majority. Mori and Arai (2010) reported only the quantitative results of their experiment. However, they also administered a question- naire comprising a similar set of questions to Asch who had asked his minority participants in the pot hoc interviews (Asch, 1956). Instead of conducting interviews, Mori and Arai (2010) administered a questionnaire containing 22 questions extracted from the contents of the interview in Asch (1956). Among these questions, respondents were asked whether they had noticed any anomaly in the images, whether they had discovered any visual illusions during the tasks, whether they had questioned why others had answered differently, whether they were confi- dent of their judgments, and whether they had tended to rely on the answers of others when they were not confident of their own judgments. It should be noted that the questionnaire was administered to all of the participants, including the majority groups in Mori and Arai (2010). In this article, the qualitative findings from the analyses of the questionnaires administered in Mori and Arai (2010) are reported. Overview of Mori and Arai (2010) Participants. Twenty-six same-sex groups of four, 40 male (average = 20.75 year olds) and 64 female undergraduates (av- erage = 19.83 year olds), participated. The experimenters did the grouping from among members of the undergraduate par- ticipant pool. Experimental design. The study was a 2 (role: minority vs majority) × 2 (gender: males, females) between-subjects facto- rial design. The dependant variable was the frequency of errors on the twelve critical tasks for each participant. Line judgment tasks. The same nine stimulus sets that Asch (1956) had used were reproduced and projected on a rear-pro- jection screen. Three of the nine stimulus sets were used for neutral trials in which the same stimuli were presented to both the minority and majority viewers. The remaining six sets were used in the critical tasks so that the minority viewers in each foursome would observe the standard lines differently from the other three majority viewers. In these trials, the top part of the standard lines appeared in either green or magenta so that the two groups of participants would see them differently through polarizing sunglasses when the lines were projected with the fMORI Technique. (Mori, 2007; See Figure 1) Apparatus. The stimuli were presented on PowerPoint slides with a personal computer (Apple iBook) and projected by an LCD projector (EPSON ELP-730) onto a rear screen made of plain ground glass (80 cm × 160 cm). The rear screen was set about 1.4 m away from the projector. Four chairs were placed in a row about 2 m apart on the other side of the screen. One pair of polarizing sunglasses was placed on each chair before the participants entered the experiment room. The minority par- ticipant’s sunglasses were placed on the third chair. Procedure. Participants were led into the experiment room and asked to take a seat in one of four chairs, each with a pair 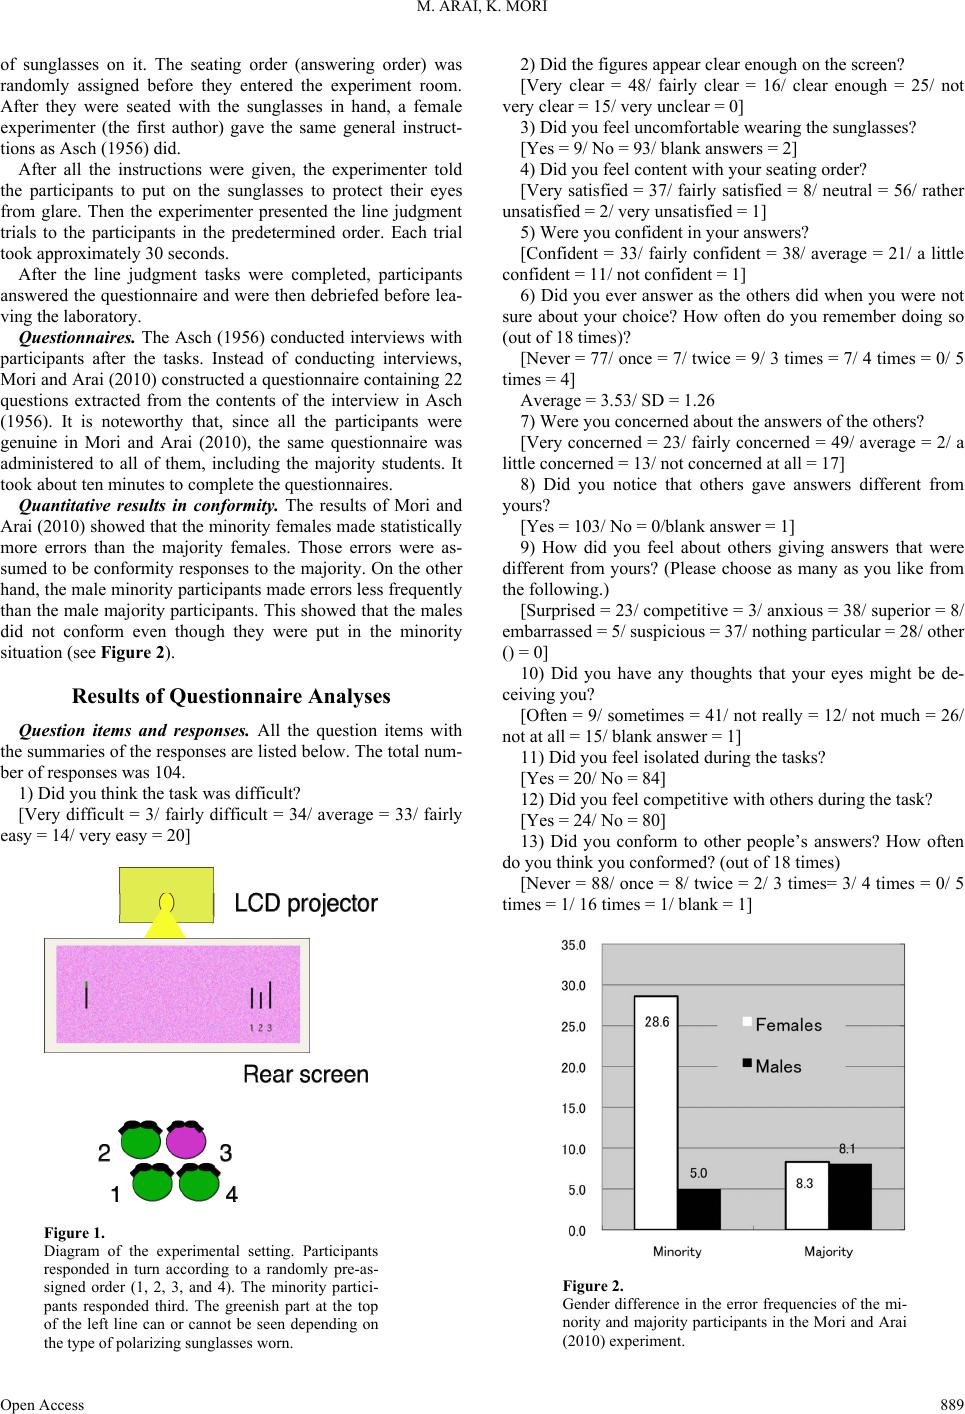 M. ARAI, K. MORI of sunglasses on it. The seating order (answering order) was randomly assigned before they entered the experiment room. After they were seated with the sunglasses in hand, a female experimenter (the first author) gave the same general instruct- tions as Asch (1956) did. After all the instructions were given, the experimenter told the participants to put on the sunglasses to protect their eyes from glare. Then the experimenter presented the line judgment trials to the participants in the predetermined order. Each trial took approximately 30 seconds. After the line judgment tasks were completed, participants answered the questionnaire and were then debriefed before lea- ving the laboratory. Questionnaires. The Asch (1956) conducted interviews with participants after the tasks. Instead of conducting interviews, Mori and Arai (2010) constructed a questionnaire containing 22 questions extracted from the contents of the interview in Asch (1956). It is noteworthy that, since all the participants were genuine in Mori and Arai (2010), the same questionnaire was administered to all of them, including the majority students. It took about ten minutes to complete the questionnaires. Quantitative results in conformity. The results of Mori and Arai (2010) showed that the minority females made statistically more errors than the majority females. Those errors were as- sumed to be conformity responses to the majority. On the other hand, the male minority participants made errors less frequently than the male majority participants. This showed that the males did not conform even though they were put in the minority situation (see Figure 2). Results of Questionnaire Analyses Question items and responses. All the question items with the summaries of the responses are listed below. The total num- ber of responses was 104. 1) Did you think the task was difficult? [Very difficult = 3/ fairly difficult = 34/ average = 33/ fairly easy = 14/ very easy = 20] Figure 1. Diagram of the experimental setting. Participants responded in turn according to a randomly pre-as- signed order (1, 2, 3, and 4). The minority partici- pants responded third. The greenish part at the top of the left line can or cannot be seen depending on the type of polarizing sunglasses worn. 2) Did the figures appear clear enough on the screen? [Very clear = 48/ fairly clear = 16/ clear enough = 25/ not very clear = 15/ very unclear = 0] 3) Did you feel uncomfortable wearing the sunglasses? [Yes = 9/ No = 93/ blank answers = 2] 4) Did you feel content with your seating order? [Very satisfied = 37/ fairly satisfied = 8/ neutral = 56/ rather unsatisfied = 2/ very unsatisfied = 1] 5) Were you confident in your answers? [Confident = 33/ fairly confident = 38/ average = 21/ a little confident = 11/ not confident = 1] 6) Did you ever answer as the others did when you were not sure about your choice? How often do you remember doing so (out of 18 times)? [Never = 77/ once = 7/ twice = 9/ 3 times = 7/ 4 times = 0/ 5 times = 4] Average = 3.53/ SD = 1.26 7) Were you concerned about the answers of the others? [Very concerned = 23/ fairly concerned = 49/ average = 2/ a little concerned = 13/ not concerned at all = 17] 8) Did you notice that others gave answers different from yours? [Yes = 103/ No = 0/blank answer = 1] 9) How did you feel about others giving answers that were different from yours? (Please choose as many as you like from the following.) [Surprised = 23/ competitive = 3/ anxious = 38/ superior = 8/ embarrassed = 5/ suspicious = 37/ nothing particular = 28/ other () = 0] 10) Did you have any thoughts that your eyes might be de- ceiving you? [Often = 9/ sometimes = 41/ not really = 12/ not much = 26/ not at all = 15/ blank answer = 1] 11) Did you feel isolated during the tasks? [Yes = 20/ No = 84] 12) Did you feel competitive with others during the task? [Yes = 24/ No = 80] 13) Did you conform to other people’s answers? How often do you think you conformed? (out of 18 times) [Never = 88/ once = 8/ twice = 2/ 3 times= 3/ 4 times = 0/ 5 times = 1/ 16 times = 1/ blank = 1] Figure 2. Gender difference in the error frequencies of the mi- nority and majority participants in the Mori and Arai (2010) experiment. Open Access 889  M. ARAI, K. MORI Open Access 890 Average = 0.41/ SD = 1.73 14) How often did you have difficulty in choosing between two alternatives (out of 18 times)? [Never = 11/ once = 10/ twice = 32/ 3 times = 22/ 4 times = 5/ 5 times = 15/ 6 times = 5/ 10 times = 4] Average = 2.93/ SD = 2.15 15) Do you think it would have been easier to do this task alone? [Yes = 48/ No = 55/ blank answer = 1] 16) Do you think you would have stuck to your own answers if the task had been measuring your intelligence? [I strongly think so = 21/ I think so = 36/ I’m not sure = 30/ I think not = 15/ Not at all = 2] 17) Have you ever heard of a psychology experiment like this? [Yes, I know it very well. = 2/ I have heard of it in class. = 10 / I vaguely know of it. = 17/ I have no knowledge of it at all. = 74] 18) Which of the following do you usually consider most when you make a judgment? [My own ideas = 72/ opinions of my close friends = 12/ ob- jective data = 13/ social consensus = 4/ opinion of elders = 2/ other = 0/ blank answer = 1] 19) Are you generally confident? [Highly confident = 4/ fairly confident = 20/ average = 46/ a little confident = 26/ not very confident = 6/ blank answers = 2] 20) Do you usually wear glasses? [Normal vision without glasses = 39/ with glasses = 13/ with contact lenses = 49/ blank answers = 3] 21) What color was the background of the slides you ob- served? Those who observed Magenta: right answers = 49/ wrong answers = 5 Those who observed Green: right answers = 43/ wrong an- swers = 6/ blank answer = 1 22) Did you have any close friends in the task group today? [Yes = 51 (average = 1.53)/ No = 50/ blank answers = 3] 23) What is your age and sex? [20.18 years old: Males = 40 (average = 20.75 yr olds)/ Fe- males = 64 (average = 19.83 yr olds)] Task difficulty and uncertainty ratings. A significant corre- lation was found between the number of errors and the diffi- culty ratings (r = .36, F = 15.03, p < .01). The more difficult they rated the task, the more errors they made. However, no differences were found in the task-difficulty rating patterns among male and female participants (r = .48 vs. r = .31). A significant correlation was found between uncertainty experi- ences and conformity (r = .46, F = 26.71, p < .01). Those who felt uncertain more often during the task made more errors. However, the same tendency was found among male and fe- male participants (r = .37 vs. r = .46). Therefore, neither task difficulty nor uncertainty was a relevant factor to explain why female participants conformed more. Less confident females conformed more. There was a sig- nificant correlation between the number of conformities and confidence ratings (r = −.53, F = 40.36, p < .01). Those who made more conformity responses were less confident in their answers. Also found was a significant difference in the confi- dence ratings between males and females ( , p < .05). Female participants, minority as well as majority ones, were less confident about their answers than male participants (, p < .05). 2 38.48 3 Meta-cognition of conformity. Those who conformed were conscious of their conforming responses. There was a signifi- cant correlation only among female participants between the actual conformity rates and their meta-cognition (r = .576, F = 30.87, p < .01). The corresponding correlation coefficient for males was .046, F = 0.08, ns). No other questionnaire items showed remarkable disparity related to gender conformity dif- ference. 29.25 Conclusion According to the analyses of the questionnaire, the following interpretations may be drawn. In general, females may be less confident than males. It is natural that people tend to conform more to others when they are less confident. Therefore, the fe- male minority participants consciously conformed more to the majority on the task in this study. They also felt more isolated than the male minority participants. However, since the questionnaire was conducted after the task, the causal pattern might be the other way around. Those who performed poorly on the task might have answered that they were less confident because of their poor performance. It would have been desirable to administer a questionnaire before as well as after the task. Acknowledgements This experiment was done while the authors were at Shinshu University. This research was supported by a Grant-in-Aid from the Japanese Ministry of Education, Culture, Sports, Sci- ence, and Technology (Grant No.16653054) to the second au- thor. We wish to express out thanks to Rebecca Ann Marck for her help during the preparation of the manuscript. REFERENCES Asch, S. E. (1956). Studies of independence and conformity: I. A mi- nority of one against a unanimous majority. Psychological Mono- graph: General and Applied, 70, Whole No. 416. Mori, K. (2007). Projecting two words with one machine: A method for presenting two different visual stimuli using just one projector with- out viewers’ noticing the duality. Behavior Research Methods, 39, 811-815. Mori, K., & Arai, M. (2010). No need to fake it: Reproduction of the Asch experiment without confederates. International Journal of Psy- chology, 45, 390-397. |