 Open Journal of Pediatrics, 2013, 3, 370-376 OJPed http://dx.doi.org/10.4236/ojped.2013.34067 Published Online December 2013 (http://www.scirp.org/journal/ojped/) OPEN ACCESS Changes in confirmed plus borderline cases of congenital hypothyroidism in California as a function of environmental fallout from the Fukushima nuclear meltdown Joseph Mangano1, Janette Sherman1, Christopher Busby2 1Radiation and Public Health Project, New York, USA 2Green Audit, Aberystwyth, UK Email: odiejoe@aol.com Received 16 October 2013; revised 9 November 2013; accepted 16 November 2013 Copyright © 2013 Joseph Mangano et al. This is an open access article distributed under the Creative Commons Attribution License, which permits unrestricted use, distribution, and reproduction in any medium, provided the original work is properly cited. ABSTRACT Radiation exposure has been linked to increased risk of congenital hypothyroidism (CH) for decades. CH is a relatively uncommon condition, occurring in about 1 of 2000 US births. Thyroid Stimulating Hormone (TSH) levels for each child born in California per- mitted an analysis of combined confirmed and bor- derline CH cases. Borderline/confirmed CH cases are more than seven times greater than just confirmed cases. Airborne levels of gross beta nuclear radiation in the US were elevated in the period starting several days after the Fukushima nuclear meltdown, espe- cially in west coast states like California. The border- line/confirmed CH rate for newborns during the last 9.5 months in 2011 (exposed to Fukushima in utero) vs. births during other periods in 2011 and 2012 (not exposed) was significantly elevated, suggesting that adverse health effects to the newborn thyroid were not restricted to just a small number of confirmed CH cases. The sensitivity of the fetus to radiation ex- posure, plus the presence of thyroid-seeking radioio- dine, suggest further analysis of Fukushima’s poten- tial to cause adverse health effects in newborns is needed. Keywords: Congenital Hypothyroidism; Fukushima Dai-Ichi; Nuclear Meltdown; Fetal Thyroid 1. INTRODUCTION Risk of developing congenital hypothyroidism (CH) has been linked to fetal exposure in several populations. The earliest elevated CH rates were documented after expo- sures to high doses of radioiodine. These populations include residents of the Marshall Islands exposed to 1954 hydrogen bomb tests [1,2] as well as subsequent nuclear tests [3-6]. Similar risk of disease was found in Gomel, Belarus, proximate to the 1986 meltdown of the Chernobyl nu- clear reactor [7]. A twofold CH increase was docu- mented downwind of the Three Mile Island nuclear plant in births during the nine months after the partial melt- down in 1979, while no change occurred upwind [8,9]. The heightened sensitivity of the fetus to radioactivity [10], the documented risk to human health after rela- tively low-dose exposure, and the known biochemical hazards of thyroid-seeking radioiodine isotopes jointly increase risk of CH in newborns exposed to radioactive iodine. In northwest US states, CH rates rose most sharply after Chernobyl, after sustaining the heaviest fallout in the nation, including I-131 detected in milk [11]. The main path of exposure to short-lived isotopes such as I-131 has long been acknowledged to be via dairy products due to radioactive fallout deposition on forage. The current CH rate in the four counties closest to the Indian Point (NY) power plant is approximately twice that of the US [12]. In a recent report, two of us (JM and JS) documented that the greatest concentrations of I-131 in US precipi- tation following the 2011 meltdown at the Fukushima nuclear plant occurred in the three Pacific coast states of California, Oregon, and Washington, along with Alaska and Hawaii [13]. Levels were much lower than those observed in Japan, but well above previous levels. The report showed that in the nine months following the ar- rival of Japanese fallout in the US, CH rates in the five states increased significantly (RR = 1.16, p < 0.03). The 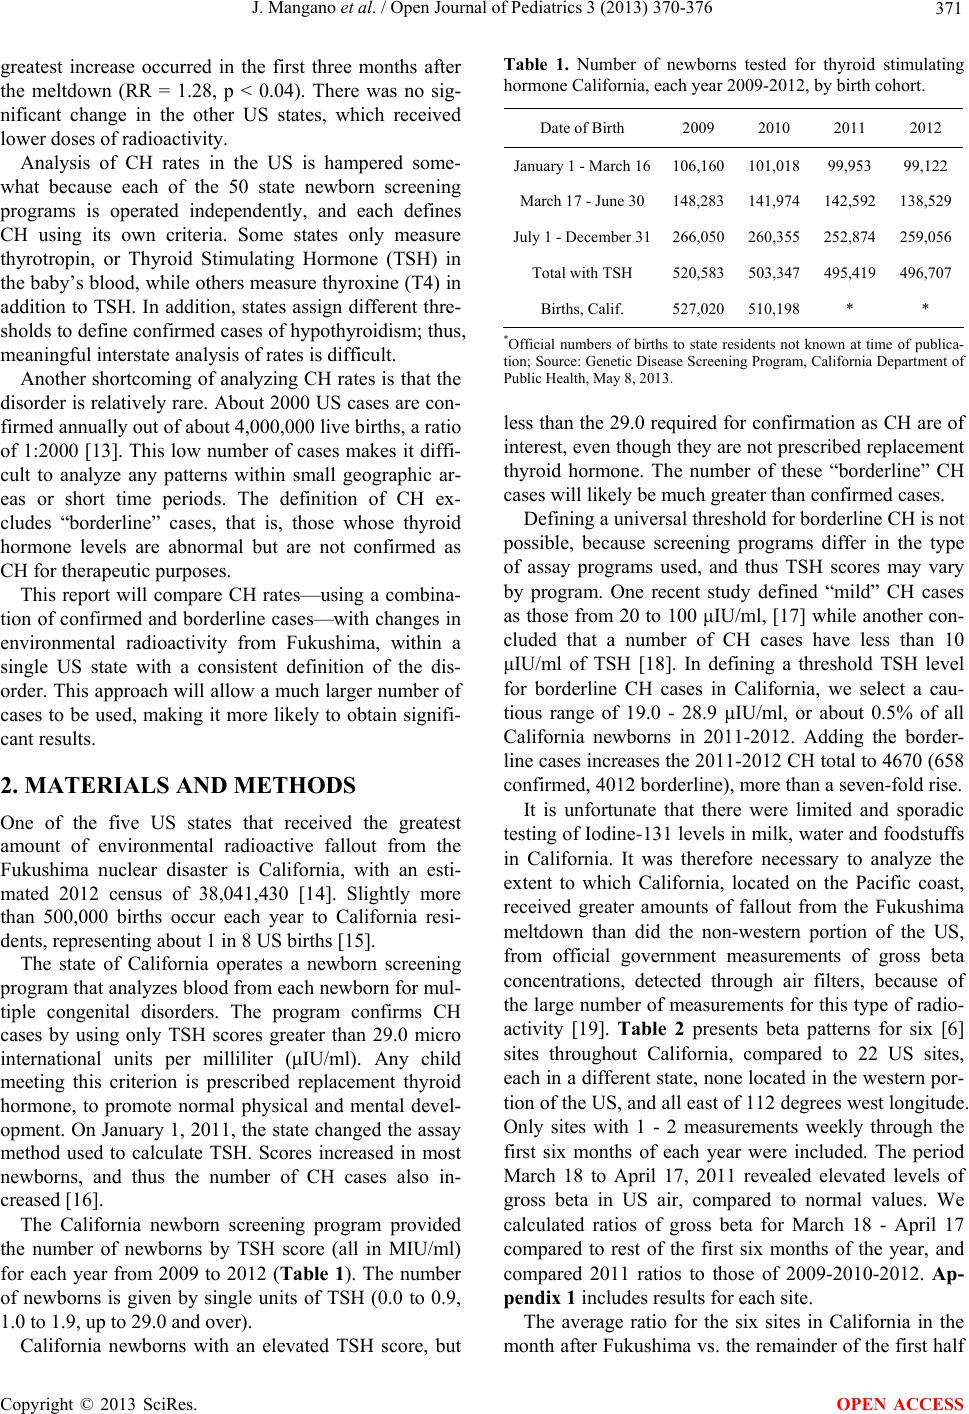 J. Mangano et al. / Open Journal of Pediatrics 3 (2013) 370-376 Copyright © 2013 SciRes. OPEN ACCESS 371 greatest increase occurred in the first three months after the meltdown (RR = 1.28, p < 0.04). There was no sig- nificant change in the other US states, which received lower doses of radioactivity. Analysis of CH rates in the US is hampered some- what because each of the 50 state newborn screening programs is operated independently, and each defines CH using its own criteria. Some states only measure thyrotropin, or Thyroid Stimulating Hormone (TSH) in the baby’s blood, while others measure thyroxine (T4) in addition to TSH. In addition, states assign different thre- sholds to define confirmed cases of hypothyroidism; thus, meaningful interstate analysis of rates is difficult. Another shortcoming of analyzing CH rates is that the disorder is relatively rare. About 2000 US cases are con- firmed annually out of about 4,000,000 live births, a ratio of 1:2000 [13]. This low number of cases makes it diffi- cult to analyze any patterns within small geographic ar- eas or short time periods. The definition of CH ex- cludes “borderline” cases, that is, those whose thyroid hormone levels are abnormal but are not confirmed as CH for therapeutic purposes. This report will compare CH rates—using a combina- tion of confirmed and borderline cases—with changes in environmental radioactivity from Fukushima, within a single US state with a consistent definition of the dis- order. This approach will allow a much larger number of cases to be used, making it more likely to obtain signifi- cant results. 2. MATERIALS AND METHODS One of the five US states that received the greatest amount of environmental radioactive fallout from the Fukushima nuclear disaster is California, with an esti- mated 2012 census of 38,041,430 [14]. Slightly more than 500,000 births occur each year to California resi- dents, representing about 1 in 8 US births [15]. The state of California operates a newborn screening program that analyzes blood from each newborn for mul- tiple congenital disorders. The program confirms CH cases by using only TSH scores greater than 29.0 micro international units per milliliter (μIU/ml). Any child meeting this criterion is prescribed replacement thyroid hormone, to promote normal physical and mental devel- opment. On January 1, 2011, the state changed the assay method used to calculate TSH. Scores increased in most newborns, and thus the number of CH cases also in- creased [16]. The California newborn screening program provided the number of newborns by TSH score (all in MIU/ml) for each year from 2009 to 2012 (Table 1). The number of newborns is given by single units of TSH (0.0 to 0.9, 1.0 to 1.9, up to 29.0 and over). California newborns with an elevated TSH score, but Table 1. Number of newborns tested for thyroid stimulating hormone California, each year 2009-2012, by birth cohort. Date of Birth 2009 2010 2011 2012 January 1 - March 16106,160101,018 99,953 99,122 March 17 - June 30 148,283141,974 142,592138,529 July 1 - December 31266,050260,355 252,874259,056 Total with TSH 520,583503,347 495,419496,707 Births, Calif. 527,020510,198 * * *Official numbers of births to state residents not known at time of publica- tion; Source: Genetic Disease Screening Program, California Department of Public Health, May 8, 2013. less than the 29.0 required for confirmation as CH are of interest, even though they are not prescribed replacement thyroid hormone. The number of these “borderline” CH cases will likely be much greater than confirmed cases. Defining a universal threshold for borderline CH is not possible, because screening programs differ in the type of assay programs used, and thus TSH scores may vary by program. One recent study defined “mild” CH cases as those from 20 to 100 μIU/ml, [17] while another con- cluded that a number of CH cases have less than 10 μIU/ml of TSH [18]. In defining a threshold TSH level for borderline CH cases in California, we select a cau- tious range of 19.0 - 28.9 μIU/ml, or about 0.5% of all California newborns in 2011-2012. Adding the border- line cases increases the 2011-2012 CH total to 4670 (658 confirmed, 4012 borderline), more than a seven-fold rise. It is unfortunate that there were limited and sporadic testing of Iodine-131 levels in milk, water and foodstuffs in California. It was therefore necessary to analyze the extent to which California, located on the Pacific coast, received greater amounts of fallout from the Fukushima meltdown than did the non-western portion of the US, from official government measurements of gross beta concentrations, detected through air filters, because of the large number of measurements for this type of radio- activity [19]. Table 2 presents beta patterns for six [6] sites throughout California, compared to 22 US sites, each in a different state, none located in the western por- tion of the US, and all east of 112 degrees west longitude. Only sites with 1 - 2 measurements weekly through the first six months of each year were included. The period March 18 to April 17, 2011 revealed elevated levels of gross beta in US air, compared to normal values. We calculated ratios of gross beta for March 18 - April 17 compared to rest of the first six months of the year, and compared 2011 ratios to those of 2009-2010-2012. Ap- pendix 1 includes results for each site. The average ratio for the six sites in California in the month after Fukushima vs. the remainder of the first half  J. Mangano et al. / Open Journal of Pediatrics 3 (2013) 370-376 Copyright © 2013 SciRes. OPEN ACCESS 372 Table 2. Ratios, March 18 - April 17 vs. other first six months of the year, gross beta concentrations in air filter samples, 2011 vs. 2009-2010-2012 Combined, in picocuries per Cubic meter, six California sites and 22 Non-Western US sites. March 18 - April 17 Avg. Beta, 2011 Avg. Beta, 2009-10-12 vs. Other 1st Half Yr. 2011 vs. Area 3/18-4/17 Oth. 1st Half 3/18-4/17 Oth. 1st Half 2011 2009-10-12 2009-10-12 California 48.27 × 10⁻³ (54) 6.40 × 10⁻³ (190) 5.12 × 10⁻³ (119) 6.88 × 10⁻³ (547)7.99 0.76 10.53 Other US 20.21 × 10⁻³ (179) 8.40 × 10⁻³ (547) 8.40 × 10⁻³ (526) 9.19 × 10⁻³ (2431)2.34 0.92 2.55 Source: US Environmental Protection Agency. Environmental Radiation Ambient Monitoring System (ERAMS). http://oaspub.epa.gov/enviro/erams_query.simple_query 2011 was 7.99. In the other three years, the ratio was 0.76, as airborne beta concentrations during the winter months are typically greater than in the spring. Thus, California beta was 10.53 times greater than expected during the period March 18 - April 17, 2011 (7.99/0.76). For the other 22 US sites the 2011 average gross beta in the month after Fukushima was 2.34 times greater than the rest of the first half year, compared to 0.92 for 2009, 2010, and 2012. Thus, average beta was 2.55 times greater than expected (2.34/0.92), far less than the 10.53 figure for California sites. Appendix 1 shows some variation in gross beta aver- ages between California sites, but consistently higher concentrations in that state. The highest readings oc- curred at the station in Anaheim CA, a suburb of Los Angeles; 7 of the 17 measurements in the month after Fukushima were over 172.0-3 picocuries per cubic meter, compared to an average reading of 6.7-3 for that period in non-Fukushima years. The single high measurement in California was 276.0-3 on March 19, 2011. Fukushima fallout levels were greater in California than in most of the U.S., raising the question of whether health of hu- mans, especially the fetus, was affected adversely. The 2011-2012 change in the proportion of California births with a TSH score greater than 19.0 μIU/ml will be analyzed. Because births in the last 9.5 months of 2011 were exposed in utero to the elevated levels of radioac- tivity from Japan, we expect an elevated 2011-2012 re- duction in the proportion of elevated TSH scores to occur in the births from March 17 - December 31. The cohort of persons born January 1 - March 16 was not affected in utero by Fukushima in 2011 or 2012. 3. RESULTS The rate of newborns with a TSH score over 19.0 μIU/ml for various 2011 birth cohorts is given in Table 3. We were interested in comparing CH rates before and after presence of Fukushima fallout. However, because the state of California changed its assay method used to de- termine TSH scores on January 1, 2011, resulting in higher scores for many newborns in 2011, no meaningful Table 3. Confirmed and borderline congenital hypothyroid incidence, by period of birth, California newborns, 2011 and 2012. NewbornsTSH > 19 μIU/ml TSH > 29 μIU/ml Period TestedNo., Per 100,000 No., Per 100,000 Exposed 1/1 - 3/16, 201199,953500 500.2 69 69.0N 3/17 - 6/30, 2011142,592777 544.9 94 65.9Y 7/1 - 12/31, 2011252,8741360 537.8 200 79.1Y 1/1 - 3/16, 201299,122450 454.0 63 63.6N 3/17 - 6/30, 2012138,529504 363.8 88 63.5N 7/1 - 12/31, 2012259,0561079 416.5 144 55.6N Source: Genetic Disease Screening Program, California Department of Public Health, May 8, 2013. comparison with prior years is possible. In order to produce an analysis of newborns most af- fected by Fukushima fallout, the years 2011 and 2012 were divided into the periods January 1 to March 16, March 17 to June 30, and July 1 to December 31. Table 3 includes the number of births in each of these periods by year and numbers and rates per 100,000 tested for newborns with TSH scores over 19 and over 29 μIU/ml. There was fairly complete coverage of newborns. Births with a known TSH score reported by the state program for 2009 and 2010 equaled 98.7% of the total births to California residents (final 2011 and 2012 birth totals are not yet known). We carried out statistical tests on the basis of periods which we defined as “exposed” (new- borns born in the 9.5 months after Fukushima fallout arrived in the US) and “unexposed” (all other 2011 and 2012 newborns) in Table 3. Results of the statistical sig- nificance test, using a Mantel Haenszel chi-square test are given in Table 4. The CH rate for the cohort born March 17 to Decem- ber 31, 2011, or those exposed in utero to environmental radioactivity from Fukushima was significantly elevated from those born in other periods in 2011 and 2012, for confirmed cases (p < 0.013). Adding borderline cases to 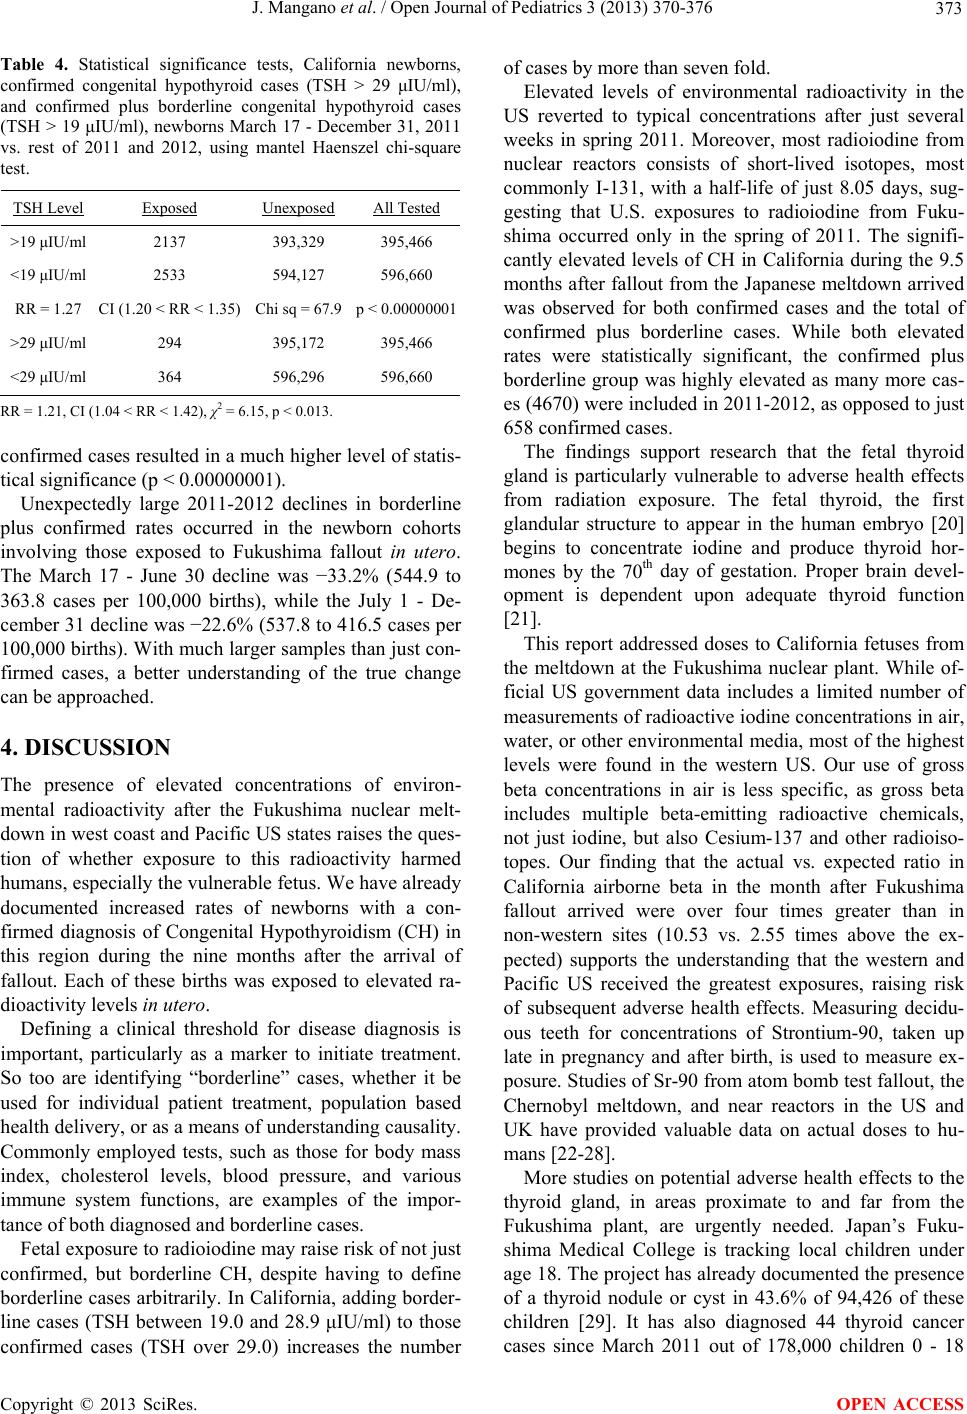 J. Mangano et al. / Open Journal of Pediatrics 3 (2013) 370-376 Copyright © 2013 SciRes. OPEN ACCESS 373 Table 4. Statistical significance tests, California newborns, confirmed congenital hypothyroid cases (TSH > 29 μIU/ml), and confirmed plus borderline congenital hypothyroid cases (TSH > 19 μIU/ml), newborns March 17 - December 31, 2011 vs. rest of 2011 and 2012, using mantel Haenszel chi-square test. TSH Level Exposed Unexposed All Tested >19 μIU/ml 2137 393,329 395,466 <19 μIU/ml 2533 594,127 596,660 RR = 1.27 CI (1.20 < RR < 1.35)Chi sq = 67.9 p < 0.00000001 >29 μIU/ml 294 395,172 395,466 <29 μIU/ml 364 596,296 596,660 RR = 1.21, CI (1.04 < RR < 1.42), χ2 = 6.15, p < 0.013. confirmed cases resulted in a much higher level of statis- tical significance (p < 0.00000001). Unexpectedly large 2011-2012 declines in borderline plus confirmed rates occurred in the newborn cohorts involving those exposed to Fukushima fallout in utero. The March 17 - June 30 decline was -33.2% (544.9 to 363.8 cases per 100,000 births), while the July 1 - De- cember 31 decline was -22.6% (537.8 to 416.5 cases per 100,000 births). With much larger samples than just con- firmed cases, a better understanding of the true change can be approached. 4. DISCUSSION The presence of elevated concentrations of environ- mental radioactivity after the Fukushima nuclear melt- down in west coast and Pacific US states raises the ques- tion of whether exposure to this radioactivity harmed humans, especially the vulnerable fetus. We have already documented increased rates of newborns with a con- firmed diagnosis of Congenital Hypothyroidism (CH) in this region during the nine months after the arrival of fallout. Each of these births was exposed to elevated ra- dioactivity levels in utero. Defining a clinical threshold for disease diagnosis is important, particularly as a marker to initiate treatment. So too are identifying “borderline” cases, whether it be used for individual patient treatment, population based health delivery, or as a means of understanding causality. Commonly employed tests, such as those for body mass index, cholesterol levels, blood pressure, and various immune system functions, are examples of the impor- tance of both diagnosed and borderline cases. Fetal exposure to radioiodine may raise risk of not just confirmed, but borderline CH, despite having to define borderline cases arbitrarily. In California, adding border- line cases (TSH between 19.0 and 28.9 μIU/ml) to those confirmed cases (TSH over 29.0) increases the number of cases by more than seven fold. Elevated levels of environmental radioactivity in the US reverted to typical concentrations after just several weeks in spring 2011. Moreover, most radioiodine from nuclear reactors consists of short-lived isotopes, most commonly I-131, with a half-life of just 8.05 days, sug- gesting that U.S. exposures to radioiodine from Fuku- shima occurred only in the spring of 2011. The signifi- cantly elevated levels of CH in California during the 9.5 months after fallout from the Japanese meltdown arrived was observed for both confirmed cases and the total of confirmed plus borderline cases. While both elevated rates were statistically significant, the confirmed plus borderline group was highly elevated as many more cas- es (4670) were included in 2011-2012, as opposed to just 658 confirmed cases. The findings support research that the fetal thyroid gland is particularly vulnerable to adverse health effects from radiation exposure. The fetal thyroid, the first glandular structure to appear in the human embryo [20] begins to concentrate iodine and produce thyroid hor- mones by the 70th day of gestation. Proper brain devel- opment is dependent upon adequate thyroid function [21]. This report addressed doses to California fetuses from the meltdown at the Fukushima nuclear plant. While of- ficial US government data includes a limited number of measurements of radioactive iodine concentrations in air, water, or other environmental media, most of the highest levels were found in the western US. Our use of gross beta concentrations in air is less specific, as gross beta includes multiple beta-emitting radioactive chemicals, not just iodine, but also Cesium-137 and other radioiso- topes. Our finding that the actual vs. expected ratio in California airborne beta in the month after Fukushima fallout arrived were over four times greater than in non-western sites (10.53 vs. 2.55 times above the ex- pected) supports the understanding that the western and Pacific US received the greatest exposures, raising risk of subsequent adverse health effects. Measuring decidu- ous teeth for concentrations of Strontium-90, taken up late in pregnancy and after birth, is used to measure ex- posure. Studies of Sr-90 from atom bomb test fallout, the Chernobyl meltdown, and near reactors in the US and UK have provided valuable data on actual doses to hu- mans [22-28]. More studies on potential adverse health effects to the thyroid gland, in areas proximate to and far from the Fukushima plant, are urgently needed. Japan’s Fuku- shima Medical College is tracking local children under age 18. The project has already documented the presence of a thyroid nodule or cyst in 43.6% of 94,426 of these children [29]. It has also diagnosed 44 thyroid cancer cases since March 2011 out of 178,000 children 0 - 18  J. Mangano et al. / Open Journal of Pediatrics 3 (2013) 370-376 Copyright © 2013 SciRes. OPEN ACCESS 374 tested an annual rate of over 12 cases per 100,000 per- sons vs. an expected annual rate based on the analysis of the Japan Cancer Surveillance Group of 0.15 per 100,000 in 2005 [30]. This is a remarkably high Standardised Incidence Ratio of 80. More suspected child cancers have not yet been confirmed [31]. Studies should not be limited to the Fukushima area because doses in distant locations may be lower. Fallout from the meltdown crossed the Pacific Ocean and reached the US west coast in five [5] days, eventually circling the entire northern hemisphere. Thus, many were exposed to relatively low doses of Fukushima radioactiv- ity—which nonetheless pose a risk to human health. In its last two reports on the topic, the Committee on Bio- logical Effects of Ionizing Radiation (BEIR) concluded a linear no-threshold dose response exists between radia- tion and health risk, and upheld the heightened sensitive- ity of the fetus and infant [32,33]. Stewart and others demonstrated a near-doubling of childhood cancer mor- tality risk after exposure to in utero pelvic X-rays during pregnancy [34-36]. The US Institute of Medicine and National Research Council estimated as many as 212,000 Americans developed thyroid cancer after fetal/infant/ childhood exposure to relatively low-dose radioactive I-131 from atmospheric nuclear weapons tests over the Nevada desert [37,38]. 5. CONCLUSION Although less than three years have elapsed since the meltdown, health effects of low-dose exposures from fallout should be analyzed, especially for those in the earliest stages of life. Health status measures after March 2011 such as infant deaths, neonatal deaths, birth defects, stillbirths, low-weight births, premature births, and can- cers in the first year of life can be analyzed. Short-term findings of the young can serve as a warning about po- tential long-term adverse health effects on populations of all ages. REFERENCES [1] Cronkite, E.P., Conard, R.A. and Bond, V.P. (1997) His- torical events associated with fallout from Bravo shot— Operation castle and 25Y of medical findings. Health Physics, 73, 176-186. http://dx.doi.org/10.1097/00004032-199707000-00014 [2] Cronkite, E.P., Bond, V.P. and Conard, R.A. (1995) Medical effects of exposure of human beings to fallout radiation from a thermonuclear explosion. Stem Cells, 13, 49-57. [3] Van Middlesworth, L. (1956) Radioactivity in thyroid glands following nuclear weapons tests. Science, 123, 982-983. http://dx.doi.org/10.1126/science.123.3205.982 [4] Comar, C.L., Trum, B.F., Kuhn, U.S., Wasserman, R.H., Nold, M.M. and Schooley, J.C. (1957) Thyroid radioac- tivity after nuclear weapons tests. Science, 126, 16-18. http://dx.doi.org/10.1126/science.126.3262.16 [5] Beierwaltes, W.H., Cranae, H.R., Wegst, A., Spafford, N.R. and Carr, E.A. (1960) Radioactive iodine concentra- tion in the fetal human thyroid gland from fall-out. JAMA, 173, 1895-1902. http://dx.doi.org/10.1001/jama.1960.03020350013003 [6] Beierwaltes, W.H., Hilger, M.T. and Wegst, A. (1963) Radioactive concentrations in fetal human thyroid from fallout. Health Physics, 9, 1263-1269. http://dx.doi.org/10.1097/00004032-196312000-00030 [7] Williams, D. (1996) Chernobyl and hypothyroidism. Lan- cet, 348, 476. http://dx.doi.org/10.1016/S0140-6736(05)64570-9 [8] McLeod, G. (1982) A role for public health in the nuclear age. American Journal of Public Health, 72, 237-239. http://dx.doi.org/10.2105/AJPH.72.3.237 [9] McLeod, G.K. (1981) Some public health lessons from Three Mile Island: A case study in chaos. Ambio, 1, 18-23. [10] US Environmental Protection Agency (2003) Assessing cancer susceptibility from early-life exposure to carcono- gens. http://cfpub.epa.gov/ncea/cfm/nceapubarchive.cfm [11] Mangano, J.J. (1996) Chernobyl and hypothyroidism. Lancet, 347, 1482-1483. http://dx.doi.org/10.1016/S0140-6736(96)91716-X [12] Mangano, J.J. (2009) Newborn hypothyroidism near the Indian Point nuclear plant. www.radiation.org/reading/pubs/091125/hypothyroid_ind ianpoint.pdf [13] Mangano, J.J. and Sherman, J.D. (2013) Elevated air- borne beta levels in Pacific/West Coast US states and trends in hypothyroidism among newborns after the Fu- kushima nuclear meltdown. Open Journal of Pediatrics, 3, 1-9. http://dx.doi.org/10.4236/ojped.2013.31001 [14] US Bureau of the Census State and County Quick Facts. http:////quickfacts.census.gov/qfd/states/06000.html [15] US Centers for Disease Control and Prevention. Births. http://wonder.cdc.gov/natality.html [16] California Department of Public Health (2013) Genetic disease screening program. [17] Levitssky, L.L. and Straussman, S. (2012) Congenital hypothyroidism—Monitoring thyroid function in infants. European Endocrinology, 8, 53-56. [18] Langham, S., Hindmarsh, P., Krywawych, S. and Peters, C. (2013) Screening for congenital hypothyroidism: Com- parison of borderline screening cut-off points and the ef- fect on the number of children treated with levothyrox- ine. European Thyroid Journal, 2, 180-186. [19] US Environmental Protection Agency. Environmental Radiation Ambient Monitoring System (ERAMS). http://oaspub.epa.gov/enviro/erams_query.simple_query [20] Arey, L.B. (1954) Developmental anatomy. W. B. Saun- ders, Philadelphia, 237-238. [21] Howdeshell, K. (2002) A model of the development of the brain as a construct of the thyroid system. Environ- mental Health Perspectives, 110, 337-348.  J. Mangano et al. / Open Journal of Pediatrics 3 (2013) 370-376 Copyright © 2013 SciRes. OPEN ACCESS 375 http://dx.doi.org/10.1289/ehp.02110s3337 [22] Rosenthal, H.L. (1969) Accumulation of environmental strontium-90 in teeth of children. Proceedings of the Ninth Annual Hanford Biology Symposium at Richland Washington, Washington DC, 5-8 May 1969, US Atomic Energy Commission. [23] Rytomaa, I. (1972) Strontium-90 in deciduous teeth col- lected in northern Finland from children born in 1952- 1964. Acta Onkologica Scandanivia, 30, 219-233. http://dx.doi.org/10.3109/00016357208997461 [24] Aarkrog, A. (1968) Strontium-90 in shed dedicuous teeth collected in Danmark, the Faroes, and Greenland from children born in 1950-1958. Health Physics, 15, 105. http://dx.doi.org/10.1097/00004032-196808000-00001 [25] Kulev, Y.D., Polikarpov, G.G., Prigodey, E.V. and Assi- makopoulos, P.A. (1994) Strontium-90 concentration in human teeth in South Ukraine, 5 years after the Cherno- byl accident. The Science of the Total Environment, 155, 214-219. http://dx.doi.org/10.1016/0048-9697(94)90500-2 [26] Stamoulis, K.C., Assimakopoulos, P.A., Ioanides, K.G., Johnson, E. and Soucacos, P.N. (1999) Strontium-90 concentration measurements in human bones and teeth in Greece. The Science of the Total Environment, 229, 165- 182. http://dx.doi.org/10.1016/S0048-9697(99)00052-2 [27] Mangano, J.J., Gould, J.M., Sternglass, E.J., Sherman, J.D. and McDonnell, W. (2003) An unexpected rise in strontium-90 in US deciduous teeth in the 1990s. The Science of the Total Environment, 317, 37-51. http://dx.doi.org/10.1016/S0048-9697(03)00439-X [28] O’Donnell, R.G., Mitchell, P.L., Priest, N.D., Strange, L., Fox, A., Henshaw, D.L. and Long, S.C. (1997) Variations in the concentration of plutonium, strontium-90, and total alpha-emitters in human teeth collected within the British Isles. The Science of the Total Environment, 20 1 , 235- 243. http://dx.doi.org/10.1016/S0048-9697(97)84060-0 [29] Fukushima Medical University (April 2012 - January 2013) Thyroid screening results: Cysts. http://www.fmu.ac.jp/radiationhealth/results/media/10-2_ ThyroidUE.pdf [30] Matsuda, T., Marugame, T., Kamo, K-I., Katanoda, K., Wakiko, A. and Sobue, T. (2011) Japan Cancer Surveil- lance Research Group. Cancer incidence and incidence rates in Japan 2005: Based on data from 12 popula- tion-based cancer registries in the monitoring of cancer incidence in Japan (MCIJ) project. Japanese Journal of Clinical Oncology, 41, 139-147. http://dx.doi.org/10.1093/jjco/hyq169 [31] Japan Daily Press (2013) Six more young people from Fukushima diagnosed with thyroid cancer. http://japandailypress.com/six-more-young-people-from-f ukushima-diagnosed-with-thyroid-cancer-2134350/ [32] Committee on the Biological Effects of Ionizing Radia- tion, National Research Council (1990) Health effects of exposure to low levels of ionizing radiation (BEIR V). National Academy Press, Washington DC. [33] Committee on the Biological Effects of Radiation, Na- tional Research Council of the National Archives (2005) Health risks from exposure to low levels of ionizing ra- diation (BEIR VII). The National Academies Press, Wash- ington DC. [34] Stewart, A. (1956) Malignant disease in childhood and diagnostic irradiation in utero. Lancet, 2, 447. http://dx.doi.org/10.1016/S0140-6736(56)91923-7 [35] Stewart, A., Webb, J. and Hewitt, D. (1958) A survey of childhood malignancies. BMJ, i, 1495-1508. http://dx.doi.org/10.1136/bmj.1.5086.1495 [36] MacMahon, B. (1962) Prenatal x-ray exposure and child- hood cancer. Journal of the National Cancer Institute, 28, 1173-1192. [37] National Cancer Institute (1997) Estimated exposures and thyroid doses received by the American people from io- dine 131 in fallout following nevada atmospheric nuclear bomb tests: A report from the National Cancer Institute. US Department of Health and Human Services, Bethesda. http://www.cancer.gov/i131/fallout/contents.html [38] Institute of Medicine and National Research Council (1999) Exposure of the American people to iodine-131 from Nevada atomic bomb tests: Review of the National Cancer Institute Report and Public Health Implications., National Academy Press, Washington DC. http://www.nap.edu/openbook.php?isbn=030906175X  J. Mangano et al. / Open Journal of Pediatrics 3 (2013) 370-376 Copyright © 2013 SciRes. OPEN ACCESS 376 Appendix 1. Ratios, March 18 - April 17 vs. other first half year, gross beta concentrations in air filter samples, 2011 vs. 2009-2010-2012 combined, in picocuries per cubic meter, six California sites vs. 22 Non-Western US sites. March 18 - April 17 Avg. Beta, 2011 Avg. Beta, 2009-10-12 vs. Other 1st Half Yr. 2011 vs. Site 3/18 - 4/17 Oth. 1H 3/18 - 4/17 Oth. 1H 2011 2009-10-12 2009-10-12 CALIFORNIA Anaheim 113.5 × 10⁻³ (17) 6.1 × 10⁻³ (27)6.7 × 10⁻³ (19) 9.8 × 10⁻³ (81)18.61 0.68 27.39 Bakersfield 59.1 × 10⁻³ (7) 12.1 × 10⁻³ (39)6.7 × 10⁻³ (22) 9.7 × 10⁻³ (101)4.87 0.69 7.02 Richmond 21.0 × 10⁻³ (6) 5.9 × 10⁻³ (23)4.1 × 10⁻³ (14) 5.6 × 10⁻³ (62)3.57 0.73 4.91 Riverside 43.9 × 10⁻³ (9) 6.3 × 10⁻³ (41)6.4 × 10⁻³ (24) 7.2 × 10⁻³ (122)7.02 0.89 7.93 San Francisco 29.2 × 10⁻³ (9) 3.2 × 10⁻³ (31)3.2 × 10⁻³ (18) 3.7 × 10⁻³ (81)9.16 0.87 10.58 San Jose 22.9 × 10⁻³ (6) 4.9 × 10⁻³ (29)3.8 × 10⁻³ (22) 5.4 × 10⁻³ (100)4.72 0.70 6.74 AVERAGE 48.27 × 10⁻³ (54) 6.40 × 10⁻³ (190)5.12 × 10⁻³ (119) 6.88 × 10⁻³ (547)7.99 0.76 10.53 OTHER US Albany NY 24.2 × 10⁻³ (8) 9.1 × 10⁻³ (41)9.9 × 10⁻³ (26) 9.7 × 10⁻³ (113)2.66 1.02 2.60 Baltimore MD 19.6 × 10⁻³ (9) 8.6 × 10⁻³ (35)9.1 × 10⁻³ (21) 9.9 × 10⁻³ (99)2.27 0.92 2.47 Baton Rouge LA 11.4 × 10⁻³ (8) 6.0 × 10⁻³ (38)6.2 × 10⁻³ (26) 7.1 × 10⁻³ (119)1.90 0.88 2.17 Bismarck ND 13.6 × 10⁻³ (8) 6.9 × 10⁻³ (35)8.2 × 10⁻³ (20) 9.0 × 10⁻³ (98)1.96 0.92 2.14 Charlotte NC 12.7 × 10⁻³ (9) 7.5 × 10⁻³ (38)8.8 × 10⁻³ (21) 8.8 × 10⁻³ (117)1.71 1.00 1.71 Cleveland OH 16.0 × 10⁻³ (8) 7.7 × 10⁻³ (40)10.9 × 10⁻³ (19) 10.4 × 10⁻³ (122)2.08 1.04 1.99 Dallas TX 24.0 × 10⁻³ (9) 8.9 × 10⁻³ (34)8.6 × 10⁻³ (23) 9.3 × 10⁻³ (119)2.71 0.93 2.92 Des Moines IA 41.7 × 10⁻³ (8) 11.3 × 10⁻³ (43)7.9 × 10⁻³ (24) 9.1 × 10⁻³ (87)3.68 0.87 4.92 Detroit MI 21.4 × 10⁻³ (8) 8.0 × 10⁻³ (41)8.1 × 10⁻³ (27) 8.6 × 10⁻³ (120)2.68 0.94 2.68 Dover DE 10.7 × 10⁻³ (7) 6.7 × 10⁻³ (33)6.6 × 10⁻³ (21) 7.8 × 10⁻³ (87)1.59 0.84 1.88 Edison NJ 12.2 × 10⁻³ (9) 5.6 × 10⁻³ (35)5.9 × 10⁻³ (26) 5.8 × 10⁻³ (104)2.21 1.01 2.18 Indianapolis IN 30.8 × 10⁻³ (8) 10.4 × 10⁻³ (43)8.4 × 10⁻³ (27) 9.3 × 10⁻³ (124)2.95 0.91 3.25 Jackson MS* 17.4 × 10⁻³ (9) 9.4 × 10⁻³ (39)8.4 × 10⁻³ (25) 9.5 × 10⁻³ (119)1.85 0.88 2.09 Jacksonville FL 12.5 × 10⁻³ (8) 6.6 × 10⁻³ (33)6.8 × 10⁻³ (25) 6.8 × 10⁻³ (104)1.88 1.00 1.89 Jefferson City MO 21.2 × 10⁻³ (8) 9.1 × 10⁻³ (40)9.0 × 10⁻³ (24) 10.0 × 10⁻³ (116)2.33 0.90 2.61 Lincoln NE 34.3 × 10⁻³ (6) 7.6 × 10⁻³ (34)8.7 × 10⁻³ (24) 9.9 × 10⁻³ (103)4.52 0.89 5.10 Little Rock AR 16.1 × 10⁻³ (8) 10.8 × 10⁻³ (37)8.9 × 10⁻³ (24) 10.3 × 10⁻³ (96)1.49 0.86 1.72 Lynchburg VA 33.7 × 10⁻³ (8) 10.4 × 10⁻³ (42)9.0 × 10⁻³ (27) 10.0 × 10⁻³ (120)3.24 0.90 3.62 Oak Ridge TN* 22.6 × 10⁻³ (8) 10.7 × 10⁻³ (39)10.0 × 10⁻³ (25) 12.3 × 10⁻³ (116)2.12 0.81 2.62 Pierre SD 16.7 × 10⁻³ (9) 8.6 × 10⁻³ (41)8.3 × 10⁻³ (21) 9.7 × 10⁻³ (116)1.95 0.84 2.26 Topeka KS 23.3 × 10⁻³ (8) 11.9 × 10⁻³ (43)10.4 × 10⁻³ (23) 12.1 × 10⁻³ (111)1.96 0.86 2.28 Washington DC 8.7 × 10⁻³ (8) 4.9 × 10⁻³ (40)6.7 × 10⁻³ (27) 6.8 × 10⁻³ (121)1.76 0.97 1.81 AVERAGE 20.21 × 10⁻³ (179) 8.48 × 10⁻³ (844)8.40 × 10⁻³ (526) 9.19 × 10⁻³ (2431)2.34 0.92 2.55 *Jackson Department of Environmental Quality site only; Oak Ridge Y-12W site only; Source: US Environmental Protection Agency. Environmental Radiation Ambient Monitoring System (ERAMS). http://oaspub.epa.gov/enviro/erams_query.simple_query. |