 J. Biomedical Science and Engineering, 2011, 4, 110-118 doi:10.4236/jbise.2011.42016 Published Online February 2011 (http://www.SciRP.org/journal/jbise/ JBiSE ). Published Online February 2011 in SciRes. http://www.scirp.org/journal/JBiSE High resolution nuclear magnetic resonance investigation of metabolic disturbances induced by focal traumatic brain injury in a rat model: a pilot study Laurent Lemaire1,2, François Seguin3,4, Florence Franconi5, Delphine Bon3,4, Anne Pasco1,2, Nadège Boildieu3,4, Jean-Jacques Le Jeune1,2 1LUNAM Université, Ingénierie de la Vectorisation Particulaire, Angers, France; 2INSERM U646, Angers, France; 3Université de Poitiers, Ischémie Reperfusion en Transplantation rénale, Poitiers, France; 4INSERM U927, Poitiers, France; 5LUNAM Université, PIAM, Angers, France Email: laurent.lemaire@univ-angers.fr Received 1 December 2010; revised 3 January 2011; accepted 12 January 2011 ABSTRACT Experimental models of traumatic brain injury (TBI) provide a useful tool for understanding the cerebral metabolic changes induced by this pathological condi- tion. Here, we report on the time course of changes in cerebral metabolites after TBI using high-resolution proton magnetic resonance spectroscopy (NMR). Ex- tracts from adult male Sprague-Dawley rats were sub- jected to fluid lateral percussion and were then exam- ined by NMR at 3, 24 and 48 h after the injury. A me- tabolomic approach was carried out to identify the cerebral metabolites impacted by the TBI and their quantitative temporal changes. Lactate, valine and ascorbate were the three first metabolites to be signifi- cantly modified after TBI. The quantitative elevation for these compounds last for the entire experimental time explored. Within 24 hours post-TBI, a significant elevation in choline-derivates, alanine and glucose were also measur ed. On the other hand, N-acetyl aspartate, a neuronal marker, and myo- inositol, an important or- ganic osmolyte in the mammalian brain, were not sig- nificantly impacted in the chronic phase of TBI. Keywords: TBI; 1H-NMR Spectroscopy; Metabolomic; Traumatic Brain 1. INTRODUCTION Traumatic brain injury (TBI) is a worldwide problem that results in death and disability for millions of people every year. Currently, in industrialized countries it is estimated that TBI is responsible for 0.15-0.2‰ of deaths and that 0.2-0.3‰ of the population lives with permanent disabilities [1-3]. As a result, there is real need for improved diagnosis [4], treatment and strategies for rehabilitation post TBI. Clinical and preclinical studies have now established that brain trauma is a dynamic process characterized by two waves of lesions. The first wave corresponds to the immediate mechanical damage to the central nervous system (CNS) that occurs at the moment of impact, and the second wave, initiated at the moment of the trau- matic insult, will progress over a period of time ranging from hours to days after injury [5-7]. The most common and serious consequence of TBI is then, the development of a brain edema, usually associated with a poor neuro- logical outcome and the activation of multiple molecular pathways to counter-balanced the insult [8-13]. MRS was proven useful to follow those changes; however, the limited spectral resolution associated to the low concen- tration of the brain metabolites limit the studies to few molecules [14]. High resolution NMR allows overcom- ing those drawbacks and may be used to address those metabolic modifications, often complex and implying numerous metabolic pathways [15-18]. Metabolomics has recently emerged as a powerful approach for the characterisation of the metabolic responses to stress or diseases from MS or LC data [19-21] as well as from high resolution NMR data [16,22-26]. In the present work, we took advantage of 1H-NMR potentials in term of easiness of sample preparation, sensitivity, reproduci- bility, high-throuphut analysis without metabolites sepa- ration as well as the quantitative information that one can easily access to, especially using the ERETIC method [27]. Experimental TBI can be performed by numerous 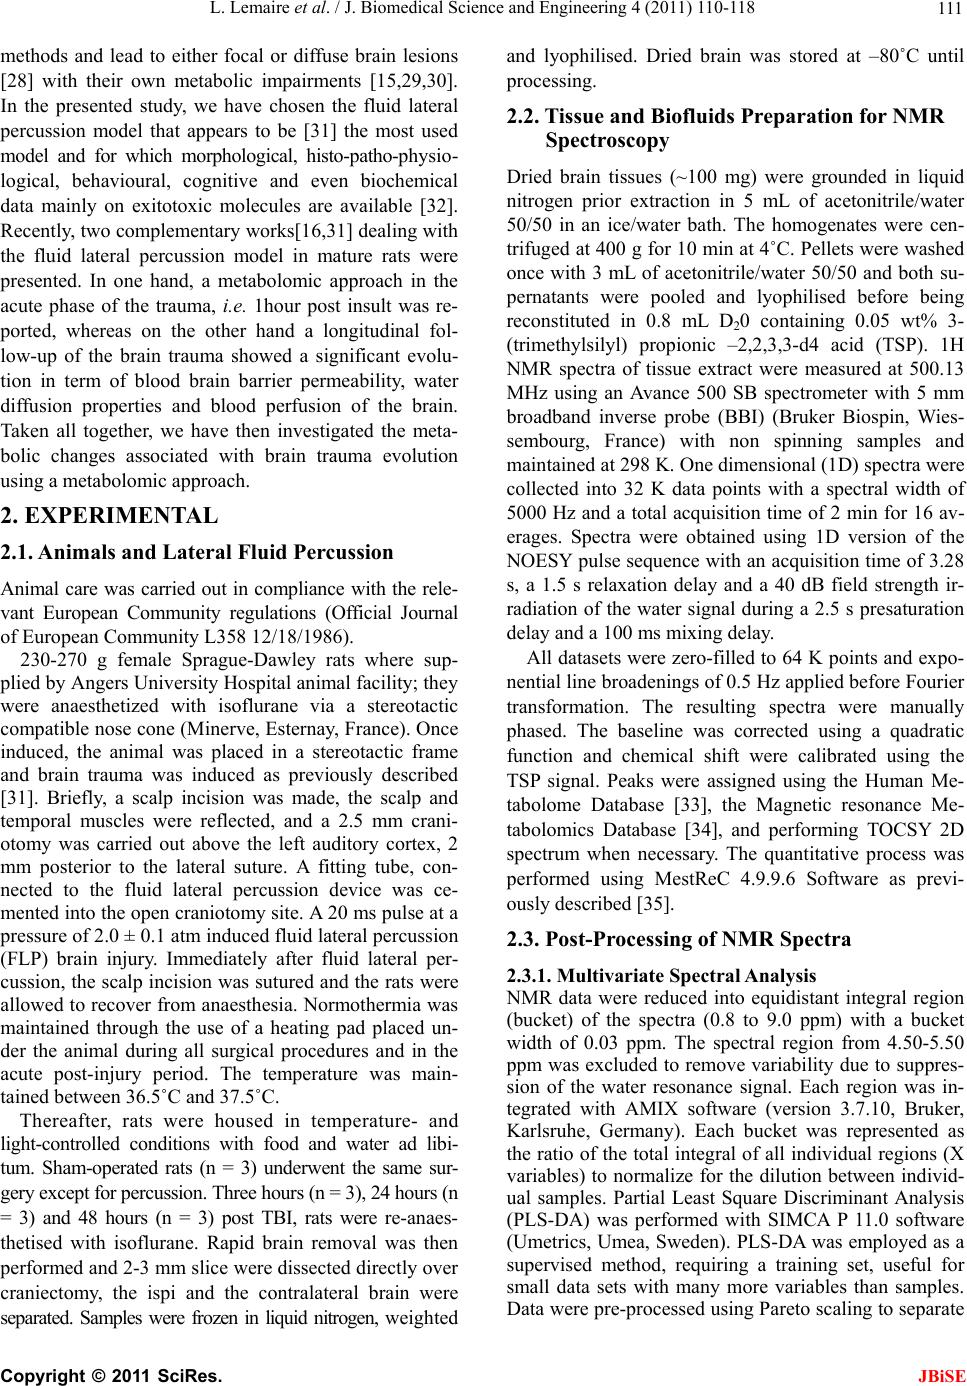 L. Lemaire et al. / J. Biomedical Science and Engineering 4 (2011) 110-118 111 methods and lead to either focal or diffuse brain lesions [28] with their own metabolic impairments [15,29,30]. In the presented study, we have chosen the fluid lateral percussion model that appears to be [31] the most used model and for which morphological, histo-patho-physio- logical, behavioural, cognitive and even biochemical data mainly on exitotoxic molecules are available [32]. Recently, two complementary works[16,31] dealing with the fluid lateral percussion model in mature rats were presented. In one hand, a metabolomic approach in the acute phase of the trauma, i.e. 1hour post insult was re- ported, whereas on the other hand a longitudinal fol- low-up of the brain trauma showed a significant evolu- tion in term of blood brain barrier permeability, water diffusion properties and blood perfusion of the brain. Taken all together, we have then investigated the meta- bolic changes associated with brain trauma evolution using a metabolomic approach. 2. EXPERIMENTAL 2.1. Animals and Lateral Fluid Percussion Animal care was carried out in compliance with the rele- vant European Community regulations (Official Journal of European Community L358 12/18/1986). 230-270 g female Sprague-Dawley rats where sup- plied by Angers University Hospital animal facility; they were anaesthetized with isoflurane via a stereotactic compatible nose cone (Minerve, Esternay, France). Once induced, the animal was placed in a stereotactic frame and brain trauma was induced as previously described [31]. Briefly, a scalp incision was made, the scalp and temporal muscles were reflected, and a 2.5 mm crani- otomy was carried out above the left auditory cortex, 2 mm posterior to the lateral suture. A fitting tube, con- nected to the fluid lateral percussion device was ce- mented into the open craniotomy site. A 20 ms pulse at a pressure of 2.0 ± 0.1 atm induced fluid lateral percussion (FLP) brain injury. Immediately after fluid lateral per- cussion, the scalp incision was sutured and the rats were allowed to recover from anaesthesia. Normothermia was maintained through the use of a heating pad placed un- der the animal during all surgical procedures and in the acute post-injury period. The temperature was main- tained between 36.5˚C and 37.5˚C. Thereafter, rats were housed in temperature- and light-controlled conditions with food and water ad libi- tum. Sham-operated rats (n = 3) underwent the same sur- gery except for percussion. Three hours (n = 3), 24 hours (n = 3) and 48 hours (n = 3) post TBI, rats were re-anaes- thetised with isoflurane. Rapid brain removal was then performed and 2-3 mm slice were dissected directly over craniectomy, the ispi and the contralateral brain were separated. Samples were frozen in liquid nitrogen, weighted and lyophilised. Dried brain was stored at –80˚C until processing. 2.2. Tissue and Biofluids Preparation for NMR Spectroscopy Dried brain tissues (~100 mg) were grounded in liquid nitrogen prior extraction in 5 mL of acetonitrile/water 50/50 in an ice/water bath. The homogenates were cen- trifuged at 400 g for 10 min at 4˚C. Pellets were washed once with 3 mL of acetonitrile/water 50/50 and both su- pernatants were pooled and lyophilised before being reconstituted in 0.8 mL D20 containing 0.05 wt% 3- (trimethylsilyl) propionic –2,2,3,3-d4 acid (TSP). 1H NMR spectra of tissue extract were measured at 500.13 MHz using an Avance 500 SB spectrometer with 5 mm broadband inverse probe (BBI) (Bruker Biospin, Wies- sembourg, France) with non spinning samples and maintained at 298 K. One dimensional (1D) spectra were collected into 32 K data points with a spectral width of 5000 Hz and a total acquisition time of 2 min for 16 av- erages. Spectra were obtained using 1D version of the NOESY pulse sequence with an acquisition time of 3.28 s, a 1.5 s relaxation delay and a 40 dB field strength ir- radiation of the water signal during a 2.5 s presaturation delay and a 100 ms mixing delay. All datasets were zero-filled to 64 K points and expo- nential line broadenings of 0.5 Hz applied before Fourier transformation. The resulting spectra were manually phased. The baseline was corrected using a quadratic function and chemical shift were calibrated using the TSP signal. Peaks were assigned using the Human Me- tabolome Database [33], the Magnetic resonance Me- tabolomics Database [34], and performing TOCSY 2D spectrum when necessary. The quantitative process was performed using MestReC 4.9.9.6 Software as previ- ously described [35]. 2.3. Post-Processing of NMR Spectra 2.3.1. Multiva r iate Spectral Analysis NMR data were reduced into equidistant integral region (bucket) of the spectra (0.8 to 9.0 ppm) with a bucket width of 0.03 ppm. The spectral region from 4.50-5.50 ppm was excluded to remove variability due to suppres- sion of the water resonance signal. Each region was in- tegrated with AMIX software (version 3.7.10, Bruker, Karlsruhe, Germany). Each bucket was represented as the ratio of the total integral of all individual regions (X variables) to normalize for the dilution between individ- ual samples. Partial Least Square Discriminant Analysis (PLS-DA) was performed with SIMCA P 11.0 software (Umetrics, Umea, Sweden). PLS-DA was employed as a supervised method, requiring a training set, useful for small data sets with many more variables than samples. Data were pre-processed using Pareto scaling to separate C opyright © 2011 SciRes. JBiSE 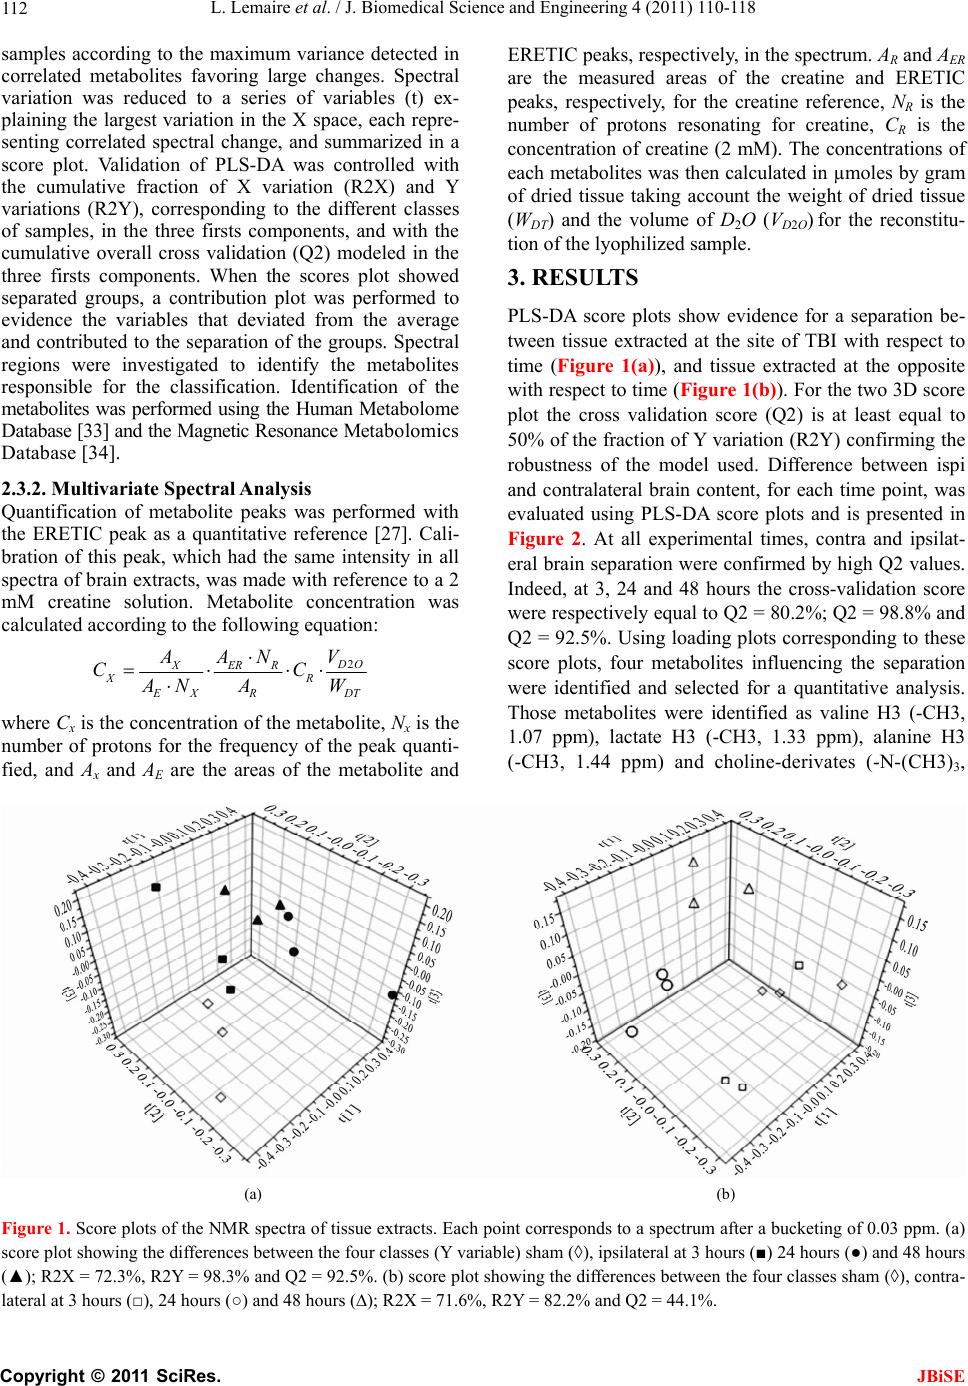 L. Lemaire et al. / J. Biomedical Science and Engineering 4 (2011) 110-118 Copyright © 2011 SciRes. 112 samples according to the maximum variance detected in correlated metabolites favoring large changes. Spectral variation was reduced to a series of variables (t) ex- plaining the largest variation in the X space, each repre- senting correlated spectral change, and summarized in a score plot. Validation of PLS-DA was controlled with the cumulative fraction of X variation (R2X) and Y variations (R2Y), corresponding to the different classes of samples, in the three firsts components, and with the cumulative overall cross validation (Q2) modeled in the three firsts components. When the scores plot showed separated groups, a contribution plot was performed to evidence the variables that deviated from the average and contributed to the separation of the groups. Spectral regions were investigated to identify the metabolites responsible for the classification. Identification of the metabolites was performed using the Human Metabolome Database [33] and the Magnetic Resonance Metabolomics Database [34]. JBiSE 2.3.2. Multiva r i at e Spe ctral Analysis Quantification of metabolite peaks was performed with the ERETIC peak as a quantitative reference [27]. Cali- bration of this peak, which had the same intensity in all spectra of brain extracts, was made with reference to a 2 mM creatine solution. Metabolite concentration was calculated according to the following equation: 2 O XERR XR XR D V AAN CC AN AW T where Cx is the concentration of the metabolite, Nx is the number of protons for the frequency of the peak quanti- fied, and Ax and AE are the areas of the metabolite and ERETIC peaks, respectively, in the spectrum. AR and AER are the measured areas of the creatine and ERETIC peaks, respectively, for the creatine reference, NR is the number of protons resonating for creatine, CR is the concentration of creatine (2 mM). The concentrations of each metabolites was then calculated in µmoles by gram of dried tissue taking account the weight of dried tissue (WDT) and the volume of D2O (VD2O) for the reconstitu- tion of the lyophilized sample. 3. RESULTS PLS-DA score plots show evidence for a separation be- tween tissue extracted at the site of TBI with respect to time (Figure 1(a)), and tissue extracted at the opposite with respect to time (Figure 1(b)). For the two 3D score plot the cross validation score (Q2) is at least equal to 50% of the fraction of Y variation (R2Y) confirming the robustness of the model used. Difference between ispi and contralateral brain content, for each time point, was evaluated using PLS-DA score plots and is presented in Figure 2. At all experimental times, contra and ipsilat- eral brain separation were confirmed by high Q2 values. Indeed, at 3, 24 and 48 hours the cross-validation score were respectively equal to Q2 = 80.2%; Q2 = 98.8% and Q2 = 92.5%. Using loading plots corresponding to these score plots, four metabolites influencing the separation were identified and selected for a quantitative analysis. Those metabolites were identified as valine H3 (-CH3, 1.07 ppm), lactate H3 (-CH3, 1.33 ppm), alanine H3 (-CH3, 1.44 ppm) and choline-derivates (-N-(CH3)3, (a) (b) Figure 1. Score plots of the NMR spectra of tissue extracts. Each point corresponds to a spectrum after a bucketing of 0.03 ppm. (a) score plot showing the differences between the four classes (Y variable) sham (◊), ipsilateral at 3 hours (■) 24 hours (●) and 48 hours (▲); R2X = 72.3%, R2Y = 98.3% and Q2 = 92.5%. (b) score plot showing the differences between the four classes sham (◊), contra- lateral at 3 hours (□), 24 hours (○) and 48 hours (∆); R2X = 71.6%, R2Y = 82.2% and Q2 = 44.1%. 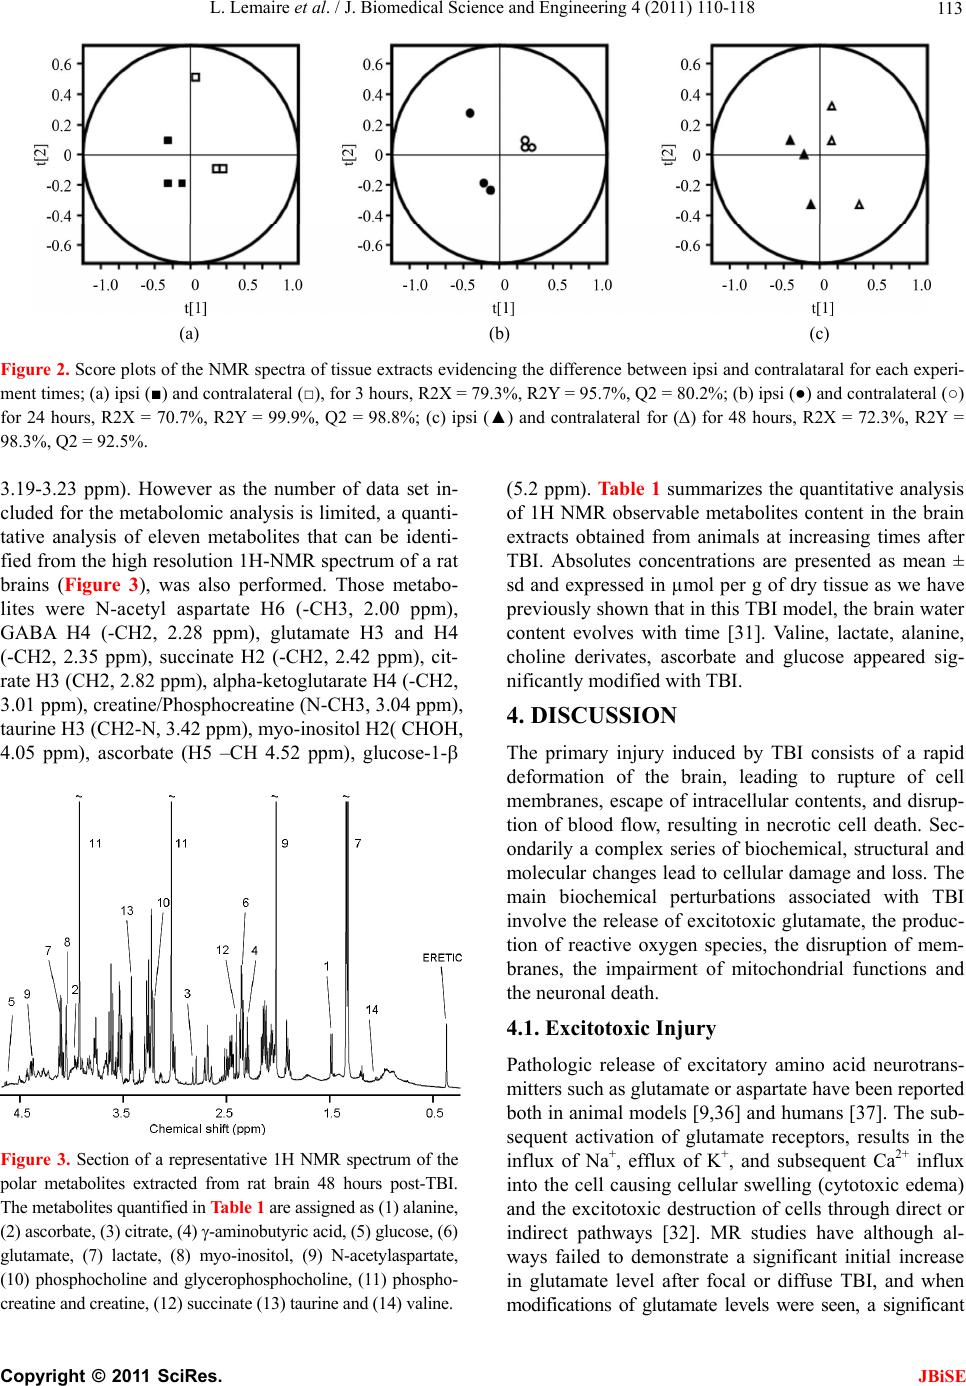 L. Lemaire et al. / J. Biomedical Science and Engineering 4 (2011) 110-118 113 (a) (b) (c) Figure 2. Score plots of the NMR spectra of tissue extracts evidencing the difference between ipsi and contralataral for each experi- ment times; (a) ipsi (■) and contralateral (□), for 3 hours, R2X = 79.3%, R2Y = 95.7%, Q2 = 80.2%; (b) ipsi (●) and contralateral (○) for 24 hours, R2X = 70.7%, R2Y = 99.9%, Q2 = 98.8%; (c) ipsi (▲) and contralateral for (∆) for 48 hours, R2X = 72.3%, R2Y = 98.3%, Q2 = 92.5%. 3.19-3.23 ppm). However as the number of data set in- cluded for the metabolomic analysis is limited, a quanti- tative analysis of eleven metabolites that can be identi- fied from the high resolution 1H-NMR spectrum of a rat brains (Figure 3), was also performed. Those metabo- lites were N-acetyl aspartate H6 (-CH3, 2.00 ppm), GABA H4 (-CH2, 2.28 ppm), glutamate H3 and H4 (-CH2, 2.35 ppm), succinate H2 (-CH2, 2.42 ppm), cit- rate H3 (CH2, 2.82 ppm), alpha-ketoglutarate H4 (-CH2, 3.01 ppm), creatine/Phosphocreatine (N-CH3, 3.04 ppm), taurine H3 (CH2-N, 3.42 ppm), myo-inositol H2( CHOH, 4.05 ppm), ascorbate (H5 –CH 4.52 ppm), glucose-1- Figure 3. Section of a representative 1H NMR spectrum of the polar metabolites extracted from rat brain 48 hours post-TBI. The metabolites quantified in Table 1 are assigned as (1) alanine, (2) ascorbate, (3) citrate, (4) -aminobutyric acid, (5) glucose, (6) glutamate, (7) lactate, (8) myo-inositol, (9) N-acetylaspartate, (10) phosphocholine and glycerophosphocholine, (11) phospho- creatine and creatine, (12) succinate (13) taurine and (14) valine. (5.2 ppm). Table 1 summarizes the quantitative analysis of 1H NMR observable metabolites content in the brain extracts obtained from animals at increasing times after TBI. Absolutes concentrations are presented as mean ± sd and expressed in µmol per g of dry tissue as we have previously shown that in this TBI model, the brain water content evolves with time [31]. Valine, lactate, alanine, choline derivates, ascorbate and glucose appeared sig- nificantly modified with TBI. 4. DISCUSSION The primary injury induced by TBI consists of a rapid deformation of the brain, leading to rupture of cell membranes, escape of intracellular contents, and disrup- tion of blood flow, resulting in necrotic cell death. Sec- ondarily a complex series of biochemical, structural and molecular changes lead to cellular damage and loss. The main biochemical perturbations associated with TBI involve the release of excitotoxic glutamate, the produc- tion of reactive oxygen species, the disruption of mem- branes, the impairment of mitochondrial functions and the neuronal death. 4.1. Excitotoxic Injury Pathologic release of excitatory amino acid neurotrans- mitters such as glutamate or aspartate have been reported both in animal models [9,36] and humans [37]. The sub- sequent activation of glutamate receptors, results in the influx of Na+, efflux of K+, and subsequent Ca2+ influx into the cell causing cellular swelling (cytotoxic edema) and the excitotoxic destruction of cells through direct or indirect pathways [32]. MR studies have although al- ways failed to demonstrate a significant initial increase in glutamate level after focal or diffuse TBI, and when modifications of glutamate levels were seen, a significant C opyright © 2011 SciRes. JBiSE 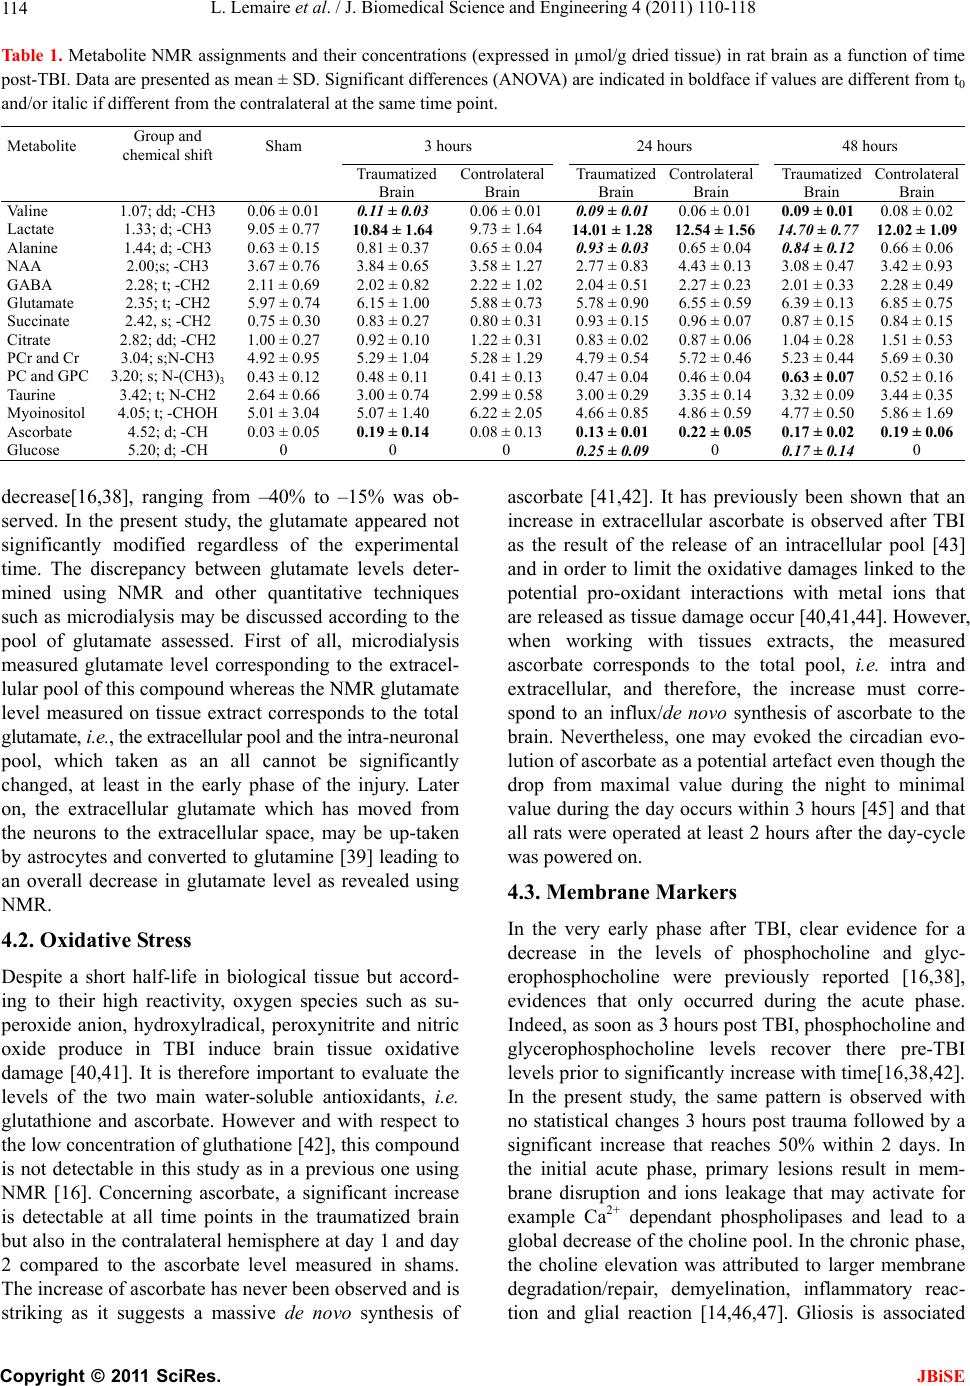 L. Lemaire et al. / J. Biomedical Science and Engineering 4 (2011) 110-118 114 Tabl e 1 . Metabolite NMR assignments and their concentrations (expressed in µmol/g dried tissue) in rat brain as a function of time post-TBI. Data are presented as mean ± SD. Significant differences (ANOVA) are indicated in boldface if values are different from t0 and/or italic if different from the contralateral at the same time point. Metabolite Group and chemical shift Sham 3 hours 24 hours 48 hours Traumatized Brain Controlateral Brain Traumatized Brain Controlateral Brain Traumatized Brain Controlateral Brain Valine 1.07; dd; -CH3 0.06 ± 0.01 0.11 ± 0.03 0.06 ± 0.01 0.09 ± 0.010.06 ± 0.01 0.09 ± 0.01 0.08 ± 0.02 Lactate 1.33; d; -CH3 9.05 ± 0.77 10.84 ± 1. 64 9.73 ± 1.64 14.01 ± 1.2812.54 ± 1.56 14.70 ± 0.77 12.02 ± 1. 09 Alanine 1.44; d; -CH3 0.63 ± 0.15 0.81 ± 0.37 0.65 ± 0.04 0.93 ± 0.030.65 ± 0.04 0.84 ± 0.12 0.66 ± 0.06 NAA 2.00;s; -CH3 3.67 ± 0.76 3.84 ± 0.65 3.58 ± 1.27 2.77 ± 0.834.43 ± 0.13 3.08 ± 0.47 3.42 ± 0.93 GABA 2.28; t; -CH2 2.11 ± 0.69 2.02 ± 0.82 2.22 ± 1.02 2.04 ± 0.512.27 ± 0.23 2.01 ± 0.33 2.28 ± 0.49 Glutamate 2.35; t; -CH2 5.97 ± 0.74 6.15 ± 1.00 5.88 ± 0.73 5.78 ± 0.906.55 ± 0.59 6.39 ± 0.13 6.85 ± 0.75 Succinate 2.42, s; -CH2 0.75 ± 0.30 0.83 ± 0.27 0.80 ± 0.31 0.93 ± 0.150.96 ± 0.07 0.87 ± 0.15 0.84 ± 0.15 Citrate 2.82; dd; -CH2 1.00 ± 0.27 0.92 ± 0.10 1.22 ± 0.31 0.83 ± 0.020.87 ± 0.06 1.04 ± 0.28 1.51 ± 0.53 PCr and Cr 3.04; s;N-CH3 4.92 ± 0.95 5.29 ± 1.04 5.28 ± 1.29 4.79 ± 0.545.72 ± 0.46 5.23 ± 0.44 5.69 ± 0.30 PC and GPC 3.20; s; N-(CH3)3 0.43 ± 0.12 0.48 ± 0.11 0.41 ± 0.13 0.47 ± 0.040.46 ± 0.04 0.63 ± 0.07 0.52 ± 0.16 Taurine 3.42; t; N-CH2 2.64 ± 0.66 3.00 ± 0.74 2.99 ± 0.58 3.00 ± 0.293.35 ± 0.14 3.32 ± 0.09 3.44 ± 0.35 Myoinositol 4.05; t; -CHOH 5.01 ± 3.04 5.07 ± 1.40 6.22 ± 2.05 4.66 ± 0.854.86 ± 0.59 4.77 ± 0.50 5.86 ± 1.69 Ascorbate 4.52; d; -CH 0.03 ± 0.05 0.19 ± 0.14 0.08 ± 0.13 0.13 ± 0.010.22 ± 0.05 0.17 ± 0.02 0.1 9 ± 0 .06 Glucose 5.20; d; -CH 0 0 0 0.25 ± 0.090 0.17 ± 0.14 0 decrease[16,38], ranging from –40% to –15% was ob- served. In the present study, the glutamate appeared not significantly modified regardless of the experimental time. The discrepancy between glutamate levels deter- mined using NMR and other quantitative techniques such as microdialysis may be discussed according to the pool of glutamate assessed. First of all, microdialysis measured glutamate level corresponding to the extracel- lular pool of this compound whereas the NMR glutamate level measured on tissue extract corresponds to the total glutamate, i.e., the extracellular pool and the intra-neuronal pool, which taken as an all cannot be significantly changed, at least in the early phase of the injury. Later on, the extracellular glutamate which has moved from the neurons to the extracellular space, may be up-taken by astrocytes and converted to glutamine [39] leading to an overall decrease in glutamate level as revealed using NMR. 4.2. Oxidative Stress Despite a short half-life in biological tissue but accord- ing to their high reactivity, oxygen species such as su- peroxide anion, hydroxylradical, peroxynitrite and nitric oxide produce in TBI induce brain tissue oxidative damage [40,41]. It is therefore important to evaluate the levels of the two main water-soluble antioxidants, i.e. glutathione and ascorbate. However and with respect to the low concentration of gluthatione [42], this compound is not detectable in this study as in a previous one using NMR [16]. Concerning ascorbate, a significant increase is detectable at all time points in the traumatized brain but also in the contralateral hemisphere at day 1 and day 2 compared to the ascorbate level measured in shams. The increase of ascorbate has never been observed and is striking as it suggests a massive de novo synthesis of ascorbate [41,42]. It has previously been shown that an increase in extracellular ascorbate is observed after TBI as the result of the release of an intracellular pool [43] and in order to limit the oxidative damages linked to the potential pro-oxidant interactions with metal ions that are released as tissue damage occur [40,41,44]. However, when working with tissues extracts, the measured ascorbate corresponds to the total pool, i.e. intra and extracellular, and therefore, the increase must corre- spond to an influx/de novo synthesis of ascorbate to the brain. Nevertheless, one may evoked the circadian evo- lution of ascorbate as a potential artefact even though the drop from maximal value during the night to minimal value during the day occurs within 3 hours [45] and that all rats were operated at least 2 hours after the day-cycle was powered on. 4.3. Membrane Markers In the very early phase after TBI, clear evidence for a decrease in the levels of phosphocholine and glyc- erophosphocholine were previously reported [16,38], evidences that only occurred during the acute phase. Indeed, as soon as 3 hours post TBI, phosphocholine and glycerophosphocholine levels recover there pre-TBI levels prior to significantly increase with time[16,38,42]. In the present study, the same pattern is observed with no statistical changes 3 hours post trauma followed by a significant increase that reaches 50% within 2 days. In the initial acute phase, primary lesions result in mem- brane disruption and ions leakage that may activate for example Ca2+ dependant phospholipases and lead to a global decrease of the choline pool. In the chronic phase, the choline elevation was attributed to larger membrane degradation/repair, demyelination, inflammatory reac- tion and glial reaction [14,46,47]. Gliosis is associated C opyright © 2011 SciRes. JBiSE  L. Lemaire et al. / J. Biomedical Science and Engineering 4 (2011) 110-118 115 with elevation in inositol level and is therefore observed in the late phase post TBI [14,48] even though astrocytes damage are reported as early as 30 min post FLP in- duced TBI [49].In our experiment, variation were lim- ited in magnitude (ca.10%) and never significant. 4.4. Neuronal Damage The most prominent peak of the normal high resolution 1H-NMR spectra is that of NAA. This compound is known since long to be located within neurons and is therefore traditionally used as marker of neuronal integ- rity [50]. In the acute phase, NAA remained unchanged in the ispsi lateral brain but, even though not significant, decreased later on by about 20%. In previous studies, NAA was reported reduced as early as 1 hour post TBI [14,16] ( range –15; –60%) and associated with neuronal injury [14]. Differences in magnitude and dynamic of NAA change may reflect the milder traumatic model used in the present study. Even though extracellular NAA is transported into astrocytes [51] to be rapidly hydrolyzed into acetate and aspartate [52], none of these catabolites were changed after TBI. 4.5. Energy Metabolism and Lactate FLP induced TBI was demonstrated to induced a tran- sient but significant 50% reduction in cerebral blood flow (CBF) within the ipsilateral brain, and a chronic reduction of up to 80% in contralateral hemisphere [31]. Despite the CBF reduction in the contralateral brain, and apart from lactate and ascorbate, none of the measured metabolites were significantly impaired, suggesting that the transient hypoperfusion was not deleterious for the brain. However, in the traumatized brain, the mechanical insult associated with the hypoperfusion induces pertur- bation in the energy metabolism. Very prominent is the marked and constantly increased characteristic doublet around 1.32 ppm, corresponding to lactate. Different sources for lactate after trauma are known. Initially, a continuous production of lactate via glycolisis might occur. Indeed, the increased energy demand to re-estab- lish ionic homeostasis leads to increased glucose utiliza- tion, resulting in an increase in lactate [53]. Moreover, lactate may also arise from astrocytes metabolism through the astrocyte-neuron lactate shuttle or a Ca2+ mediated mitochondrial dysfunction with impaired ATP produc- tion of the respiratory chain was reported in TBI [14,54]. Even though possible, the contribution of infiltrated in- flammatory cells or of necrotic contusion core, to lactate production may be marginal as neither are massively present in this TBI model [31]. Finally, as the time be- tween TBI and the NMR analysis increase, free glucose is detected in the traumatized cortex as previously shown using 13C-labeled glucose [29]. 4.6. GABA and Other Biomarkers GABAergic neurotransmission has been extensively studied following TBI [55,56] and extracellular level of GABA following cortical TBI contusion in rats were proven either increased or stable [9,16,17,57]. For ex- ample, in a recent study where metabolites levels were followed with a high temporal resolution, a 25-fold in- crease in protective GABA was measured 15 min post TBI, to recover a pre-TBI within 45-60 min [9]. In the present study, GABA level was not significantly modi- fied at the time points studied. On the other hand, and as previously reported, levels of numerous amino-acid are affected in focal or diffuse brain trauma [16,17]. In this longitudinal study, levels of valine and alanine were sig- nificantly increased with time. 4.7. Conclusions Numerous studies have looked at metabolite profiles following TBI and complementary or opposite data are available. Two main points have to be highlighted once dealing with TBI. On one hand, the type of TBI, i.e. dif- fuse or focal and on the other hand the timing between TBI and analysis. In the first half-hour post-TBI, irre- spective of the model, major changes occur such as hemodynamic drop [31,58], Blood Brain Barrier per- meation [59] and metabolic perturbations [9,16]. For the latest, a substantial increase in metabolites is usually observed corresponding probably to the leakage from the intracellular space leading to the aggravation of the ini- tial lesion. 5. ACKNOWLEDGEMENTS The authors would like to thank l’Association les Gueules Cassées for their financial support and P. LEGRAS and J. ROUX from the Hospital & University Animal Facility (SCAHU) for the care and housing of the animals. REFERENCES [1] Thurman, D., Alverson, C., Dunn, K., Guerrero, J. (1999) Traumatic brain injury in the United States: A public health perspective. Journal of Head Trauma Rehabilita- tion, 14, 602-615. doi:10.1097/00001199-199912000-00009 [2] Kay, A. and Teasdale, G. (2001) Head injury in the United Kingdom. World Journal of Surgery, 25, 1210- 1220. doi:10.1007/s00268-001-0084-6 [3] Mathe, J., Richard, I. and Rome, J. (2005) Serious brain injury and public health, epidemiologic and financial considerations, comprehensive management and care. Ann Fr Anesth Reanim, 24, 688-694. [4] Theodoraki, E.M., Katsaragakis, S., Koukouvinos, C. and Parpoula, C. (2010) Innovative data mining approaches for outcome prediction of trauma patients. Journal of C opyright © 2011 SciRes. JBiSE  L. Lemaire et al. / J. Biomedical Science and Engineering 4 (2011) 110-118 116 Biomedical Science and Engineering, 3, 791-798. doi:10.4236/jbise.2010.38105 [5] Sahuquillo, J., Poca, M.A. and Amoros, S. (2001) Cur- rent aspects of pathophysiology and cell dysfunction af- ter severe head injury. Current Pharmaceutical Design, 7, 1475-1503. doi:10.2174/1381612013397311 [6] Graham, D.I., Adams, J.H. and Doyle, D (1978) Ischae- mic brain damage in fatal non-missile head injuries. Journal of the Neurological Sciences, 39, 213-234. [7] Pasco, A., Ter Minassian, A., Chapon, C., Lemaire, L., Franconi, F., Darabi, D., Caron, C., Benoit, J.P. and Le Jeune, J.J. (2006) Dynamics of cerebral edema and the apparent diffusion coefficient of water changes in pa- tients with severe traumatic brain injury. A prospective MRI study. European Radiology, 16, 1501-1508. [8] Ueda, T., Iwata, A., Komatsu, H., Aihara, N., Yamada, K., Ugawa, S. and Shimada, S. (2001) Diffuse brain injury induces local expression of Na+/myo-inositol cotrans- porter in the rat brain. Molecular Brain Research, 86, 63-69. doi:10.1016/S0169-328X(00)00261-8 [9] Zhong, C., Zhao, X., Van, K.C., Bzdega, T., Smyth, A., Zhou, J., Kozikowski, A.P., Jiang, O'Connor, W.T., Ber- man, R.F., Neale, J.H. and Lyeth, B.G. (2006) NAAG peptidase inhibitor increases dialysate NAAG and re- duces glutamate, aspartate and GABA levels in the dorsal hippocampus following fluid percussion injury in the rat. Journal of Neurochemistry, 97, 1015-1025. [10] Zhou, Z., Daugherty, W.P., Sun, D., Levasseur, J.E., Al- tememi, N., Hamm, R.J., Rockswold, G.L. and Bullock, M.R. (2007) Protection of mitochondrial function and improvement in cognitive recovery in rats treated with hyperbaric oxygen following lateral fluid-percussion in- jury. Journal of Neurosurgery, 106, 687-694. [11] Martinez-Murillo, R., Fernandez, A.P., Serrano, J., Rod- rigo, J., Salas, E., Mourelle, M. and Martinez, A. (2007) The nitric oxide donor LA 419 decreases brain damage in a focal ischemia model. Neuroscience Letters, 415, 149- 153. doi:10.1016/j.neulet.2007.01.011 [12] Chapon, C., Franconi, F., Lacoeuille, F., Hindré, F., Saul- nier, P., Benoit, J.-P., Le Jeune, J.-J. and Lemaire, L. (2009) Imaging E-selectin expression following trau- matic brain injury in the rat using a targeted USPIO con- trast agent. Magnetic Resonance Materials in Physics, Biology and Medicine, 22, 167-174. [13] Bellander, B.M., Lidman, O., Ohlsson, M., Meijer, B., Piehl, F. and Svensson, M. (2010) Genetic regulation of microglia activation, complement expression, and neu- rodegeneration in a rat model of traumatic brain injury. Experimental Brain Research, 205, 103-114. [14] Schuhmann, M.U., Stiller, D., Skardelly, M., Bernarding, J., Klinge, P.M., Samii, A., Samii, M. and Brinker, T. (2003) Metabolic changes in the vicinity of brain contu- sions: A proton magnetic resonance spectroscopy and histology study. Journal of Neurotrauma, 20, 725-743. doi:10.1089/089771503767869962 [15] Bartnik, B.L., Sutton, R.L., Fukushima, M., Harris, N.G., Hovda, D.A. and Lee, S.M. (2005) Upregulation of pen- tose phosphate pathway and preservation of tricarboxylic acid cycle flux after experimental brain injury. Journal of Neurotrauma, 22, 1052-1065. [16] Viant, M.R., Lyeth, B.G., Miller, M.G. and Berman, R.F. (2005) An NMR metabolomic investigation of early metabolic disturbances following traumatic brain injury in a mammalian model. NMR Biomed, 18, 507-516. doi:10.1002/nbm.980 [17] Pascual, J.M., Solivera, J., Prieto, R., Barrios, L., Lo- pez-Larrubia, P., Cerdan, S. and Roda, J.M. (2007) Time course of early metabolic changes following diffuse traumatic brain injury in rats as detected by H NMR spectroscopy. Journal of Neurotrauma, 24, 944-959. [18] Casey, P.A., McKenna, M.C., Fiskum, G., Saraswati, M. and Robertson, C.L. (2008) Early and sustained altera- tions in cerebral metabolism after traumatic brain injury in immature rats. Journal of Neurotrauma, 25, 603-614. doi:10.1089/neu.2007.0481 [19] Catchpole, G.S., Beckmann, M., Enot, D.P., Mondhe, M., Zywicki, B., Taylor, J., Hardy, N., Smith, A., King, R.D., Kell, D.B., Fiehn, O. and Draper, J. (2005) Hierarchical metabolomics demonstrates substantial compositional similarity between genetically modified and conventional potato crops. Proceedings of the National Academy of Sciences, 102, 14458-14462. [20] Soga, T. (2007) Capillary electrophoresis-mass spec- trometry for metabolomics. Methods in Molecular Biol- ogy, 358, 129-137. doi:10.1007/978-1-59745-244-1_8 [21] Dettmer, K., Aronov, P.A. and Hammock, B.D. (2007) Mass spectrometry-based metabolomics. Mass Spec- trometry Reviews, 26, 51-78. [22] Brindle, J.T., Antti, H., Holmes, E., Tranter, G., Nichol- son, J.K., Bethell, H.W., Clarke, S., Schofield, P.M., McKilligin, E., Mosedale, D.E. and Grainger, D.J. (2002) Rapid and noninvasive diagnosis of the presence and se- verity of coronary heart disease using 1H-NMR-based metabonomics. Nature Medicine, 8, 1439-1444. [23] Griffiths, J.R. and Stubbs, M. (2003) Opportunities for studying cancer by metabolomics: preliminary observa- tions on tumors deficient in hypoxia-inducible factor 1. Advances in Enzyme Regulation, 43, 67-76. [24] Morvan, D. and Demidem, A. (2007) Metabolomics by proton nuclear magnetic resonance spectroscopy of the response to chloroethylnitrosourea reveals drug efficacy and tumor adaptive metabolic pathways. Cancer Re- search, 67, 2150-2159. doi:10.1158/0008-5472.CAN-06-2346 [25] Viant, M.R. (2007) Revealing the metabolome of animal tissues using 1H nuclear magnetic resonance spectros- copy. Methods in Molecular Biology, 358, 229-246. [26] Barba, I., Jaimez-Auguets, E., Rodriguez-Sinovas, A. and Garcia-Dorado, D. (2007) 1H NMR-based metabolomic identification of at-risk areas after myocardial infarction in swine. Magnetic Resonance Materials in Physics, Bi- ology and Medicine, 20, 265-271. doi:10.1007/s10334-007-0097-8 [27] Silvestre, V., Goupry, S., Trierweiler, M., Robins, R. and Akoka, S. (2001) Determination of substrate and product concentrations in lactic acid bacterial fermentations by proton NMR using the ERETIC method. Analytical Chemistry, 73, 1862-1868. [28] Morales, D.M., Marklund, N., Lebold, D., Thompson, H.J., Pitkanen, A., Maxwell, W.L., Longhi, L., Laurer, H., Maegele, M., Neugebauer, E., Graham, D.I., Stocchetti, N., McIntosh, T.K. (2005) Experimental models of trau- matic brain injury: do we really need to build a better mousetrap? Neuroscience, 136, 971-989. C opyright © 2011 SciRes. JBiSE  L. Lemaire et al. / J. Biomedical Science and Engineering 4 (2011) 110-118 117 [29] Bartnik, B.L., Lee, S.M., Hovda, D.A. and Sutton, R.L. (2007) The fate of glucose during the period of decreased metabolism after fluid percussion injury: A 13C NMR study. Journal of Neurotrauma, 24, 1079-1092. [30] Bartnik, B.L., Hovda, D.A. and Lee, P.W. (2007) Glucose metabolism after traumatic brain injury: Estimation of pyruvate carboxylase and pyruvate dehydrogenase flux by mass isotopomer analysis. Journal of Neurotrauma, 24, 181-194. doi:10.1089/neu.2006.0038 [31] Pasco, A., Lemaire, L., Franconi, F., Lefur, Y., Noury, F., Saint-Andre, J.P., Benoit, J.P., Cozzone, P.J. and Le Jeune, J.J. (2007) Perfusional deficit and the dynamics of cere- bral edemas in experimental traumatic brain injury using perfusion and diffusion-weighted magnetic resonance imaging. Journal of Neurotrauma, 24, 1321-1330. [32] Thompson, H.J., Lifshitz, J., Marklund, N., Grady, M.S., Graham, D.I., Hovda, D.A. and McIntosh, T.K. (2005) Lateral fluid percussion brain injury: A 15-year review and evaluation. Journal of Neurotrauma, 22, 42-75. [33] Wishart, D.S., Knox, C., Guo, A.C., Eisner, R., Young, N., Gautam, B., Hau, D.D., Psychogios, N., Dong, E., Bouatra, S., Mandal, R., Sinelnikov, I., Xia, J., Jia, L., Cruz, J.A., Lim, E., Sobsey, C.A., Shrivastava, S., Huang, P., Liu, P., Fang, L., Peng, J., Fradette, R., Cheng, D., Tzur, D., Clements, M., Lewis, A., De Souza, A., Zuniga, A., Dawe, M., Xiong, Y., Clive, D., Greiner, R., Nazy- rova, A., Shaykhutdinov, R., Li, L., Vogel, H.J. and Forsythe, I. (2009) HMDB: A knowledgebase for the human metabolome. Nucleic Acids Research, 37, 603- 610. doi:10.1093/nar/gkn810 [34] Lundberg, P., Vogel, T., Malusek, A., Lundquist, P.-O. and Cohen, L. (2005) MDL—The Magnetic Resonance Metabolomics Database (mdl.imv.liu.se). 22th Annual Meeting of the European Society for Magnetic Resonance in Medicine and Biology, Magnetic Resonance Materials in Physics, Biology and Medicine, 18, Basel, S168-S169. [35] Simoes, R.V., Martinez-Aranda, A., Martin, B., Cerdan, S., Sierra, A. and Arus, C. (2008) Preliminary charac- terization of an experimental breast cancer cells brain metastasis mouse model by MRI/MRS. Magnetic Reso- nance Materials in Physics, Biology and Medicine, 21, 237-249. [36] Sakowitz, O.W., Unterberg, A.W. and Stover, J.F. (2002) Neuronal activity determined by quantitative EEG and cortical microdialysis is increased following controlled cortical impact injury in rats. Acta Neurochirurgica Sup- plementum, 81, 221-223. [37] Hlatky, R., Furuya, Y., Valadka, A.B., Goodman, J.C. and Robertson, C.S. (2002) Comparison of microdialysate arginine and glutamate levels in severely head-injured patient. Acta Neurochirurgica Supplementum, 81, 347- 349. [38] Schuhmann, M.U., Stiller, D., Skardelly, M., Thomas, S., Samii, M. and Brinker, T. (2002) Long-time in-vivo metabolic monitoring following experimental brain con- tusion using proton magnetic resonance spectroscopy. Acta Neurochirurgica Supplementum, 81, 209-212. [39] Takahashi, M., Billups, B., Rossi, D., Sarantis, M., Ha- mann, M. and Attwell, D. (1997) The role of glutamate transporters in glutamate homeostasis in the brain. Jour- nal of Experimental Biology, 200, 401-409. [40] Lewen, A., Matz, P. and Chan, P.H. (2000) Free radical pathways in CNS injury. Journal of Neurotrauma, 17, 871-890. doi:10.1089/neu.2000.17.871 [41] Tyurin, V.A., Tyurina, Y.Y., Borisenko, G.G., Sokolova, T.V., Ritov, V.B., Quinn, P.J., Rose, M., Kochanek, P., Graham, S.H. and Kagan, V.E. (2000) Oxidative stress following traumatic brain injury in rats: Quantitation of biomarkers and detection of free radical intermediates. Journal of Neurochemistry, 75, 2178-2189. [42] Bayir, H., Tyurin, V.A., Tyurina, Y.Y., Viner, R., Ritov, V., Amoscato, A.A., Zhao, Q., Zhang, X.J., Janesko-Feldman, K.L., Alexander, H., Basova, L.V., Clark, R.S., Kochanek, P.M. and Kagan, V.E. (2007) Selective early cardiolipin peroxidation after traumatic brain injury: an oxidative lipidomics analysis. Annals of Neurology, 62, 154-169. [43] Hillered, L., Nilsson, P., Ungerstedt, U. and Ponten, U. (1990) Trauma-induced increase of extracellular ascor- bate in rat cerebral cortex. Neuroscience Letters, 113, 328-332. doi:10.1016/0304-3940(90)90606-A [44] Liebler, D.C., Kling, D.S. and Reed, D.J. (1986) Anti- oxidant protection of phospholipid bilayers by alpha- tocopherol. Control of alpha-tocopherol status and lipid peroxidation by ascorbic acid and glutathione. The Jour- nal of Biological Chemistry, 261, 12114-12119. [45] Fillenz, M. and O'Neill, R.D. (1986) Effects of light re- versal on the circadian pattern of motor activity and voltammetric signals recorded in rat forebrain. Journal of Physiology, 374, 91-101. [46] Ross, B.D., Ernst, T., Kreis, R., Haseler, L.J., Bayer, S., Danielsen, E., Bluml, S., Shonk, T., Mandigo, J.C., Caton, W., Clark, C., Jensen, S.W., Lehman, N.L., Arcinue, E., Pudenz, R. and Shelden, C.H. (1998) 1H MRS in acute traumatic brain injury. Journal of Magnetic Resonance Imaging, 8, 829-840. doi:10.1002/jmri.1880080412 [47] Cecil, K.M., Lenkinski, R.E., Meaney, D.F., McIntosh, T.K. and Smith, D.H. (1998) High-field proton magnetic resonance spectroscopy of a swine model for axonal in- jury. Journal of Neurochemistry, 70, 2038-2044. [48] Fortuna, S., Pestalozza, S., Lorenzini, P., Bisso, G.M., Morelli, L. and Michalek, H. (1997) Transient global brain hypoxia-ischemia in adult rats: Neuronal damage, glial proliferation, and alterations in inositol phosphol- ipid hydrolysis. Neurochemistry International, 31, 563- 569. doi:10.1016/S0197-0186(97)00005-3 [49] Zhao, X., Ahram, A., Berman, R.F., Muizelaar, J.P. and Lyeth, B.G. (2003) Early loss of astrocytes after experi- mental traumatic brain injury. Glia, 44, 140-152. [50] Ross, B. and Michaelis, T. (1994) Clinical applications of magnetic resonance spectroscopy. Magn Reson Q, 10, 191-247. [51] Huang, W., Wang, H., Kekuda, R., Fei, Y.J., Friedrich, A., Wang, J., Conway, S.J., Cameron, R.S., Leibach, F.H. and Ganapathy, V. (2000) Transport of N-acetylaspartate by the Na(+)-dependent high-affinity dicarboxylate trans- porter NaDC3 and its relevance to the expression of the transporter in the brain. Journal of Pharmacol Exp Ther, 295, 392-403. [52] Tsai, G., van Kammen, D.P., Chen, S., Kelley, M.E., Grier, A. and Coyle, J.T. (1998) Glutamatergic neuro- transmission involves structural and clinical deficits of schizophrenia. Biol Psychiatr y, 44, 667-674. doi:10.1016/S0006-3223(98)00151-6 [53] Kawamata, T., Katayama, Y., Hovda, D.A., Yoshino, A. C opyright © 2011 SciRes. JBiSE  L. Lemaire et al. / J. Biomedical Science and Engineering 4 (2011) 110-118 Copyright © 2011 SciRes. 118 JBiSE and Becker, D.P. (1992) Administration of excitatory amino acid antagonists via microdialysis attenuates the increase in glucose utilization seen following concussive brain injury. Cerebral Blood Flow & Metabolism, 12, 12-24. [54] Xiong, Y., Peterson, P.L., Muizelaar, J.P. and Lee, C.P. (1997) Amelioration of mitochondrial function by a novel antioxidant U-101033E following traumatic brain injury in rats. Journal of Neurotrauma, 14, 907-917. [55] Imaizumi, M., Kim, H.J., Zoghbi, S.S., Briard, E., Hong, J., Musachio, J.L., Ruetzler, C., Chuang, D.M., Pike, V.W., Innis, R.B. and Fujita, M. (2007) PET imaging with [11C] PBR28 can localize and quantify upregulated peripheral benzodiazepine receptors associated with cere- bral ischemia in rat. Neuroscience Letters, 411, 200-205. doi:10.1016/j.neulet.2006.09.093 [56] Grossman, R., Shohami, E., Alexandrovich, A., Yatsiv, I., Kloog, Y. and Biegon, A. (2003) Increase in peripheral benzodiazepine receptors and loss of glutamate NMDA receptors in a mouse model of closed head injury: A quantitative autoradiographic study. Neuroimage, 20, 1971-1981. doi:10.1016/j.neuroimage.2003.06.003 [57] Nilsson, P., Hillered, L., Ponten, U. and Ungerstedt, U. (1990) Changes in cortical extracellular levels of en- ergy-related metabolites and amino acids following con- cussive brain injury in rats. Journal of Cereb Blood Flow Metab, 10, 631-637. [58] Assaf, Y., Holokovsky, A., Berman, E., Shapira, Y., Sho- hami, E. and Cohen, Y. (1999) Diffusion and perfusion magnetic resonance imaging following closed head in- jury in rats. Journal of Neurotrauma, 16, 1165-1176. doi:10.1089/neu.1999.16.1165 [59] Beaumont, A., Marmarou, A., Hayasaki, K., Barzo, P., Fatouros, P., Corwin, F., Marmarou, C. and Dunbar, J. (2000) The permissive nature of blood brain barrier (BBB) opening in edema formation following traumatic brain injury. Journal of Experimental Biology, 76, 125- 129.
|