M. OHMI ET AL.
26
Time integrated value of the
reflection light intensity(×106)
A1 A2 A3 A4 B1 B2 B3 C1 C2 C3 C4C5 D1 D2D3 D4
0
First
Second
0.3
0.6
0.9
1.2
1.5
A1, A2, A3, A4
B1, B 2 , B3
C1, C2, C3, C4, C5
D1, D2, D3, D4
Sweat gland
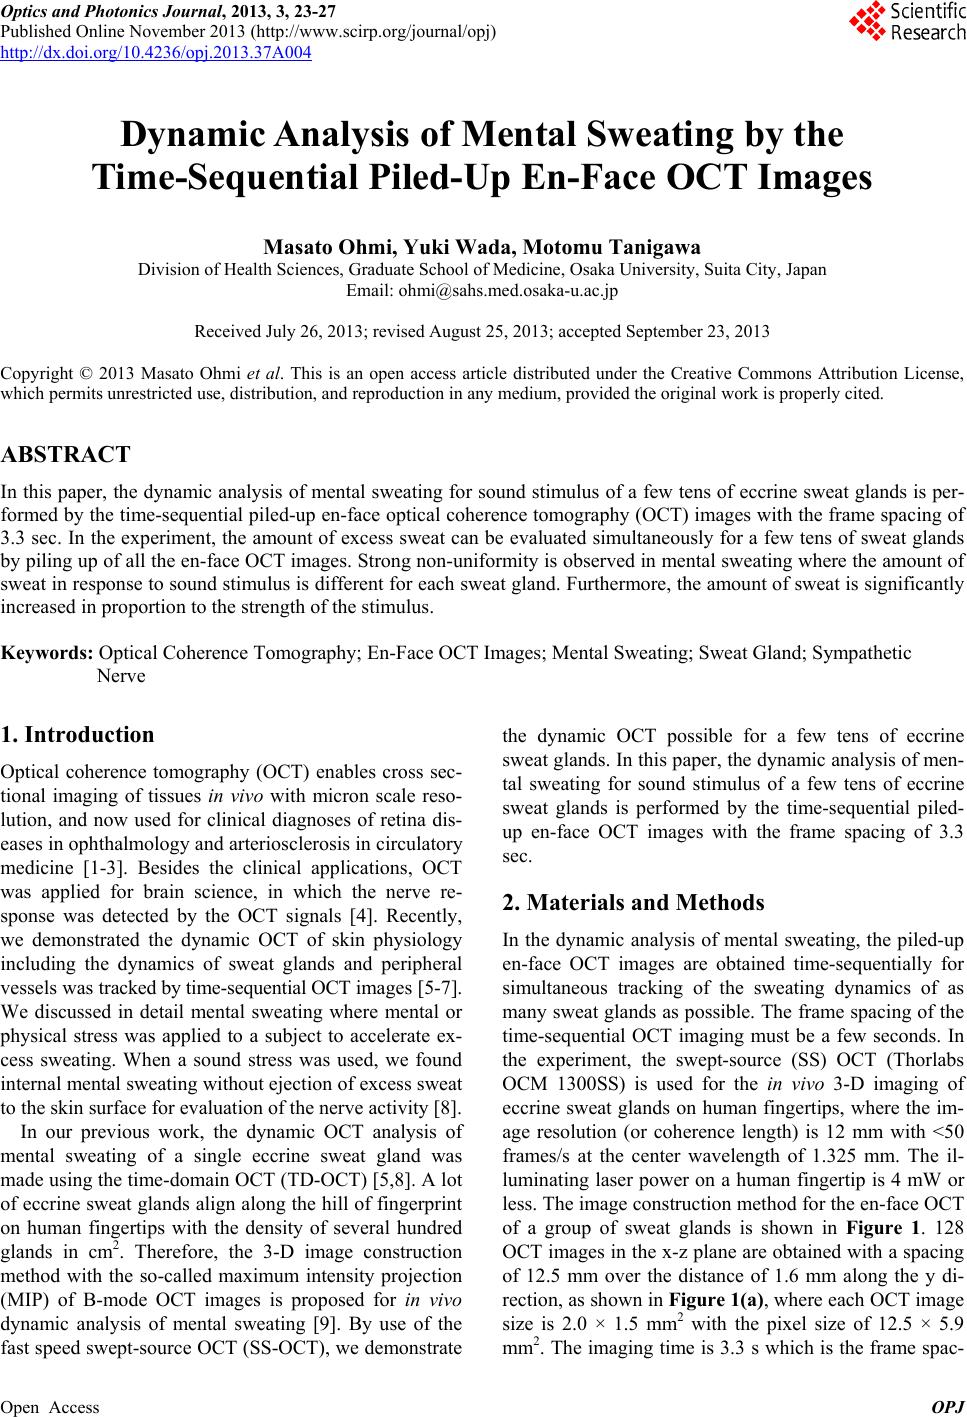
Figure 6. Time integrated values of amount of sweat stimu-
lated by application of the sound stimulus of first and sec-
ond times.
3.0
2.0
1.0
0
3.0
2.0
1.0
0
100 200 300
Tim e ( s)
100 200 300
A2 B2
Stimulus
Stimulus
90dB
60dB
Time (s)
3.0
2.0
1.0
0100200 300
C2
Stimulus
Time (s)
3.0
2.0
1.0
0100 200 300
D2
Stimulus
104)
X10
Ti me ( s)
Signal intensity (X
Signal intensity (4)
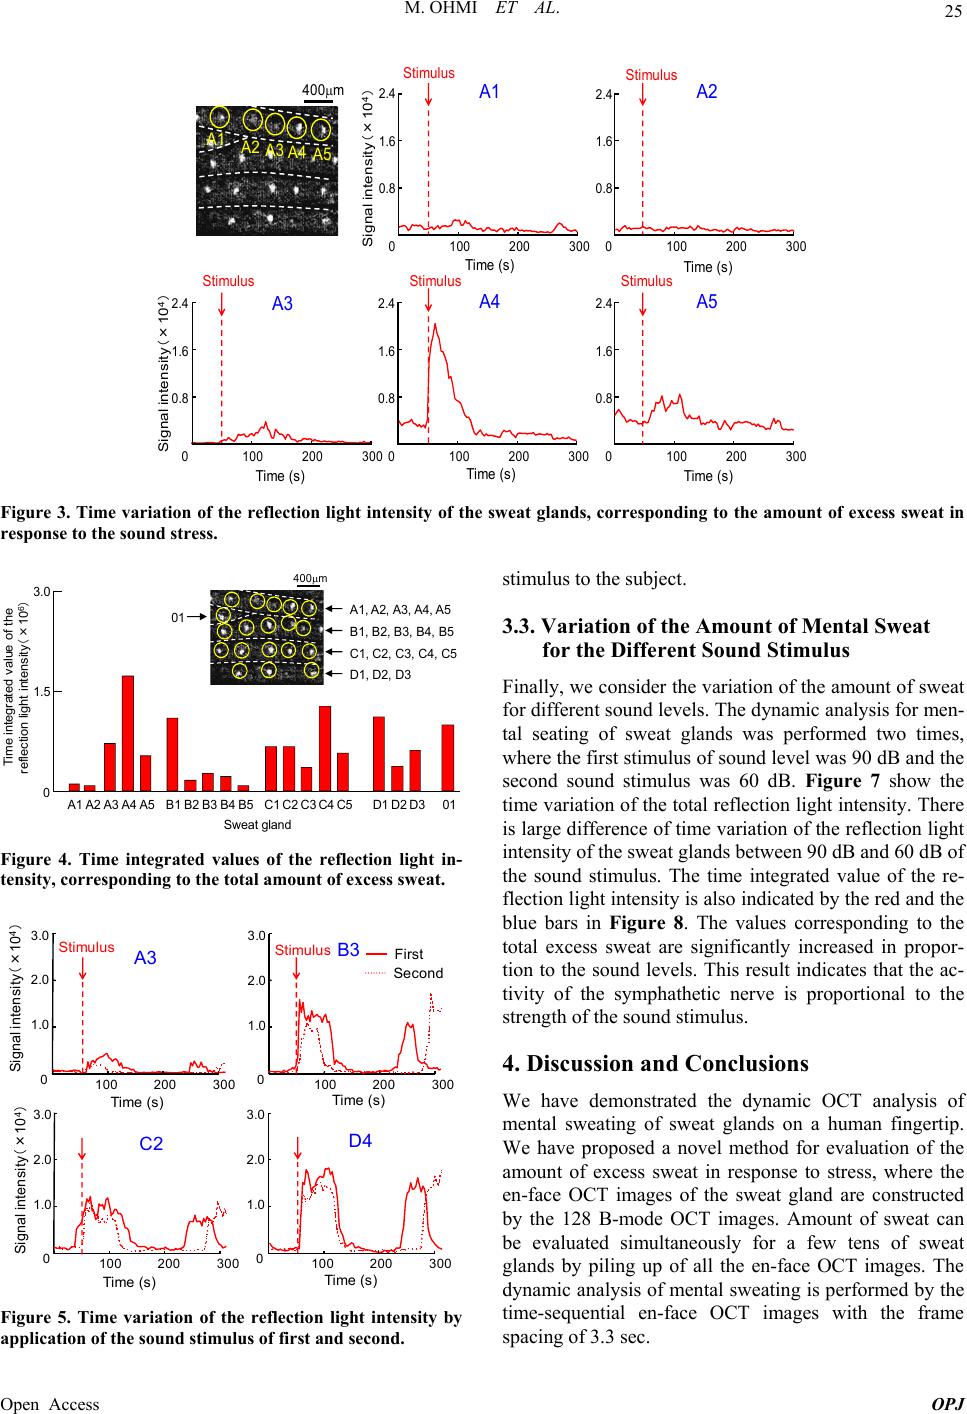
Figure 7. Time variation of the reflection light intensity by
application of the sound stimulus of 90 dB and 60 dB.
A1 A2 A3 A4 B1 B2 B3 B4 B5 C1C2C3C4 C5D1 D2D3 D4
0
2.0
4.0
6.0
8.0
90dB
60dB
A1, A2, A3, A4
B1, B2, B3, B4, B5
C1, C2, C3, C4, C5
D1, D2, D3, D4
Sweat gland
Time integrat ed value of the
ref lec tion light int ens ity (×10
6
)
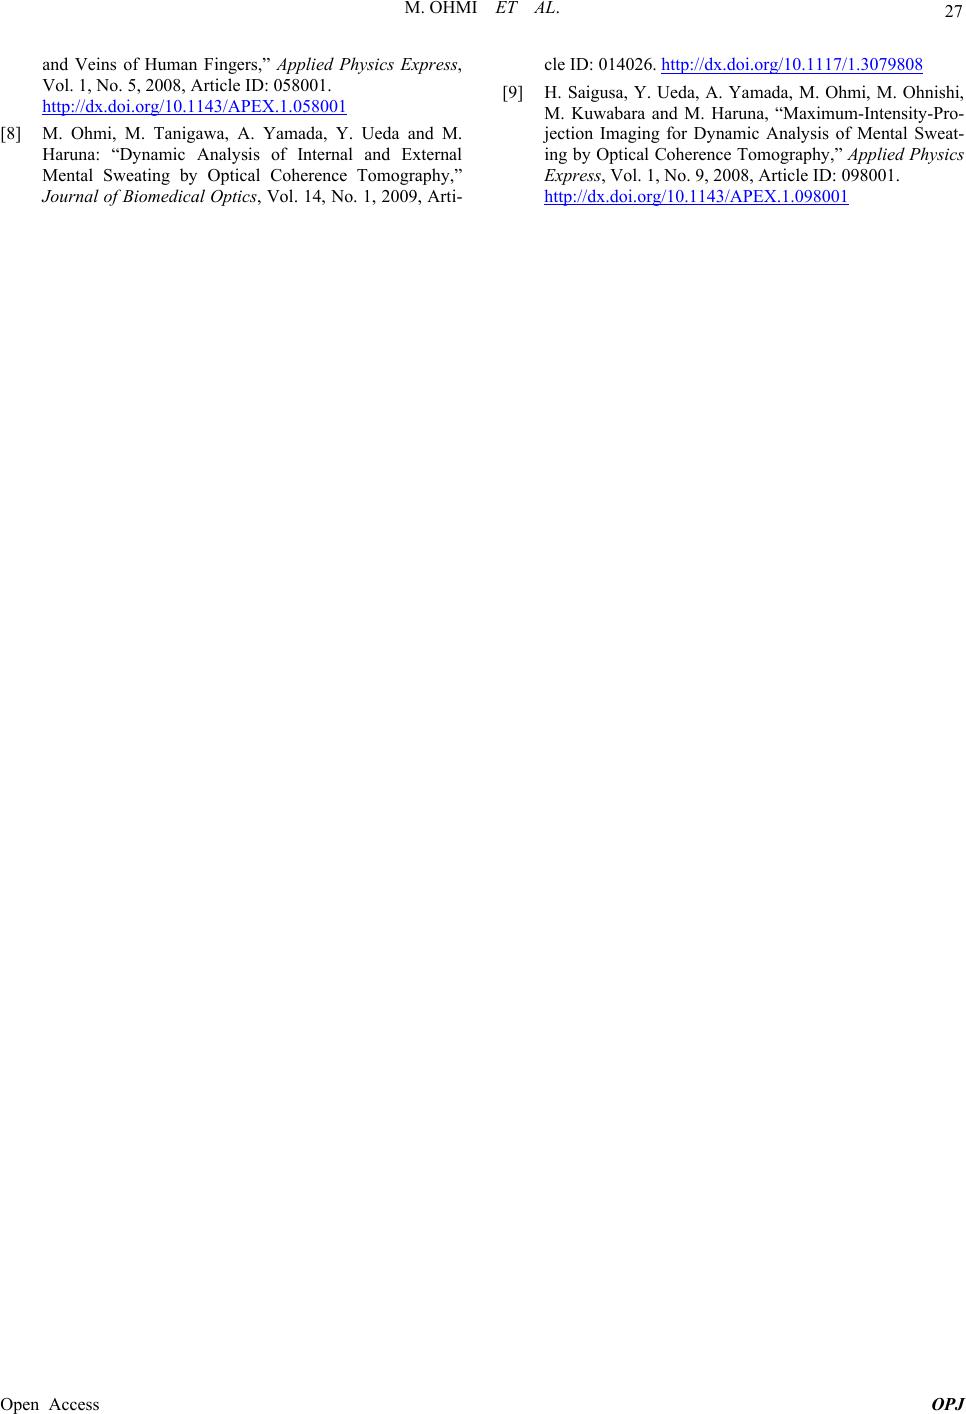
Figure 8. Time integrated values of amount of sweat stimu-
lated by application of the sound stimulus of 90 dB and 60
dB.
From our experimental results, there are some inter-
esting results of mental sweating in sweat glands on a
human fingertip. 1) Strong non-uniformity is observed in
mental sweating where the amount of excess sweat in
response to sound stress is different for each sweat gland.
The non-uniformity may be necessary to adjust as pre-
cisely the total amount of excess sweat as possible
through the sympathetic nerve in response to strength of
the stress. 2) There is no influence of the experience of
the sound stimulus to the volunteer. Our experimental
protocol can be used frequently. 3) The amount of excess
sweat of eccrine sweat glands is increased in proportion
to the strength of the stimulus. This result suggests that
the mental sweating varies quantitatively according to the
stimulus.
5. Acknowledgements
This research was partially supported by Grant-in-Aid for
Scientific Research (C) (2 5350528) from the Japan Soci-
ety for the Promotion of Science (JSPS) and Industrial
Technology Research Grant Program from New Energy
and Industrial Technology Development Organization
(NEDO) of Japan.
REFERENCES
[1] D. Huang, E. A. Swanson, C. P. Lin, J. S. Schuman, W. G.
Stinson, W. Chang, M. R. Hee, T. Flotte, K. Gregory, C.
A. Puliafito and J. G. Fujimoto, “Optical Coherence To-
mography,” Science, Vol. 254, No. 5035, 1991, pp. 1178-
1181. http://dx.doi.org/10.1126/science.1957169
[2] E. A. Swanson, J. A. Izatt, M. R. Hee, D. Huang, C. P.
Lin, J. S. Schuman, C. A. Puliafito and J. G. Fujimoto,
“In-Vivo Retinal Imaging by Optical Coherence Tomo-
graphy,” Optics Letters, Vol. 18, No. 21, 1993, pp. 1864-
1866. http://dx.doi.org/10.1364/OL.18.001864
[3] G. J. Tearney, M. E. Brezinski, B. E. Bouma, S. A. Bop-
part, C. Ptiris, J. F. Southern and J. G. Fujimoto, “In Vivo
Endoscopic Optical Biopsy with Optical Coherence To-
mography,” Science, Vol. 276, No. 5321, 1997, pp. 2037-
2039. http://dx.doi.org/10.1126/science.276.5321.2037
[4] R. Uma Maheswari, H. Takaoka, R. Homma, H. Kadono
and M. Tanifuji, “Implementation of Optical Coherence
Tomography (OCT) in Visualization of Functional Struc-
tures of Cat Visual Cortex,” Optics Communications, Vol.
202, No. 1-3, 2002, pp. 47-54.
http://dx.doi.org/10.1016/S0030-4018(02)01079-9
[5] M. Ohmi, K. Nohara, Y. Ueda, T. Fuji and M. Haruna,
“Dynamic Observation of Sweat Glands of Human Finger
Tip Using All-Optical-Fiber High-Speed Optical Coher-
ence Tomography,” Japanese Journal of Applied Physics,
Vol. 44, No. 26, 2005, pp. L854-L856.
http://dx.doi.org/10.1143/JJAP.44.L854
[6] M. Haruna, T. Fuji, M. Ohmi and N. Hayashi, “In Vivo
Dynamic Imaging of Arterioles of Human Fingers Using
Optical Coherence Tomography at 1.3 mm,” Japanese
Journal of Applied Physics, Vol. 45, No. 33, 2006, pp.
L891-L893. http://dx.doi.org/10.1143/JJAP.45.L891
[7] M. Kuwabara, T. Fuji, M. Ohmi and M. Haruna, “Dy-
namic Optical Coherence Tomography of Small Arteries
Open Access OPJ