 American Journal of Analytical Chemistry, 2013, 4, 661-667 Published Online November 2013 (http://www.scirp.org/journal/ajac) http://dx.doi.org/10.4236/ajac.2013.411079 Open Access AJAC Development of Optical Chemical Sensor Based on Pararosaniline in Sol-Gel Matrix for Detection of Formaldehyde in Food Samples Agus Abdul Gani1, Mochammad Yuwono2, Bambang Kuswandi1 1Chemo and Biosensors Group, Faculty of Pharmacy, Jember University, Jember, Indonesia 2Faculty of Pharmacy, Airlangga University, Surabaya, Indonesia Email: Agusagani@yahoo.com Received September 29, 2013; revised November 1, 2013; accepted November 18, 2013 Copyright © 2013 Agus Abdul Gani et al. This is an open access article distributed under the Creative Commons Attribution License, which permits unrestricted use, distribution, and reproduction in any medium, provided the original work is properly cited. ABSTRACT Optical chemical sensor based on immobilesed pararosaniline into sol-gel matrix tetraethyl orthosilicate (TEOS) is a simple tool that can be used to detect the presence of formalin (formaldehide) in food. Pararosaline in sol-gel matrix was developed when contacted with food sample that contains formalin. The optical signal was produced by changing color from purple to yellow, that can be used to detect quantitative formaldehide in sample. The results, chemo sensor optic, have characteristic, maximum wave length 576.42 nm, with linier range 0 - 100 ppm, linearity coefficient R2 = 0.999, limit detection (LOD) 0.504 ppm, limit of quantification (LOQ) 1.680 ppm, sensitivity 0.087, disturbed matrix selectivity 1.716 %. The optimum is operational at pH 4, and response time at 150 seconds of 2 ppm. This sensor can be used to detect formalin in food sample in a simple mode and reusable for 4 times application. In addition, the sensor can be regenerated using an acid 0.1 M HCl. Keywords: Optical Chemical Sensor; Formaldehide; Pararosalin; Sol-Gel; Food Sample 1. Introduction Some of food in public marketed discovered contains formaldehyde or usually familiar formaldehyde [1]. For- maldehyde is a very dangerous chemical in human health; It gives negative effect to respiration channel, liver and kidney function, and reproducing system [2,3]. Based on the moment conditions, detecting process of formalde- hyde in food, conducting by laboratory process, used GC, HPLC and spectrometry instrument. The weakness me- thods of the mentioned impracticably cannot be prepared out of laboratory and need skilled persons who have backgrounds in chemistry specialty. In addition, such methods are not suitable to be employed in the fields [4]. Therefore, there is an acute need to develop new and inexpensive methods of assessing the formaldehyde con- tain in food, particularly those that can be employed in the field. The alternative methods to detecting formalde- hyde in food have simple process, low cost, and easy to operate by general society [5,6]. In this respect, the chemical sensor represents tools used for simple, quick and low-cost to detect of formal- dehyde in food [7-11]. Developing simple specific opti- cal sensor of formaldehyde is very urgent to give solu- tions to problems in general public to detect formaldehy- de contained in food. The detection of formal-dehyde in food has been proposed using spectrometric [7,11]. Para- rosaniline is one of the specific reagents to detect for- maldehyde, and the reaction between pararosaniline and formaldehyde is presented in Figure 1, next page [5,12]. The optical chemical sensor developing is based on re- agent immobilizing to sol-gel system. Optical transducers in particular have raised much interest currently [12-15]. Since, various novel materials can be used in optical sen- sors such as zeolite, conducting polymers, sol-gel etc. [7- 9]. Sol-gel for instance, there are many advantages, such as its optical clarity, the ability to entrap specific reagent, thermal and chemical stability, simplicity of preparation and flexibility in controlling its pore size and geometry [11,13]. This research uses Tetra Ethyl Ortho Silicate (TEOS) as sol-gel material and shaping as sol-gel granule. The mechanism process, formaldehyde in solution system of 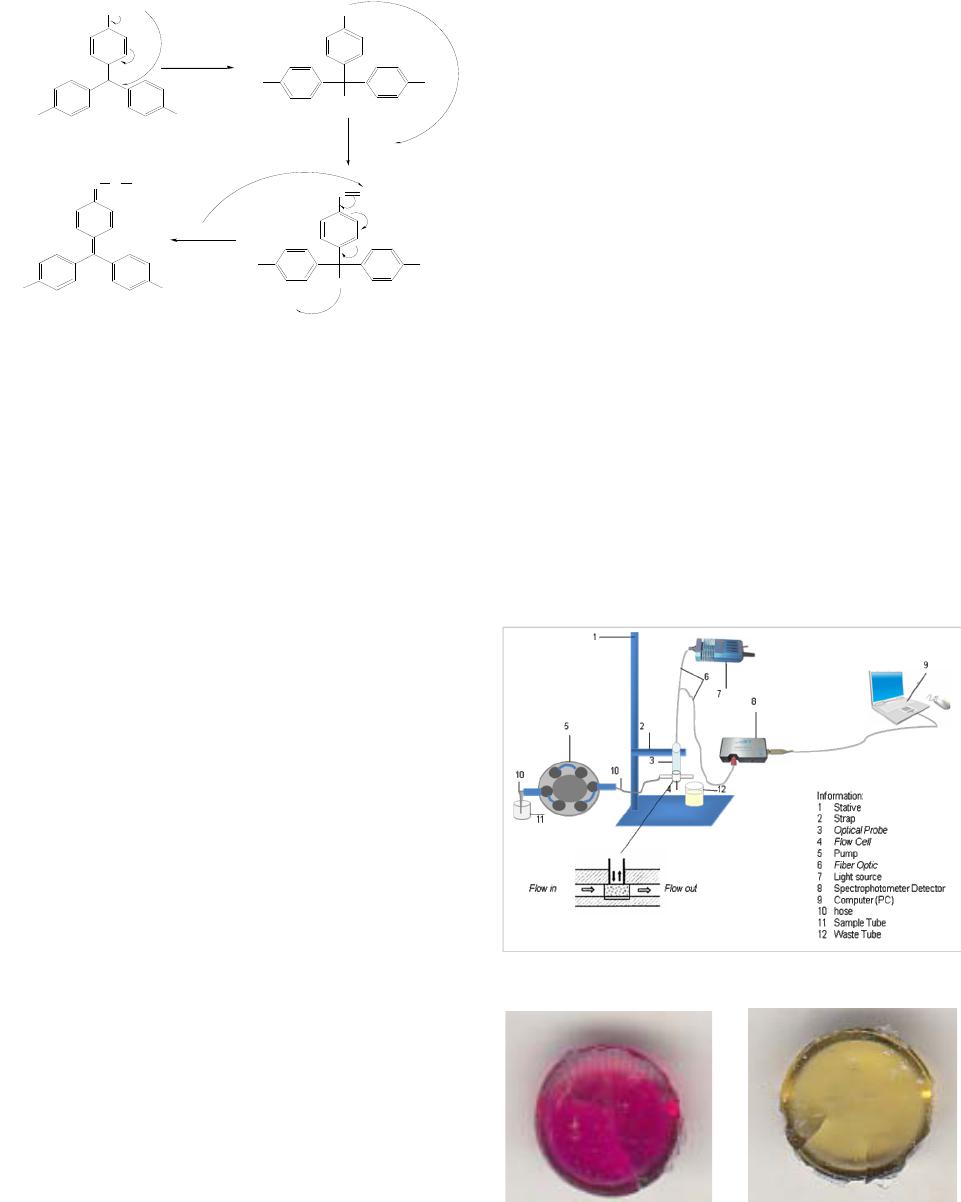 A. A. GANI ET AL. 662 +NH2Cl- NH2 NH2 HSO 3- NC H2 SO3H NH2NH2 +NH3 +NH3 Cl +NH3 Cl NCH2 H2CO +NH3 +NH3 2,4 M HCl + H+ + H2O + Cl- Figure 1. Formaldehyde-pararosaniline reaction. diluting food, diffuses sol-gel and reacts with para- rosaniline reagent producing change color of sol-gel [12]. The specific colors changed sol-gel from yellow to violet indicating that food solution contains formaldehyde, so the food has been solute contains formaldehyde. The sol- gel optical sensor can be used to detect formaldehyde contains in food as qualitative and quantitative manner. 2. Experimental 2.1. Reagent All reagents were used as purchased without further puri- fication. Pararosaniline hydrochloride (SIGMA P3750) was supplied from Sigma (UK). Tetra ethyl orthosilicate (TEOS), hydrochloric acid (HCl 37% pa), Ethanol 96%, Triton X-100, and sodium sulfite (Na2SO3) as precursor of sol-gel, were obtained from BDH-Merck (UK). For immobilization a phosphate buffer solution (PBS) with pH 6,5 was prepared by adjusting amounts of NaCl, KCl, Na2HPO4 and KH2PO4 buffer systems; in all cases, the mixture were 0.1 M in each constituent. The standard formaldehyde solutions of (2; 6; 10; 20; 100; 200; 300; 400; 500) ppm (grade of analytical, Merck) were prepared by appropriate dilution with an appropriate buffer solution in order to produce solutions of lower concentration at a desired pH. Salt and sugar use as interference material. All reagents and inorganic salts were of analytical grade and made using double distillate water. 2.2. Reagent Immobilizations Pararosaniline reagent prepared by making solution, take of 0.03 g pararosaniline hydrochloride, diluting by water to total volume 10 mL used volumetric flask, this solu- tion concentration is 3000 ppm. The solution on Na2SO3, made of 0.1 g Na2SO3 diluting by water to total volume 10 mL used volumetric flask. Pararosaniline sol-gel made by composing of 1.5 mL pararosaniline reagent, 0.5 mL HCl 37%, 250 μL Na2SO3 solution, 2 mL ethanol, 1.75 mL water, and 4.5 mL TEOS composing in beaker glass, stirring a long 3 - 5 hours. After that adding 5 drops of triton X-100 and stirring again 30 minutes, after that molding sol-gel as sol-gel. 2.3. Optical Fiber Biosensors Construction The construction of the optical fiber sol-gel chemo sen- sor has been carried out by carefully placed a single sol-gel of pararosaniline into the specially designed flow- cell (Figure 2). This flow-cell (15 × 10 mm and 15 mm depth) has been designed as back pressure free flow cell, so that the effect of pulse from the pump and air bubbles could be removed. Since these problems often faced in flow system, which in turn increasing noise in signal response. This optical chemical sensor design also allows reducing the effect of other incident light levels on the flow-cell and optical system. 2.4. Results and Discussion 2.4.1. Sol-Gel Sensor Product. The sol-gel sensor product fabrication and it color change before to after interaction with formaldehyde presenting as Figure 3. Figure 2. Flow-cell for optical fiber chemical sensor. (a) (b) Figure 3. Shape and color change of chemical sensor.(a): Chemical sensor before interaction with formalin; (b): Che- mical sensor after interaction with formalin. Open Access AJAC 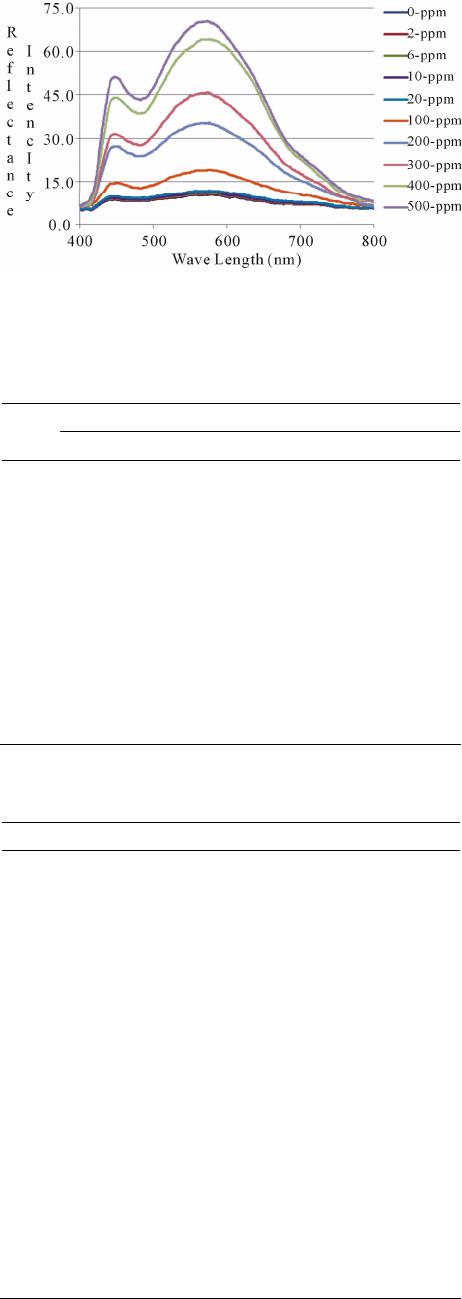 A. A. GANI ET AL. 663 2.4.2. Optimization of Experimental Parameters 1) Optimum Wave Length Operational and Linearity Range Concentration The first step in parameter optimization is to finding the optimal wave length, base on the scanning the spectra of blank solution and some standard formaldehyde solu- tion, 2 ppm, 10 ppm, 20 ppm, 100 ppm, 200 ppm, 800 ppm and 1000 ppm. Result of scanning as presenting by Figure 4, from this spectra, have been result the opti- mum wave length base on the correlation between stan- dard formaldehyde concentrations with intensity of re- flectance produced by sol-gel sensor after reacted with formaldehyde in solution. Based on Figure 4, it is able to resume the reflectance intensity as Table 1 follows. Base on Table 1, the optimum wave length operational is 576.42 nm, and the linearity range concentration (0 - 100) ppm, has slope or sensitivity 0.087, intercept 10.310, and linierity coefficient R2 = 0.999 [15,16]. 2) Test the Confidence Level Linearity Linearity test includes a margin of error sensitivity (slope error) and the margin of error intercept (intercept error). The results of calculations with a 95% of confi- dence level obtained error bounds of sensitivity 0.087 ± 0.0003 and a margin error of intercept 10.31 ± 0.0109 [10,16]. 3) Limit of Detection (LOD) and Limit of Quantifica- tion (LOQ) Referring to Figure 4 and Table 1 further tested the linearity of the calibration curve in detail for the concen- tration range of 0 ppm to 100 ppm, with measurements repeated 7 times for each standard solution. The concen- tration of the standard solution used is a concentration of 0 ppm, 2 ppm, 4 ppm, 6 ppm, 8 ppm, 10 ppm, 12 ppm, 14 ppm, 16 ppm, 18 ppm, 20 ppm, 40 ppm, 60 ppm, 80 ppm and 100 ppm. The next linearity test based on the average concentration measurements every standard. The test results give the following data as Table 2 and Figure 5. Based on data from the linearity of the curve in Table 2 and Figure 5, it obtained the limit of detection (LOD) worth 0.5041 ppm and limit of quantitation (LOQ) of 1.6804 ppm [16]. 4) Sensor Reproducibility The data resumes to detecting Sensor Repro-ducti- vebility Measurement from 7 repeatbles as presenting Table 3 followed. Table 3 data give reality, the variance coefficient measurements base of reflectance signal, minimum 0.025% and optimum 0.557%. The variance coefficient measurements base of formalin contains, minimum 0.8768% and optimum 4.7875%. This condi- tion are lowest of 5%, so the chemical sensor is usable as formalin detector [10,16]. 5) Sensor Responses Time Figure 4. Spectra profile of formaldehyde by pararosaline TEOS optical chemical sensor. Table 1. The optimum reflectance intensity some standard formadehyde solution. Left peaks Right peaks λ Tested [H2CO] (ppm) λ Int.Reflt λ Int.Reflt 447.30 448.26576.42 0 448.268.538576.42 10.377 8.456 8.53810.377 2 444.428.653576.42 10.547 8.429 8.51110.547 6 446.828.882576.42 10.888 8.871 8.83010.888 10 442.59.112576.42 11.228 8.907 8.99511.228 20 447.309.685576.42 11.867 9.685 9.62711.867 100 453.0614.551576.42 18.989 14.284 14.44318.989 200 448.2627.294576.42 35.354 27.245 27.29435.354 300 447.3031.518574.98 45.763 31.518 31.43845.634 400 447.3044.015574.94 64.237 44.015 43.97661.213 500 448.2651.101574.02 70.497 50.405 51.10170.249 Table 2. Reflectance intensity data of linierity curve 0 ppm - 100 ppm on 576.42 nm. [Formalin]Measuring Intensity (Y) Kurve Intensity (Ŷ)(Y-Ŷ )2 0 10.328 10.310 0.00034 2 10.504 10.484 0.00040 4 10.669 10.658 0.00013 6 10.845 10.832 0.00017 8 11.026 11.006 0.00039 10 11.191 11.180 0.00013 12 11.348 11.354 0.00003 14 11.520 11.528 0.00007 16 11.693 11.702 0.00008 18 11.859 11.876 0.00028 20 12.037 12.050 0.00018 40 13.802 13.790 0.00014 60 15.539 15.530 0.00009 80 17.287 17.270 0.00028 100 19.019 19.010 0.00008 Deviasion Standard 0.01462 Open Access AJAC 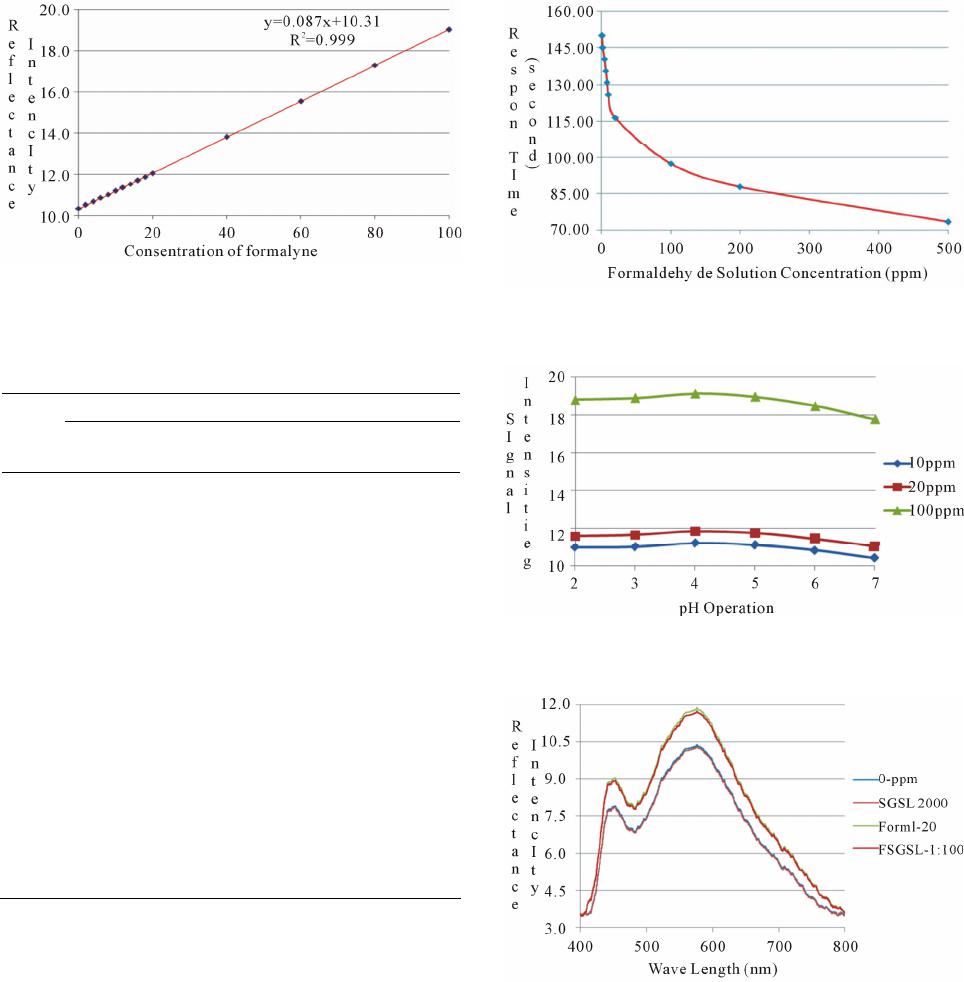 A. A. GANI ET AL. 664 Figure 5. Test product of linearity on concentration range of 0 ppm - 100 ppm, on wave length 576.42 nm, by 7 time repetition for each standard solution. Table 3. Data of reproducibility measurements. Sensor Reflectance Measurement Concentration [CH2O] ppm Averg. STDev % KVAverg. (ppm) STDev % KV 0 10.328 0.015 0.1420.948 0.01261.3240 2 10.504 0.003 0.0252.355 0.02971.2598 4 10.669 0.017 0,1604.361 0.19584.4902 6 10.845 0.022 0.2006.784 0.24983.6826 8 11.026 0.022 0.1978.617 0.24942.8939 10 11.191 0.039 0.34710.125 0.44574.4017 12 11.348 0.038 0.33111.358 0.43153.7992 14 11.520 0.041 0.35513.208 0.46773.5411 16 11.693 0.062 0.53014.865 0.71174.7875 18 11.859 0.030 0.24916.832 0.33872.0122 20 12.037 0.066 0.55119.847 0.76193.8390 40 13.802 0.077 0.55741.860 0.88292.1092 60 15.539 0.047 0,30261.426 0.53860.8768 80 17.287 0.086 0.49580.996 0.98281.2134 100 19.019 0.045 0.238100.564 0.51940.5164 The responses time of sensor has been affected by concentration of formaldehyde in solution system. Type of formaldehyde concentration affected to sensor re- sponse time presenting like Figure 6, follow. Base on Figure 6, the response time of sensor between 75.88 seconds for 500 ppm to 150 seconds for 2 ppm formal- dehyde concentrations. 6) Operational Conditions of pH Sensor The reaction between pararosaniline with formalin affected by the pH, the influence of pH conditions the sample system to the intensity of reflectance sensor inte- raction with formalin results provide Figure 7, presented above. Based on the Figure 7, obtained information that the system for the detection of formaldehyde in the solu- tion pH conditions are optimal system operating at pH 4. 7) Sensor Selectivity Figure 6. Response time of sensor base formaldehyde con- centration. Figure 7. Effect of pH on the intensity of reflectance ope- rational. Figure 8. Sensor selectivity curve formalin to interference ratio of sugar-salt at a concentration of 1:100. The selectivity of the sensor for the identification of formaldehyde in the system through the test solution with sugar and salt. Selectivity trials conducted with formalin concentration ratio, salt and sugar 1:10, 1:100 and 1:1000. Sample spectra pattern measurements sugar disorders and formalin shown as Figure 8 and the data as Table 4(a) the following. According to the test result tampering sugar and salt at Table 4(a), obtained information that the existence of sugar and salt in aqueous system can provide a distrac- Open Access AJAC  A. A. GANI ET AL. Open Access AJAC 665 Table 4. (a): The intensity of reflectance on the condition of Interference Salt, Sugar, and Sugar-Salt Against Formalin; (b): Recovery of optical chemichal sensor on determining formalin in sample solution using standard and standard addision methode. (a) Composition of Test Sample Reflectance Intensity 0 ppm (Blank) Formalin (F) 200 ppm 10.377 35.354 Interferences % Interferences Salt (Sl) 2000 ppm F:Sl = 1:10 10.194 35.273 0.081 0.229 Sugar (Sg) 2000 ppm F:Sg = 1:10 10.425 35.292 0.062 0.175 Sugar-Salt 2000 ppm 10.306 F:Sg:Sl = 1:10:10 35.209 0.145 0.410 Formalin (F) 20 ppm 11.867 Salt (Sl) 2000 ppm 10.194 F: Sl = 1:100 11.839 0.028 0.236 Sugar (Sg) 2000 ppm 10,425 F: Sg = 1:100 11.767 0.100 0,843 Sugar-Salt 2000 ppm 10.306 F: Sg: Sl = 1:100:100 11.741 0.126 1.062 Formalin (F) 2 ppm 10.547 Salt (Sl) 2000 ppm 10.194 F:Sl = 1:1000 10.522 0.025 0.237 Sugar (Sg) 2000 ppm 10.425 F:Sg = 1:1000 10.388 0.159 1.507 Sugar-Salt 2000 ppm 10.306 F:Sg:Sl = 1:1000:1000 10.366 0.181 1.716 (b) Standard Method Addition Method Sample Obyek [Formalin] (ppm) [Formalin] RetrievalStd DevRecovery (%)t-Test[Formalin] Retrieval Std Dev Recovery (%)t-Test 10 9.524 0.29995.241 2.7559.847 0.171 98.470 1.552 20 19.286 0.35396.432 3.49819.487 0.303 97.434 2.932 60 58.153 0.84896.921 3.77258.865 0.512 98.108 3.837 Sea Fish Meat 100 98.636 0.77898.636 3.03698.379 0.755 98.379 3.716 10 9.879 0,07298.794 2.9119.964 0.050 99.640 1.246 20 19.548 0,26597.740 2.95919.826 0.153 99.132 1.969 60 59.533 0,26699.221 3.04559.704 0.157 99.507 3.257 Noodles Soggy 100 98.969 0,62598.969 2.85799.411 0.661 99.411 1.545 tion to the measurement of the levels of formaldehyde in solution. The higher the concentration of sugar and salt, or in solution, the greater the percentage of its disorders. Selectivity of the sensor towards the sugar and salt as the interference was 1.716% [10,16]. 8)Sensors Acurration The accuracy of the sensors are tested through sensor application to a sample simulation known concentrations of formaline content. Testing using two sample object i.e. meat fish and noodles soggy, each with 4 kinds of concentration, that is 10 ppm, 20 ppm, 60 ppm and 100 ppm. Testing is done through standard methods and standard addisi. The test results are shown in Table 4(b) up. Based on the data of Table 4(b), indicating that the retrieval of chemical sensor hoses both in standard methods as well as standard addisi have trust between the area range 95.241% - 99.640%. Test results of t-test accurasion, have been obtained a quantity t-test is smaller than the price of t-test table reference of 4.3. Such conditions mean optical chemical sensors worth applies. 9) Reuse Sensor Test reuse (regeneration) is done by using a solution of formalin solution and blank with concentration of (10 ppm, 20 ppm, 40 ppm, 60 ppm, 80 ppm and 100 ppm). The test results give a picture of a decrease in the performance of the sensor as shown in Table 5. Based on the data in Table 5, obtained the fact that  A. A. GANI ET AL. 666 optical chemical sensors can be used repeatedly for four times, because its still 92.611% compared to the initial state, means meets the minimum limit analysis method rule capabilities sensor 90 % for reuse. 3. Applications Sensor for Real Samples Application sensors for real samples performed using standard additions methods tested Sea-Fish meat and noodles soggy use of 5 sample objects. The results of measurements of formaldehyde content in the real sam- ple by using optical chemical sensors and UV-Vis as a comparison method, as shown in the Table 6 below. Based on the data in Table 6 brings about reality, that the determination of formaldehyde in food samples between using the chemical sensors and methods UV-Vis pro- vides a different quantity. But quantitatively the diffe- rence is relatively low and still meet the criteria analysis. Table 5. Chemical sensors measure power capacity on the use in the regeneration based on the intensity of reflektan. Reflectance intensity and sensor % capacity [Formalin] 1st 2nd 3th 4th 5th 11.191 11.013 10.962 10.804 10.663 10 100% 98.414 97.958 96.542 95.284 12.040 11.839 11.658 11.454 11.162 20 100% 98.331 96.822 95.126 92.705 13.856 13.607 13.266 12.869 12.260 40 100% 98.203 95.748 92.883 88.484 15.659 15.264 14.867 14.183 13.575 60 100% 97.479 94.945 90.578 86.692 17.361 16.931 16.474 15.699 14.789 80 100% 97.520 94.887 90.427 85.182 19.064 18.584 18.063 17.178 16.130 100 100% 97.480 94.751 90.108 84.611 Average % capacity 97.905 95.852 92.611 88.826 Table 6. Formaldehyde content determination results in real sample solution by standard addition method. Real sample [Formalin] Real Sample Sample object Chemical sensor UV-Vis S1 413.199 412.875 S2 417.238 416.439 S3 410.818 410.783 S4 419.381 407.992 Sea Fish Meat S5 412.253 411.753 Average 414.578 411.968 S1 34.877 34.898 S2 34.753 33.786 S3 35.923 35.253 S4 36.943 36.856 Noodles Soggy S5 34.689 34.540 Average 35.437 35.066 Furthermore if the review of the results of the analysis of the paired t-tests (Paired t-Test), found no difference between the two methods of determination of the results of the two system analysis [10,16]. 4. Conclusion Based on the test results of the operational characteristics of the optic chemical sensor fabrication yield, it can be concluded that the sensor has the feasibility to use in the process of identifying and determinating the presence of formalin in food. In addition, the sensor can be regene- rated using an acid solution. 5. Acknowledgements This research was funded by grants DIPA Airlangga University in 2012 according to Rector Decree No. 2613/H3.1/KR/2012 and Jember University. The autor convey thank’s for assistent forman and the staffs of profusely, to the leadership and all staff LPPM UNAIR, and members of Chemo and and Biosensor group Fac- ulty of Pharmacy UNEJ. as well as all those who helped conduct of this research. REFERENCES [1] Badan POM RI, “Keterangan Pers Badan POM Nomor: KH.00.01.1.241.002 Tentang Penyalahgunaan Formalin untuk Pengawet Mie Basah, Tahu dan Ikan,” InfoPOM Badan Pengawas Obat dan Makanan Republik Indonesia, Vol. 7, No. 1, 2006, pp. 1-12. [2] International Agency for Research on Cancer, “Formal- dehyde, 2-Butoxy ethanol and 1-tert-Butoxypropan-2-ol,” World Health Organization-Summary of Data Reported and Evaluation, Vol. 88, 2006, pp. 1-16. [3] US Environmental Protection Agency, “Toxicological Review of Formaldehyde-Inhalation Assessment, Vol. I - IV Introduction, Background and Toxicokinetics,” EPA, Washington, DC, 2010. [4] D. A. Skoog, H. Holler and Nieman, “Principles of In- strumental Analysis,” 5th Edition, Saunders, New York, 2000. [5] R. Narayanaswamy, “Optical Chemical Sensors and Bio- sensors for Food Safety and Security Applications,” Acta Biologica Szegediensis, Vol. 50, No. 3-4, 2006, pp. 105- 108. [6] B. R. Eggin, “Chemical Sensors and Biosensors,” John Wiley & Sons Inc., New York, 2002. [7] L. Dai, P. Soundarrajan and T. Kim, “Sensors and Sensor Arrays Based on Conjugated Polymers and Carbon Nanotubes,” Pure and Applied Chemistry, Vol. 74, No. 9, 2002, pp. 1753-1772. http://dx.doi.org/10.1351/pac200274091753 [8] O. Bunkoed, F. Davis, P. Kanatharana, P. Thavarungkul, and S. P. J. Higson, “Sol-Gel Based Sensor for Selective Formaldehyde Determination,” Analytica Chimica Acta, Open Access AJAC  A. A. GANI ET AL. Open Access AJAC 667 Vol. 659, No. 1-2, 2010, pp. 251-257. http://dx.doi.org/10.1016/j.aca.2009.11.034 [9] B. Kuswandi, ”Proyek Pengem-Bangan Sensor Kimia dan Biosensor Berbasis Serat Optik di Indonesia,” Makalah Seminar Kimia FMIPA UNEJ, Universitas Jember, Jem- ber, 2001 [10] M. M. Collision and A. R. Howels, “Chemical Sensor,” Analytical Chemistry, Vol. 39, 2000, pp. 600-618. [11] C. C. Perry, “Sol-Gel Technology the Way Forward for Tomorrow’s Material,” Trent University, Nottingham, 1996. [12] R. R. Miksch, W. A. Douglas, Z. F. Leah, D. H. Craig, R. Kenneth, G. Jacquelline, “Modified Pararosaniline Me- thod for the Determination of Formaldehyde in Air,” Analytical Chemistry, Vol. 53, No. 13, 1981, pp. 2118- 2123. http://dx.doi.org/10.1021/ac00,236a040 [13] L. Dai, P. Soundarrajan and T. Kim, “Sensors and Sensor Arrays Based on Conjugated Polymers and Carbon Nanotubes,” Pure and Applied Chemistry, Vol. 74, No. 9, 2002, pp. 1753-1772. http://dx.doi.org/10.1351/pac200274091753 [14] G. J. Mohr, “Materials and Polymers in Optical Sensing,” Institute of Physical Chemistry, FSU-Jena, 2002. [15] IUPAC, “Selectivity in Analytical Chemistry (IUPAC Recommendations 2000),” 2001. [16] J. C. Miller and J. N. Miller, “Statistics for Analytical Chemistry,” Ellis Horward, PTR, Tentice Hall, England, 1993.
|