Journal of Minerals and Materials Characterization and Engineering, 2013, 1, 315-320
Published Online November 2013 (http://www.scirp.org/journal/jmmce)
http://dx.doi.org/10.4236/jmmce.2013.16047
Open Access JMMCE
Studies on the Effect of Zinc Chloride Mixing on
Bisthiourea Cadmium Chloride Crystals
R. S. Sundararajan, M. Senthilkumar, C. Ramachandraraja*
Department of Physics, Government Arts College (Autonomous), Kumbakonam, India
Email: *crraja_phy@yahoo.com
Received September 11, 2013; revised October 23, 2013; accepted October 30, 2013
Copyright © 2013 R. S. Sundararajan et al. This is an open access article distributed under the Creative Commons Attribution Li-
cense, which permits unrestricted use, distribution, and reproduction in any medium, provided the original work is properly cited.
ABSTRACT
Nonlinear optical Zinc mixed bisthiourea Cadmium chloride (BTCC) crystals were synthesized and grown by slow
evaporation method. The FTIR analysis reveals that the C-N stretching frequencies of thiourea are shifted towards the
higher frequencies for pure and Zinc mixed BTCC and the C = S stretching frequencies are shifted towards the lower
frequencies for pure and Zinc mixed BTCC crystals. These observations suggest that the metals coordinate with thio-
urea through sulphur. UV-Vis-NIR spectra were recorded to study the optical transparency of the grown crystals. The
lower cutoff wavelength is observed at 233 nm for the pure BTCC crystals. There is no comparable change in the lower
cutoff wavelength for the Zinc mixed BTCC crystals. The Nonlinear Optical (NLO) efficiency of the pure BTCC crys-
tal decreases with the increase percentage mixing of Zinc. The SHG output for BTCC mixed with 1% zinc chloride is
almost 9 times greater than the SHG output obtained for Pottasium Dihydrogen Phosphate (KDP) crystal. Vicker’s mi-
crohardness test done on the experimental crystals proves their greater physical strength.
Keywords: Zinc; BTCC; Crystals; Nonlinear Optical (NLO)
1. Introduction
Nonlinear optical (NLO) materials play an important role
in nonlinear optics, optical communication, optical switch-
ing, optical disk data storage, laser fusion reactions, op-
tical rectifications and in particular they have a great im-
pact on information technology and industrial applica-
tions [1-6]. The approach of combining the high nonlin-
ear optical coefficient of the organic molecules with the
excellent physical properties of the inorganics was found
to be extremely successful in the recent past [7-11]. Thio-
urea, which is centrosymmetric, yields excellent noncen-
trosymmetric materials. Zinc chloride mixed bisthiourea
cadmium chloride crystals were synthesized and grown
by slow evaporation method and identified as the useful
crystals for nonlinear optical applications.
In this present work, growth of zinc chloride mixed BTCC
crystals and their characterization through XRD, FTIR, UV-
Vis-NIR, SHG and micro hardness analysis are discussed.
2. Experimental Growth of Pure BTCC
Crystals
BTCC crystal was synthesized by dissolving AR grade
thiourea and AR grade cadmium chloride in the molar
ratio 2:1 in distilled water. The saturated solution of
cadmium chloride is slowly added to the saturated solu-
tion of thiourea. This is stirred well to get a clear solution.
Pure BTCC crystal was synthesized according to the re-
action,

22 2
22
2
2CSNHCdClCdCSNHCl
 

 
2
The solution was purified by repeated filteration. The
saturated solution was kept in a beaker covered with
polythene paper. For slow evaporation 6 or 7 holes are
made in the polythene paper. Then the solution is left
undisturbed in a constant temperature bath (CTB) kept at
a temperature of 35˚C with an accuracy of ±0.1˚C. As a
result of slow evaporation, after 75 days colorless and
transparent pure BTCC crystals were obtained (Figure 1).
The same procedure was followed to grow zinc chlo-
ride mixed BTCC crystals.
3. Result and Discussion
3.1. Single Crystal XRD Analysis
The lattice dimensions and the crystal system have been
*Corresponding autho
r
.
R. S. SUNDARARAJAN ET AL.
316
Figure 1. Photograph of pure BTCC Crystals.
determined from the single X-ray diffraction analysis
(Model: ENRAF NONIUS CAD 4). The determined unit
cell parameters and the observed crystal system are re-
ported in the Table 1.
3.2. Powder XRD Analysis
Powder XRD analysis of the grown zinc chloride mixed
BTCC crystals have been carried out using Rich Siefert
diffractometer with Cu Kα λ = 1.5406 A˚ radiation on
crushed powder of zinc chloride mixed BTCC crystals.
The recorded powder X-ray patterns are shown in Figure
2. The differences in amplitude of the peak can be attrib-
uted to the difference in grain size and orientation of the
powdered grains of the experimental crystals. The ob-
served diffraction is indexed by Rietveld index software
package. The lattice parameters calculated by Reitveld
software package are tabulated in Table 2. The data ob-
tained by powder X-ray diffraction are in good agree-
ment with the single crystal XRD data.
3.3. Fourier Transform Infrared Spectroscopy
(FTIR) Analysis
The FTIR spectroscopy studies were used to analyze the
presence of functional groups in synthesized compound.
The FTIR spectrums of pure BTCC and zinc chloride
mixed BTCC were recorded using Perkin Elmer spec-
trum FTIR spectrometer by KBr pellet technique in the
range 4000 - 400 cm–1 (Figures 3(a)-(d)). The character-
istic vibrational frequencies of the functional groups of
pure BTCC and zinc chloride mixed BTCC have been
compared with thiourea. The comparison of characteris-
tic vibrational frequencies is given in Table 3.
In the FTIR spectra, the NH stretching vibrational
bands were observed around 3383 cm1, 3297 cm1 and
3200 cm–1. These bands were shifted to higher wave
number region when compared to that of the free ligand.
Figure 2. Powder XRD pattern of BTCC and ZnCl2 mixed
BTCC.
This shift may be due to the increases in the polar char-
acter of thiourea molecule because of the formation of s
m bands in pure and zinc chloride mixed Cd[Tu]2Cl2
complex.
The bands observed around 1620 cm–1 in the investi-
gated crystals correspond to NH2 bending vibration. The
Open Access JMMCE
R. S. SUNDARARAJAN ET AL.
Open Access JMMCE
317
Table 1. Single crystal XRD results of the grown crystals.
Sl. No. Crystal name Axial lengths of unit cell (a, b and c) Inter axial angles
(α, β and γ) Volume Crystal system
1 BTCC 100% a = 5.804 Å
b = 6.463 Å; c = 13.099 Å α = β = γ = 90˚ 491.3(4)Å3 Orthorhombic
2 1 mole % ZnCl2 mixed BTCCa = 5.805 Å
b = 6.468 Å; c = 13.155 Å α = β = γ = 90˚ 492.5(3)Å3 Orthorhombic
3 5 mole % ZnCl2 mixed BTCCa = 5.827 Å
b = 6.477 Å; c = 13.112 Å α = β = γ = 90˚ 494.8(5)Å3 Orthorhombic
4 10 mole % ZnCl2 mixed BTCC a = 5.822 Å
b = 6.474 Å; c = 13.097 Å α = β = γ = 90˚ 493.7(3)Å3 Orthorhombic
BTCC—Bisthiourea cadmium chloride; BTZC—Bisthiourea zinc chloride.
Table 2. Powder XRD results of the grown crystals.
Sl. No. Crystal name Observed a,b,c values by
single XRD analysis
Calculated a,b,c values by
powder XRD analysis
Observed volume by
single XRD analysis
Calculated volume by
powder XRD analysis
1 BTCC 100%
a = 5.804 Å; b = 6.463 Å
c = 13.099 Å
a = 5.794 Å
b = 6.461 Å; c = 13.139 Å 491.3(4)Å3 491.91(3)Å3
2 1 mole % ZnCl2 mixed BTCCa = 5.805 Å; b = 6.468 Å
c = 13.155 Å
a = 5.812 Å
b = 6.466 Å; c = 13.161 Å 492.5(3)Å3 494.62(3)Å3
3 5 mole % ZnCl2 mixed BTCCa = 5.827 Å; b = 6.477 Å
c = 13.112 Å
a = 5.814 Å
b = 6.484 Å; c = 13.105 Å 494.8(5)Å3 494.15(3)Å3
4 10 mole % ZnCl2 mixed BTCCa = 5.822 Å; b = 6.474 Å
c = 13.097 Å
a = 5.819 Å
b = 6.474 Å; c = 13.099 Å 493.7(3)Å3 493.50(3)Å3
(a) (b)
(c) (d)
Figure 3. (a) FTIR Spectrum of BTCC; (b) FTIR Spectrum of 1 mole %. ZnCl2 mixed BTCC; (c) FTIR Spectrum of 5 mole
% ZnCl2 mixed BTCC; (d): FTIR Spectrum of 10 mole %. ZnCl2 mixed BTCC.
R. S. SUNDARARAJAN ET AL.
318
Table 3. The comparison of characteristic vibrational frequencies.
Thiourea Pure BTCC
(cm1)
1 mole % zinc chloride
mixed BTCC (cm1)
5 mole % zinc chloride
mixed BTCC (cm1)
10 mole % zinc chloride
mixed BTCC (cm1)
Pure BTZC
(cm1) Assignments
494.12 474.32 473.89 471.59 478.66 474.89 Asymmetric NCS bending
730.07 711.10 710.34 710.77 712.90 711.85 C-N symmetric stretching
1082.18 1095.19 1095.46 1095.96 1092.18 1098.25NH2 rocking
1414.23 1393.26 1392.48 1394.42 1393.69 1402.81C = S asymmetric Stretching
1477.31 1494.04 1493.88 1493.48 1489.55 1494.28C-N asymmetric stretching
1620.19 1615.31 1615.73 1614.32 1623.16 1623.48NH2 asymmetric Bending
3177.22 3194.81 3195.06 3195.78 3202.09 3200.62N-H stretching
3279.43 3281.14 3281.59 3281.63 3295.24 3297.59N-H stretching
3380.17 3387.96 3387.22 3388.22 3395.09 3383.79N-H stretching
bands observed around 1494 cm–1 were identified as
the N-C-N stretching vibration. The bands observed
around 1402 cm1 in the pure and zinc chloride mixed
Cd[Tu2]Cl2 crystals correspond to C = S stretching vibra-
tion. The bands for NH2 rocking vibration in the grown
crystals were observed around 1098 cm1. The symmetric
C = S stretching was observed near 711 cm1. The IR
band for N-C-N bending vibration was observed around
474 cm1.
The standard IR bands of thiourea and that obtained
for pure and zinc chloride mixed Cd[TU2]Cl2 crystal are
compared along with their assignments and are presented
in Table 3. It is found that the NH2 rocking and C-N
stretching (1082 and 1477 cm1) bands of thiourea are
shifted to higher frequencies of pure and zinc chloride
mixed BTCC crystals. Also the C = S stretching bands of
thiourea (1414 and 730 cm1) are shifted to lower fre-
quencies of pure and zinc chloride mixed BTCC crystals.
These results reveal that the metals coordinate with thio-
urea through sulphur [12].
3.4. UV-Vis-NIR Analysis
Optical transmission spectra of pure and zinc chloride
mixed BTCC crystals have been measured by adopting
Cary 500 scan spectrophotometer. The transmission spec
trum was recorded in the range from 190 nm - 1100 nm.
UV-Vis-NIR spectrum was recorded to study the optical
transparency of the grown pure and zinc chloride mixed
BTCC crystals (Figures 4(a)-(d)). The grown crystals
are transparent in the wavelength region from 250 nm to
1100 nm. The lower cut off wavelength is observed at
250 nm for the pure BTCC crystals. When the 1 mole %
zinc chloride mixed with BTCC, there is no change in the
lower cut off wavelength. Likewise the increasing per-
centage of zinc mixed with BTCC crystals, there is no
comparable change in the lower cut off wavelength. The
pure and zinc mixed BTCC crystals are having good
transparency in the entire visible region.
3.5. Second Harmonic Generation Studies
The second harmonic generation test was carried out by
classical powder method developed by Kurtz and Perry.
It is an important and popular tool to evaluate the con-
version efficiency of NLO materials. The fundamental
beam of 1064 nm from Q switched Nd: YAG laser was
used to test the second harmonic generation (SHG) prop-
erty of pure BTCC and zinc chloride mixed BTCC crys-
tals. Pulse energy 2.9 mJ/pulse and pulse width 8 ns with
a repetition rate of 10Hz were used. The photo multiplier
tube (Hamahatsu R2059) was used as detector and 90
degree geometry was employed. The input laser beam
was passed through an IR detector and then directed on
the microcrystalline powdered sample packed in a capil-
lary tube. The SHG signal generated in the sample was
confirmed from the emission of green light from the
sample [13]. The SHG output of pure BTCC crystal was
98 mV. The SHG output of BTCC mixed with 1 mole %
of zinc chloride was decreased to 91 mv. Likewise the
SHG output of pure BTCC crystal is gradually decreased
with the increased percentage mixing of zinc chloride
(Table 4). This may be due to the lesser atomic weight of
zinc when compared with cadmium since the decrease in
the atomic weight reduces the pulling effect on C = S
band which results in absence of centre of symmetry [14].
3.6. Micro Hardness
Vicker’s micro hardness test was carried out for pure
BTCC crystals and also zinc chloride mixed BTCC crys-
tals. The results tabulated (Table 5) shows that all the
experimental crystals have great physical strength which
is well established by the increase in the hardness value
with increase in the load.
4. Conclusion
The good nonlinear optical quality, pure bisthiourea
cadmium chloride and zinc chloride mixed BTCC crys-
Open Access JMMCE
R. S. SUNDARARAJAN ET AL. 319
(a) (b)
(c) (d)
Figure 4. (a) UV-Vis-NIR spectrum of BTCC; (b) UV-Vis-NIR spectrum of 1 mole % ZnCl2 mixed BTCC; (c) UV-Vis-NIR
spectrum of 5 mole % ZnCl2 mixed BTCC; (d) UV-Vis-NIR spectrum of 10 mole % ZnCl2 mixed BTCC.
Table 4. NLO efficiency results.
Crystal NLO efficiency in mv
Pure BTCC 98
1 mole % ZnCl2 mixed BTCC 91
5 mole % ZnCl2 mixed BTCC 90
10 mole % ZnCl2 mixed BTCC 76
KDP 11
Urea 104
Table 5. Micro hardness results of the grown crystals.
Load Pure BTCC
1 mole % ZnCl2 mixed BTCC 5 mole % ZnCl2 mixed BTCC10 mole % ZnCl2 mixed BTCC
grams HV HV HV HV
25 41.4 15.6 22.6 35.1
50 58.2 28.1 35.0 54.6
100 74.4 48.7 55.7 83.8
tals were grown by slow evaporation method. The grown
crystals were characterized by single crystal XRD, pow-
der XRD, FTIR analysis, UV-Vis-NIR analysis, second
harmonic generation and Vicker’s micro hardness studies.
The lattice parameters obtained from single crystal XRD
matches with that of lattice parameters were calculated
Open Access JMMCE
R. S. SUNDARARAJAN ET AL.
320
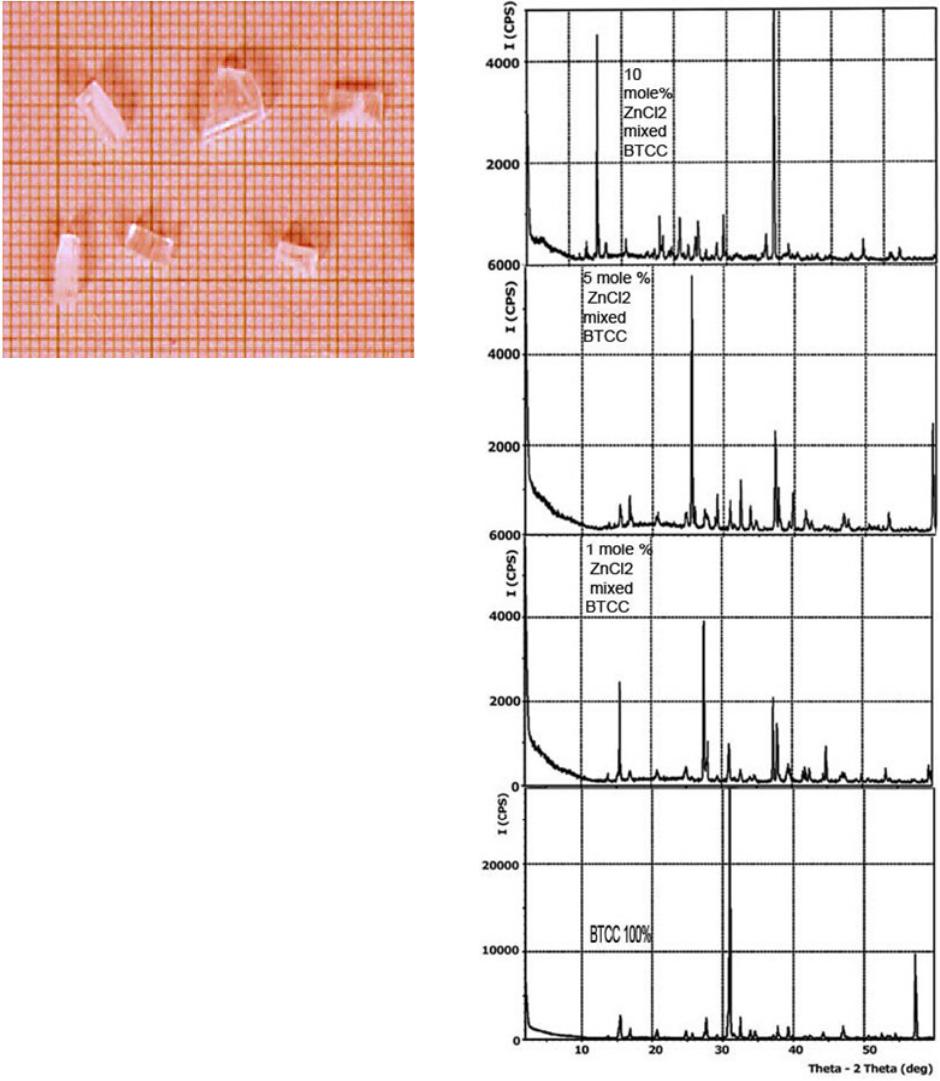
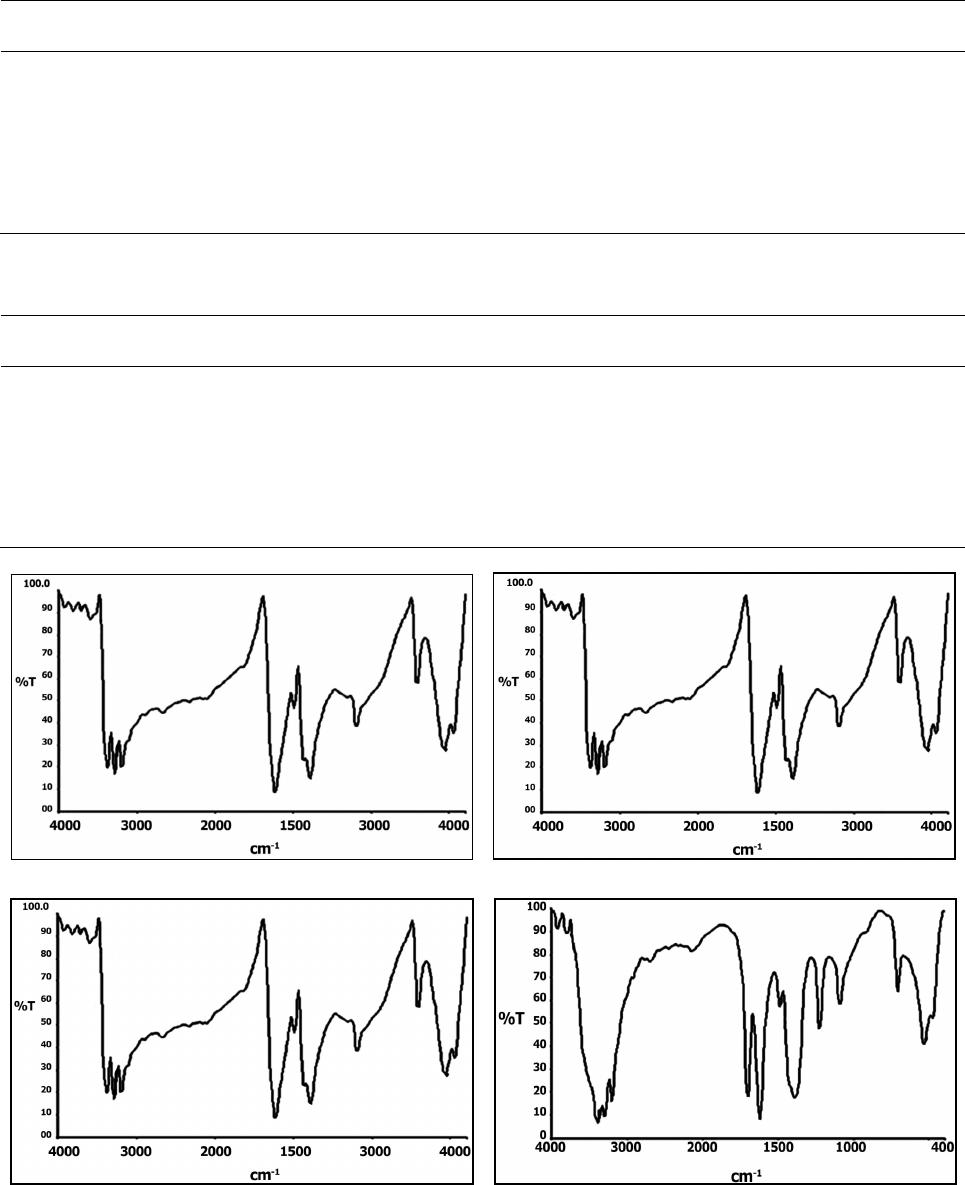
from powder XRD. The presence of functional groups
and the coordination of metal ions to thiourea through
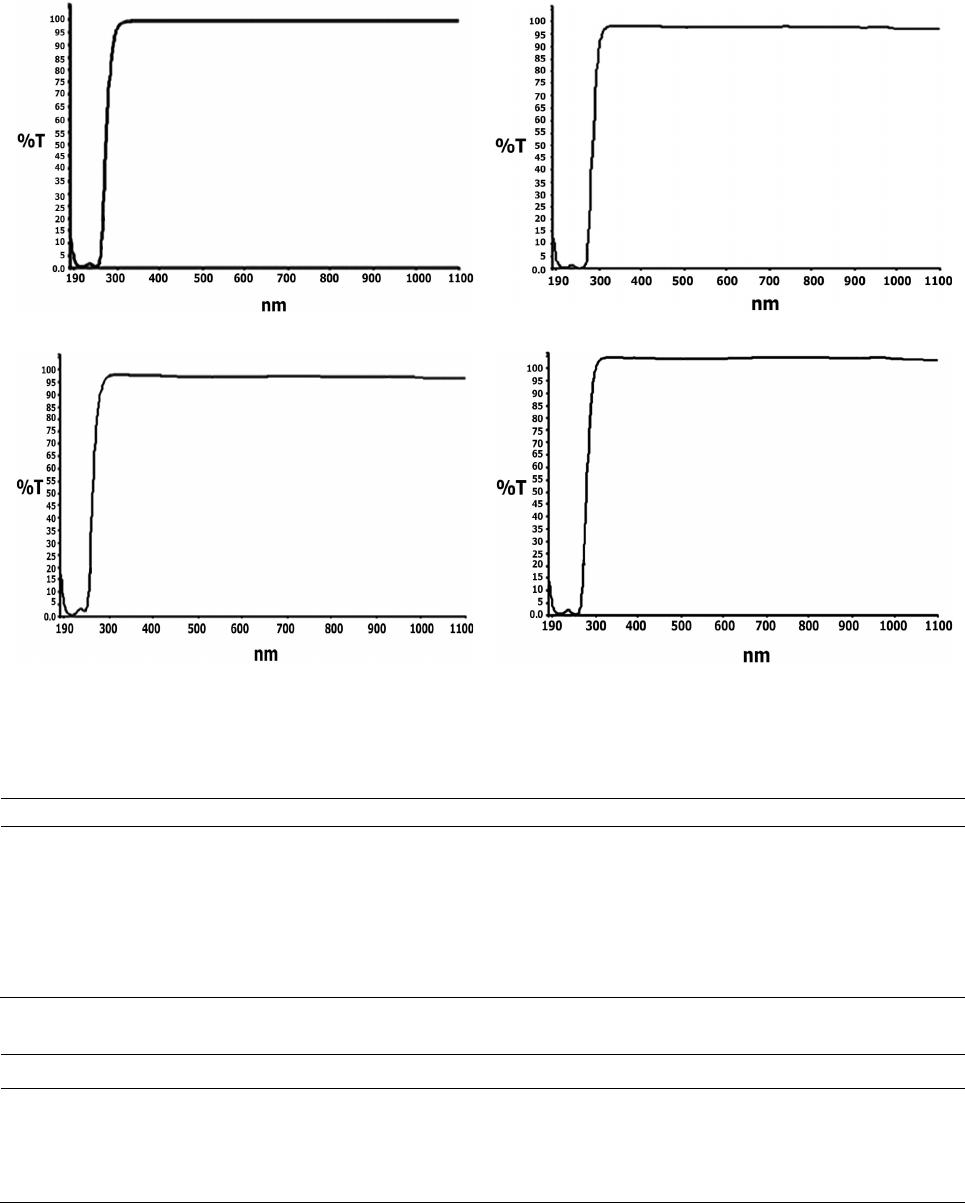
sulphur were conformed by FTIR analysis. The UV-
Vis-NIR analysis reveals that the pure and zinc chloride
mixed BTCC crystals are having good transparency in
the entire visible region. The nonlinear optical (NLO)
efficiency of the pure and zinc chloride mixed BTCC
crystals was determined by the second harmonic genera-
tion studies. The increasing percentage of zinc chloride
in pure BTCC crystals causes a decrease in its nonlinear
optical efficiency. The results of Vicker’s micro hardness
studies reveal that all the experimental crystals have
greater physical strength.
5. Acknowledgements
The authors wish to thank St.Joseph’s College, Trichy-2,
SAIF, IIT Chennai-36, I.I.Sc., Bangalore and Madurai
Kamaraj University, Madurai for the spectral facilities
rendered. One of the authors, Dr. C. Ramachandraraja
wishes to thank UGC, New Delhi, Government of India
for granting a minor research project to carry out this
research work.
REFERENCES
[1] S. Chenthamarai, D. Jayaraman, C. Subramanian and P.
Ramasamy, “Mechanical and Optical Studies on Pure and
Nitro Doped 4-Hydroxyacetophenone,” Materials Letters,
Vol. 47, No. 4-5, 2001, pp. 247-251.
http://dx.doi.org/10.1016/S0167-577X(00)00242-1
[2] K. Ambujam, K. Rajarajan, S. Selvakumar, A. Joseph and
P. Sagayaraj, “Growth and Characterization of a Novel
NLO Crystal Bis-Glycine Hydrogen Chloride (BGHC),”
Journal of Crystal Growth, Vol. 286, No. 2, 2006, pp.
440-444. http://dx.doi.org/10.1016/j.jcrysgro.2005.10.013
[3] S. S. Hussaini, N. R. Dhumane, G. Rabbani, P. Karmuse,
V. G. Dongre and M. D. Shirsat, “Growth and High Fre-
quency Dielectric Study of Pure and Thiourea Doped
KDP Crystals,” Crystal Research and Technology, Vol.
42, No. 11, 2007, pp. 1110-1116.
http://dx.doi.org/10.1002/crat.200710929
[4] S. S. Hussaini, N. R. Dhumane, V. G. Dongre, P. Kar-
muse, P. Ghughare and M. D. Shirsat, “Effect of Glycine
on the Optical Properties of Zinc Thiourea Chloride (ZTC)
Single Crystal,” Optoelectronics and Advanced Materi-
als-Rapid Communications, Vol. 2, 2008, pp. 108-112.
[5] V. Kannan, N. P. Rajesh, R. Bairava Ganesh and P. Ra-
masamy, “Growth and Characterization of Bisthiourea-
Zinc Acetate, a New Nonlinear Optical Material,” Jour-
nal of Crystal Growth, Vol. 269, No. 2-4, 2004, pp. 565-
569. http://dx.doi.org/10.1016/j.jcrysgro.2004.05.051
[6] K. Meera, R. Muralidharan, R. Dhanasekaran, P. Ma-
nyum and P. Ramasamy, “Growth of Nonlinear Optical
Material: L-Arginine Hydrochloride and Its Characterisa-
tion,” Journal of Crystal Growth, Vol. 263, No. 1-4, 2004,
pp. 510-516.
http://dx.doi.org/10.1016/j.jcrysgro.2003.11.093
[7] M.-H. Jiang and Q. Fang, “Organic and Semiorganic
Nonlinear Optical Materials,” Advanced Materials, Vol.
11, No. 13, 1999, pp. 1147-1151.
http://dx.doi.org/10.1002/(SICI)1521-4095(199909)11:13
<1147::AID-ADMA1147>3.0.CO;2-H
[8] J. Ramajothi, S. Dhanushkodi and K. Nagarajan, “Crystal
Growth, Thermal, Optical and Microhardness Studies of
Tris (Thiourea) Zinc Sulphate—A Semiorganic NLO
Material,” Crystal Research and Technology, Vol. 39, No.
5, 2004, pp. 414-420.
http://dx.doi.org/10.1002/crat.200310204
[9] S. Ariponnammal, S. Radhika, R. Selva and N. Victor
Jeya, “High Pressure Electrical Resistivity Study on Non-
linear Single Crystal Zinc Thiourea Sulphate (ZTS),”
Crystal Research and Technology, Vol. 40, No. 8, 2005,
pp. 786-788. http://dx.doi.org/10.1002/crat.200410432
[10] M. J. Rosker, P. Cunningham, M. D. Ewbank, H. O.
Marcy, F. R. Vachss, L. F. Warren, R. Gappinger and R.
Borwick, “Salt-Based Approach for Frequency Conver-
sion Materials,” Pure and Applied Optics, Vol. 5, No. 5,
1996, p. 667.
http://dx.doi.org/10.1088/0963-9659/5/5/020
[11] K. Selvaraju, R. Valluvan, K. Kirubavathi and S. Kuma-
raraman, “L-Cystine Hydrochloride: A Novel Semi-Or-
ganic Nonlinear Optical Material for Optical Devices,”
Optics Communications, Vol. 269, No. 1, 2007, pp. 230-
234. http://dx.doi.org/10.1016/j.optcom.2006.07.075
[12] S. Selvasekarapandian, K. Vivekanandan, P. Kolandaivel
and T. K. Gundurao, “Vibrational Studies of Bis(thiourea)
Cadmium Chloride and Tris(thiourea) Zinc Sulphate
Semiorganic Non-Linear Optical Crystals,” Crystal Re-
search and Technology, Vol. 32, No. 2, 19997, pp. 299-
309.
[13] S. K. Kurtz and T. T. Perry, “A Powder Technique for the
Evaluation of Nonlinear Optical Materials,” Journal of
Applied Physics, Vol. 39, No. 8, 1968, p. 3798.
http://dx.doi.org/10.1063/1.1656857
[14] R. Mohankumar, D. Rajanbabu, D. Jayaraman, R. Jayavel
and K. Kitamura, “Studies on the Growth Aspects of Semi-
Organic l-Alanine Acetate: A Promising NLO Crystal,”
Journal of Crystal Growth, Vol. 275, 2005, pp. 1935-
1939.
Open Access JMMCE