Journal of Intelligent Learning Systems and Applications
Vol.4 No.3(2012), Article ID:22028,11 pages DOI:10.4236/jilsa.2012.43019
Using Genetic Algorithm for Identification of Diabetic Retinal Exudates in Digital Color Images
![]()
Department of Science and Mathematics, Faculty of Education, Assiut University, Assiut, Egypt.
Email: romanyf@aun.edu.eg
Received October 2nd, 2011; revised April 13th, 2012; accepted April 21st, 2012
Keywords: Diabetic Retinal; Genetic Algorithm; Chain Code; Vessel Detection; Fundus Image
ABSTRACT
Blood vessels in ophthalmoscope images play an important role in diagnosis of some serious pathology on retinal images. Hence, accurate extraction of vessels is becoming a main topic of this research area. In this paper, a new hybrid approach called the (Genetic algorithm and vertex chain code) for blood vessel detection. And this method uses geometrical parameters of retinal vascular tree for diagnosing of hypertension and identified retinal exudates automatically from color retinal images. The skeletons of the segmented trees are produced by thinning. Three types of landmarks in the skeleton must be detected: terminal points, bifurcation and crossing points, these points are labeled and stored as a chain code. Results of the proposed system can achieve a diagnostic accuracy with 96.0% sensitivity and 98.4% specificity for the identification of images containing any evidence of retinopathy.
1. Introduction
The eye is an organ associated with vision. The eye is housed in a socket of bone called the orbit and is protected from the external air by the eyelids [1]. A cross section of the eye is shown in Figure 1. Light entering the eye through the pupil is focused on the retina. The retina is a multi-layered sensory tissue that lines the back of the eye. It contains millions of photoreceptors that capture light rays and convert them into electrical impulses [2]. These impulses travel along the optic nerve to the brain where they are turned into images. In a normal FI, the optic disk is brighter than any part of the retina and is normally circular in shape. It is also the entry and exit point for nerves entering and leaving the retina to and from the brain. A typical retina fundus image looks like the one shown in Figure 2. The bright optic disc and the vascular network can clearly be seen in the image.
Neovascularization can be described as the abnormal growth of blood vessels in some areas of the eye including the retina [3,4]. This occurs in response to ischemia, or diminished blood flow to ocular tissues. These new blood vessels have weaker walls and can rupture which subsequently leads to bleeding or causes scar tissue growth. An increase in the number of such veins can lead to lifting the retina away from the back of the eye. When the retina is lifted away, this is called retinal detachment. If left untreated, this can cause severe vision loss, including blindness [1]. Neovascularization and bleeding in FIs are associated with bifurcation point (BP) and crossover point (CP) changes [3-5]. We proposed a new technique which is named the Genetic Algorithm and Vertex Chain Code to detected cross-point number method (GAVCC) that can be used for vascular bifurcation and intersection detection. The fundus image undergoes preprocessing and segmentation before the GAVCC technique is applied during the last stage which is named the bifurcation and intersection detection stage. The preprocessing involves color space conversion, noise removal, and illumination equalization.
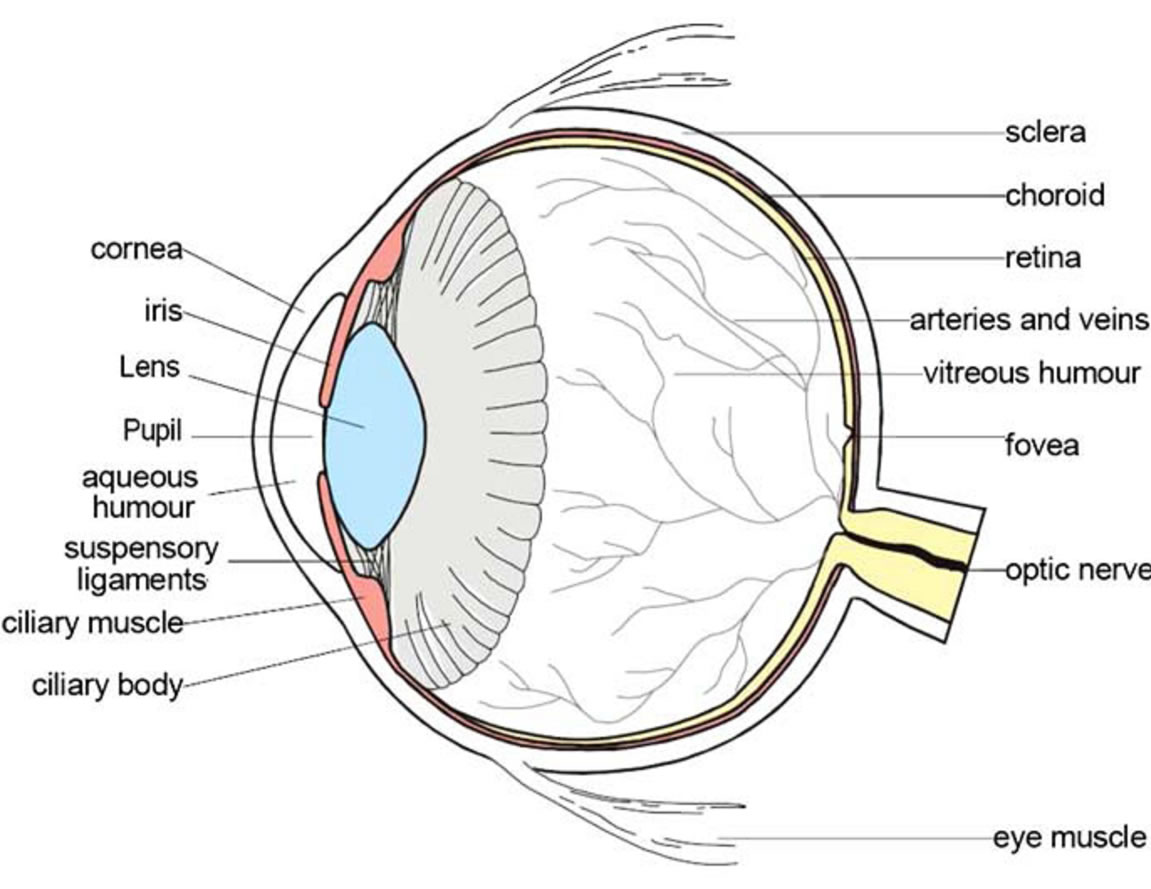
Figure1. Cross sectional diagram of human eye [1].
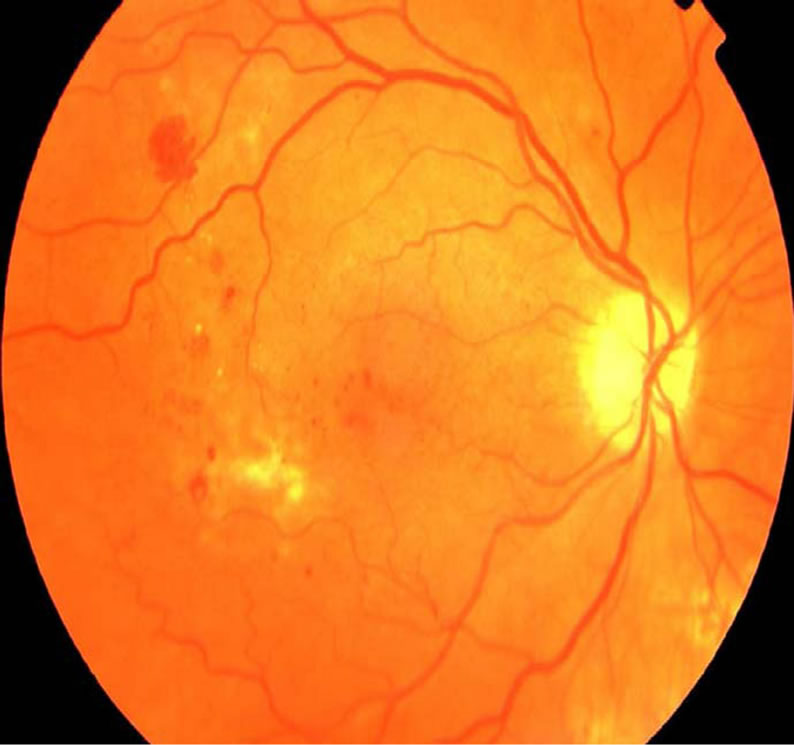
Figure 2. Retinal fundus image.
The segmentation stage separates the background from the vascular network using the skeletons algorithm. During the bifurcation and intersection detection stage, as the name suggests, vascular bifurcation and crossover points are detected by applying the GAVCC technique. In addition, we compared this method with others techniques and analyzed by applying them to more images taken from two FI databases. The results of all the techniques have been analyzed and compared with each other.
2. Related Work
The eye is a window to the retinal vascular system which is uniquely accessible for the non-invasive, in vivo study of a continuous vascular bed in humans. The detection and measurement of blood vessels can be used to quantify the severity of disease, as part of the process of automated diagnosis of disease or in the assessment of the effect of therapy. Retinal blood vessels have been shown to change in diameter, branching angles or tortuosity, as a result of a disease, such as hypertension [6], diabetes mellitus or retinopathy of prematurity (ROP) [7].
Furthermore, retinal arteriolar or venular changes predict development of hypertension [6,8], new onset diabetes [6], progression to diabetic retinopathy [9] and development of diabetic renal disease [10]. Thus a reliable method of vessel segmentation would be valuable for the early detection and characterization of morphological changes.
A first approximation to the segmentation of retinal blood vessel using this approach was previously presented [11], where segmentation method was tested on a small image sample without any validation. An extension of this work is presented here and the method is now tested on two local databases and two public databases of complete manually labeled images [12,13]. We evaluate our segmentation using the public databases that have been also used by other authors for the same purpose [13,14]. Validation of segmented vessel diameters and branching angles measurements are also made: between red-free against fluoresce in images and between our algorithm and one of the public databases.
This paper is organized as follows: Section 2 presents some of the reported work in relation to this research; Sections 3 and 4 present a vertex chain code method to extraction the features of retina; In Section 5 applied genetic Algorithm to archival the accuracy and all the stages that an image has to go through to allow bifurcation and intersection detection are discussed. The proposed technique for bifurcation and crossover detection is introduced briefly; and Section 6 presents results obtained from experiments on FIs.
3. Proposed Method
A three-stage framework is used for detecting BPs and CPs from FIs. The stages involved are: preprocessing followed by segmentation, and finally detection of bifurcations and crossovers. The fundus images which have been collected for different hypertension and DR patients are not of good quality and are badly or unevenly illuminated. The main reasons why these images are of bad quality are poor lighting conditions and motion of the eye or the camera during photography. Also, the fundus images may be of different sizes, color resolutions (gray scale as well as color images) and different formats, etc.
3.1. Fundus Image Enhancement
The quality of the blood vessels structures in a retinal image is an important characteristic, as the ridges carry the information of characteristic features required for minutiae extraction.
The morphology of the retinal blood vessels can be an important indicator for diseases like diabetes, hypertension and retinopathy of prematurely (ROP). Thus, the measurement of changes in morphology of arterioles and venules can be of diagnostic value. Here we present a method to automatically segment retinal blood vessels based upon multiscale feature extraction. This method overcomes the problem of variations in contrast inherent in these images of the magnitude of the gradient and the maximum by using the first and second spatial derivatives of the intensity image that gives information about vessel topology.
This approach also enables the detection of blood vessels of different widths, lengths and orientations. The local maxima over scales principal curvature of the Hessian tensor are used in a multiple pass region growing procedure. The growth progressively segments the blood vessels using feature information together with spatial information. The algorithm is tested on red-free and fluoresces in retinal images, taken from two local and two public databases.
3.2. Segmentation
The first step of the retinal blood vessels enhancement algorithm is image segmentation. Segmentation is the process of separating the foreground regions in the image from the background regions. The foreground regions correspond to the clear retina area containing the vessels, which is the area of interest. The background corresponds to the regions outside the borders of the retina area, which do not contain any valid information. When minutiae extraction algorithms are applied to the background regions of an image, it results in the extraction of noisy and false minutiae. Thus, segmentation is employed to discard these background regions, which facilitates the reliable extraction of minutiae.
In a retina image, the background regions generally exhibit a very low grey-scale variance value, whereas the foreground regions have a very high variance. Hence, a method Directional Fourier Filtering (DFF) based on variance threshold can be used to perform the segmentation. Firstly, the image is divided into blocks and the grey-scale variance is calculated for each block in the image. If the variance is less than the global threshold, then the block is assigned to be a background region; otherwise, it is assigned to be part of the foreground. The grey-level variance for a block of size WxW is defined as:
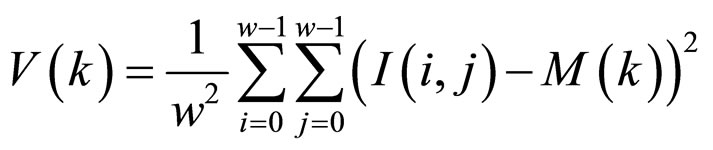
where V(k) is the variance for block k, I(i, j) is the grey-level value at pixel (i, j), and M(k) is the mean grey-level value for the block k.
3.3. Normalization
The next step in the retinal blood vessels enhancement process is image normalization. Normalization is used to standardize the intensity values in an image by adjusting the range of grey-level values so that it lies within a desired range of values. Let I(i, j) represent the grey-level value at pixel (i, j), and N(i, j) represent the normalized grey-level value at pixel (i, j). The normalized image is defined as:
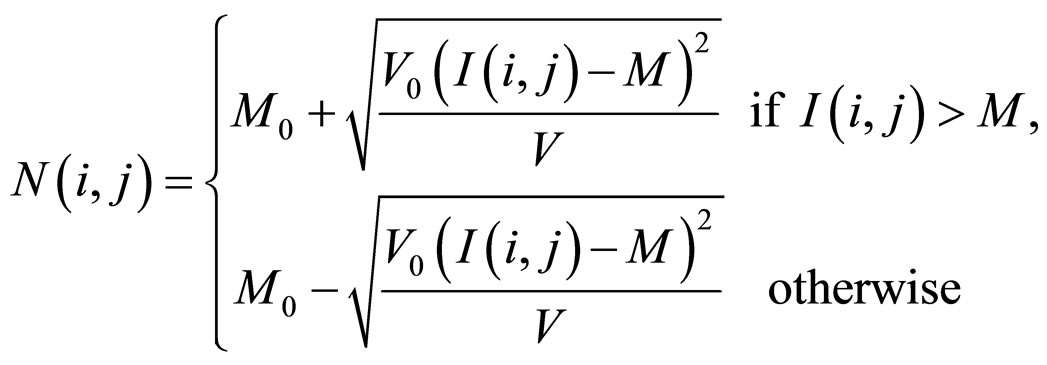
where M and V are the estimated mean and variance of I(i, j) respectively, and M0 and V0 are the desired mean and variance values, respectively. Normalization does not change the vessels structures in retinal; it is performed to standardize the dynamic levels of variation in grey-level values, which facilitates the processing of subsequent image enhancement stages.
3.4. Binarization
Most minutiae extraction algorithms operate on binary images where there are only two levels of interest: the black pixels that represent ridges, and the white pixels that represent valleys. Binarization is the process that converts a grey level image into a binary image. This improves the contrast between the ridges and valleys in a fingerprint image, and consequently facilitates the extraction of minutiae.
3.5. Thinning
The final image enhancement step typically performed prior to minutiae extraction is thinning. Thinning is a morphological operation that successively erodes away the foreground pixels until they are one pixel wide. A standard thinning algorithm [15] is employed, which performs the thinning operation using two sub iterations.
This algorithm is accessible in MATLAB via the “thin” operation under the bimorph function. Each subiteration begins by examining the neighborhood of each pixel in the binary image, and based on a particular set of pixel-deletion criteria, it checks whether the pixel can be deleted or not. These subiterations continue until no more pixels can be deleted. The application of the thinning algorithm to a retinal image preserves the connectivity of the ridge structures while forming a skeletonised version of the binary image. This skeleton image is then used in the subsequent extraction of minutiae.
The skeleton of the vascular tree is obtained from the segmented binary image by a thinning process where pixels are eliminated from the boundaries toward the center without destroying connectivity in an eight connected scheme [16]. A pruning process is applied to eliminate short, false spurs, due to small undulations in the vessel boundary. False spurs are deleted if they are smaller or equal to the largest vessel diameter expected in a particular image. Figure 3 shows the stages of the segmentation method. The extraction of minutiae from a skeleton image will be discussed in the next section.
4. Feature Extraction Using VCC Contours
The most commonly employed method of feature extraction is the Crossing Number (CN), with comparison with other methods which based on Fourier transform of retinal images and Two-dimensional Wavelet Transform [17] more efficient. The concept this method involves the use of the skeleton image where the ridge flow pattern is eight-connected.
The landmarks are extracted by scanning the local neighborhood of each ridge pixel in the image using a 3 × 3 window. The CN value is then computed, which is defined as half the sum of the differences between pairs of adjacent pixels in the eight-neighborhoods. Using the
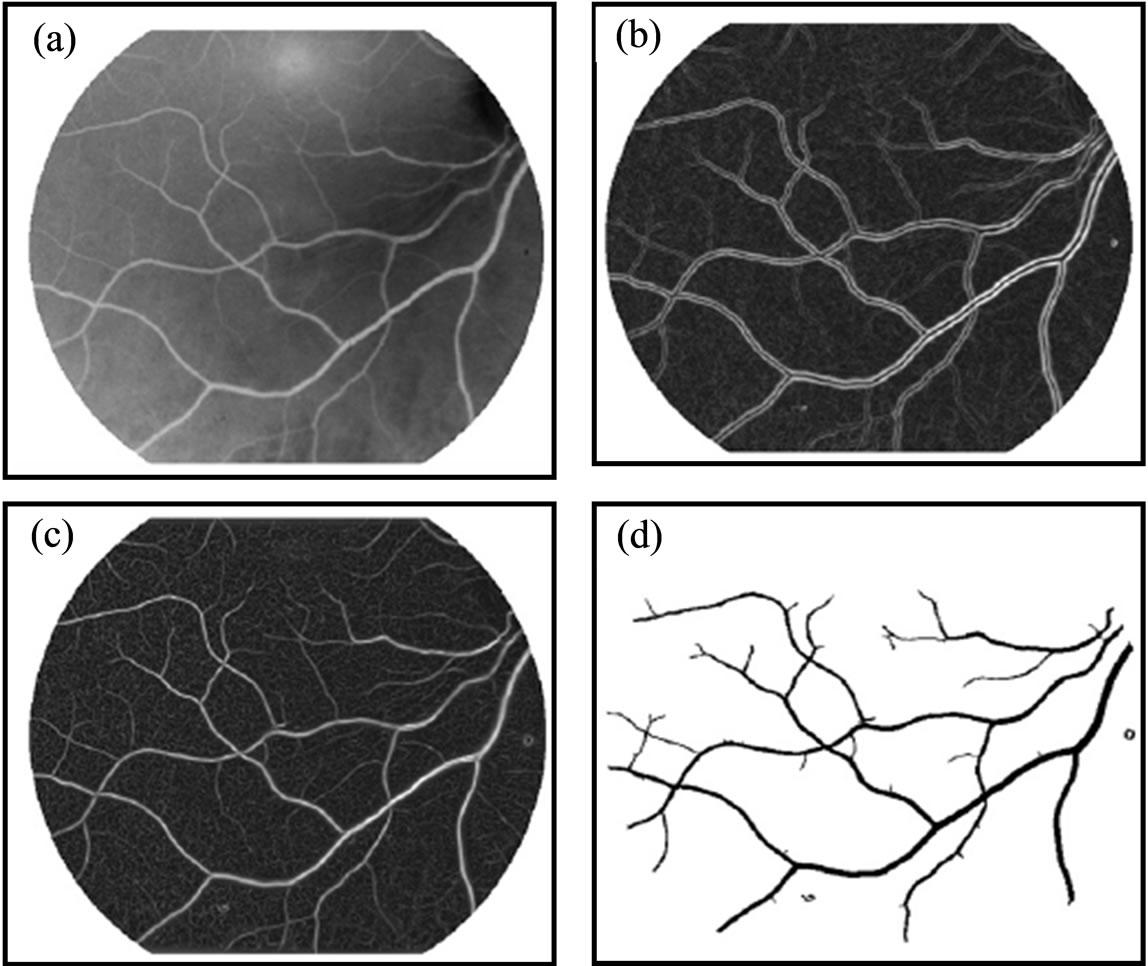
Figure 3. The segmentation method and enhancement (a) Original image; (b) Enhanced image; (c) Binary image; (d) Thinned and separated vassals image.
properties of the CN, shown in Table 1, the ridge pixel can then be classified as a ridge ending, bifurcation or non-minutiae point. For example, a vascular pixel with a CN of one corresponds to a ridge ending, and a CN of three corresponds to a bifurcation.
We propose a new feature extraction algorithm based on chain code contour following. Chain codes have been used in computer vision to describe the shapes of object boundaries (see Figure 4). Chain codes are translation invariant and can be made rotation invariant if we use relative directions. This is one of the primary reasons why it is used for object recognition applications in machine vision. However, we are interested in this representation since it provides us with a loss-less representation of ridge contours at the same time yielding a wide range of information about the contour such as curvature, direction, length etc. [18]. The chain code representation has several advantages mentioned below.
(1) By directly processing the contour we obviate the need for thinning the binary image. This reduces the computational complexity of the feature extraction process.
(2) Several post processing steps previously used to eliminate spurious features can now be integrated into the contour processing stage. For instance, holes within the ridges can be filled by considering only exterior contours. Also small artifacts can be easily removed by neglecting contours whose length is beneath a pre-defined threshold.
(3) Detecting minutiae becomes very straightforward as will be seen in the following sections.
Most retina minutia extraction methods are thinningbased where the skeletonization process converts each ridge to one pixel wide. Minutia points are detected by locating the end points and bifurcation points on the thinned ridge skeleton based on the number of neighboring pixels. The end points are selected if they have a single neighbor and the bifurcation points are selected if they have more than two neighbors. However, methods based on thinning are sensitive to noise and the skeleton structure does not conform to intuitive expectation. Our chain code based method is obtained by scanning the image from top to bottom and right to left. The transitions from white (background) to black (foreground) are detected.
The contour is then traced counterclockwise and expressed as an array of contour elements. Each contour element represents a pixel on the contour. It contains fields for the x, y coordinates of the pixel, the slope or direction of the contour into the pixel, and auxiliary
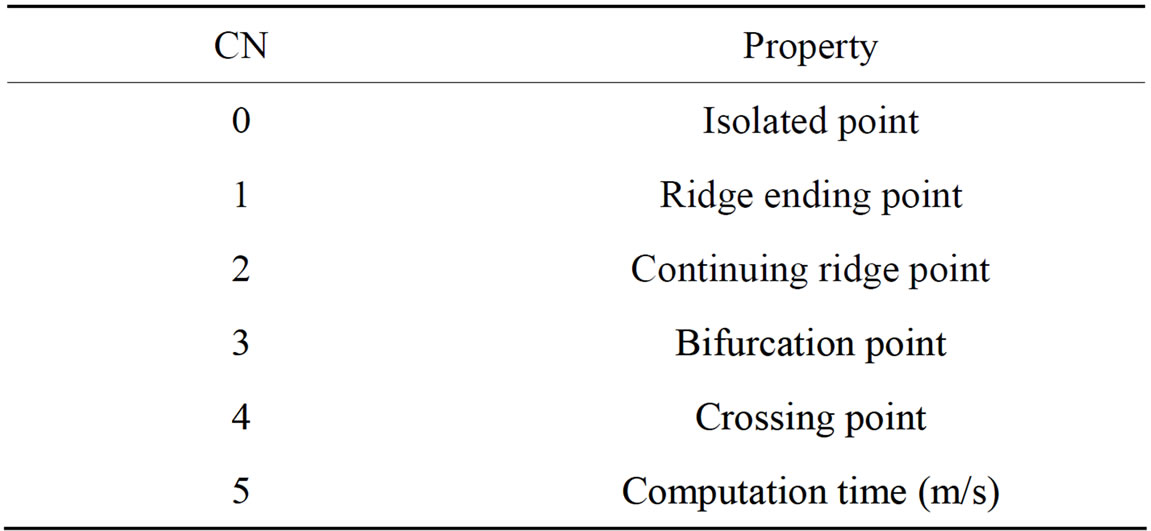
Table 1. Properties of the crossing number.
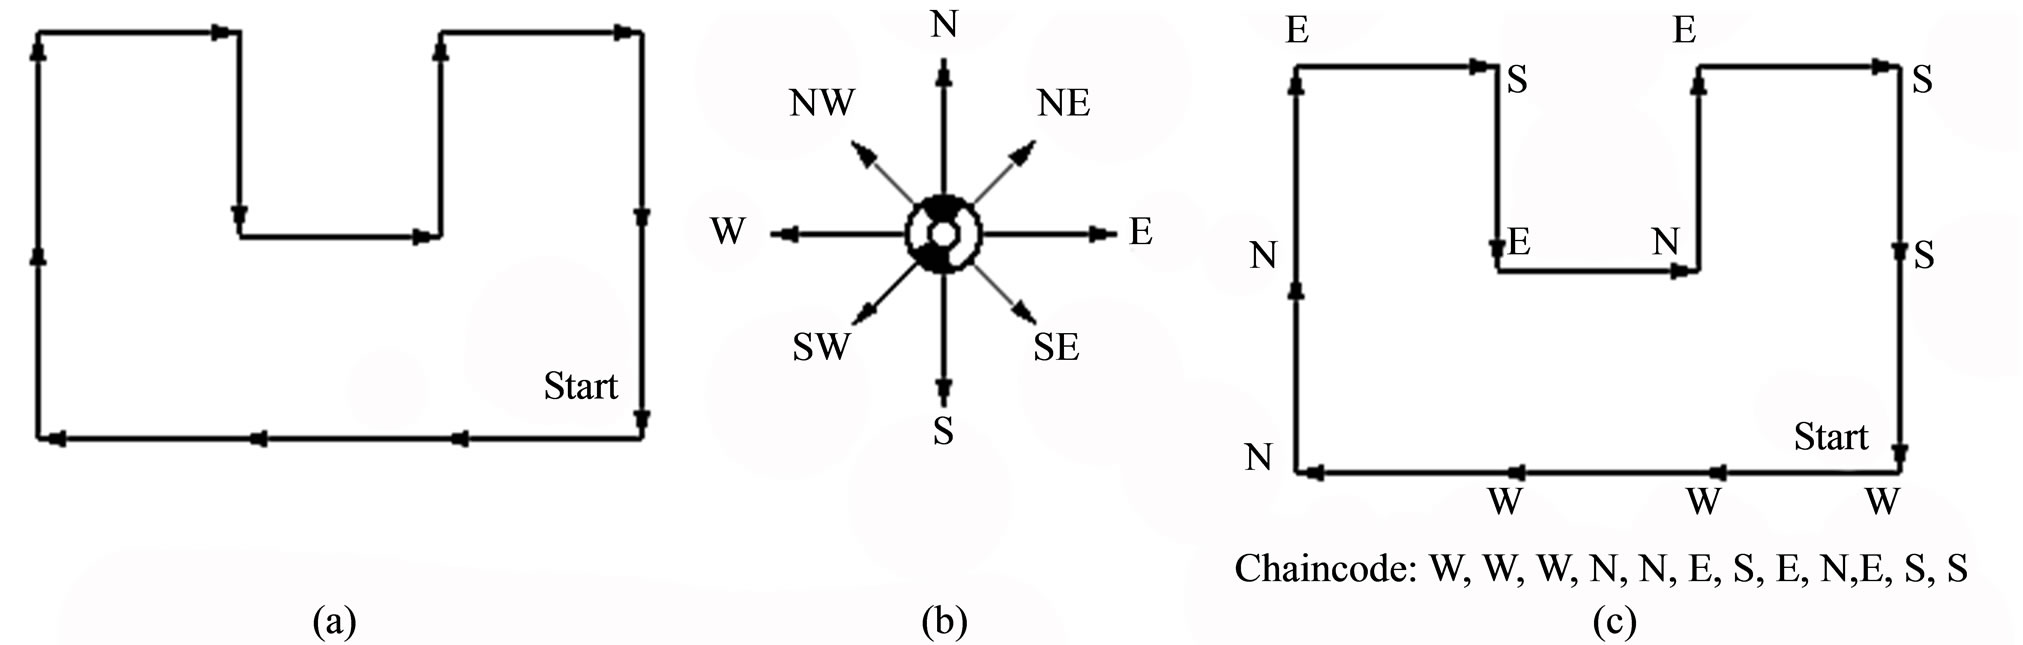
Figure 4. Chain code contour representation: (a) An example of an object boundary; (b) Direction convention used for chain code representation; (c) Resulting chain code representation.
information such as curvature. In a binary fingerprint image, ridge lines are more than one pixel wide. Tracing a ridge line along its boundary in counterclockwise direction, a termination minutia (ridge ending) is detected when the trace makes a significant left turn. Similarly, a bifurcation minutia (a fork) is detected when the trace makes a significant right turn (Figure 5(a)).
Figure 6(a) shows the candidate points marked with circles over the skeleton and Figure 6(b) summarizes the three possible cases; where two intersections with the window are spurs, three intersections are bifurcation points and four intersections are crossing points.
Once all of the landmarks are identified, bifurcation points are labeled as –r, where r is the radius of the maximum circle centered on that point that fits inside the boundary of the bifurcation Figure 7. The sign is used to distinguish between the radius and chain code numbers that are described in the following section. For crossing points, the skeleton is corrected and marked to define a single crossing point see the last row of Figure 6(b). Figure 7 shows the corrected skeleton with all of the landmarks marked. Until this stage the process is fully automatic. The process fails when:
(1) Two true bifurcation points are very close and are merged into a crossing point.
(2) Or when the two candidate bifurcation points fall outside the circular window and are, thus, defined as two bifurcation points.
An example is shown in the top-left corner in Figure 7(a) where two branching points are found, an inspection of the full image shows that it should be a crossing point. These cases must be corrected manually the complete image is labeled in this way and it normally contains several independent vascular trees.
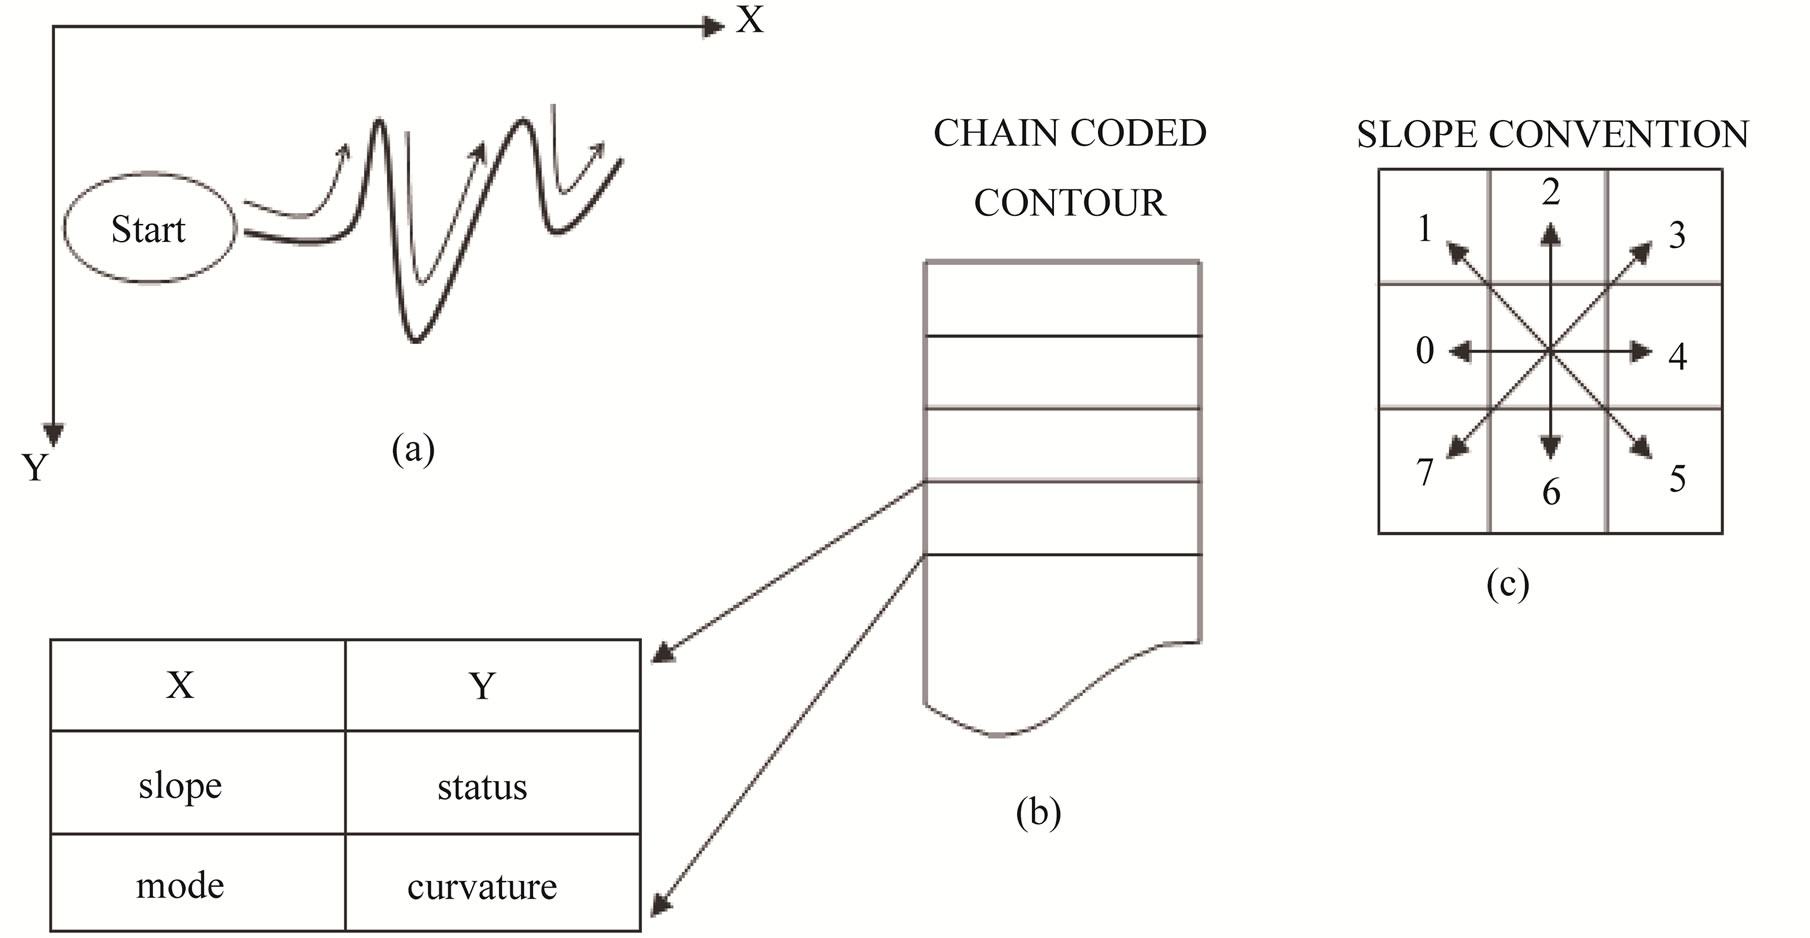
Figure 5. Chain code contour representation: (a) The contour is extracted by tracing the ridge boundaries in a counter clockwise direction. Each contour element along with its co-ordinates, curvature slope and other information is stored in a list; (b) The slope convention.
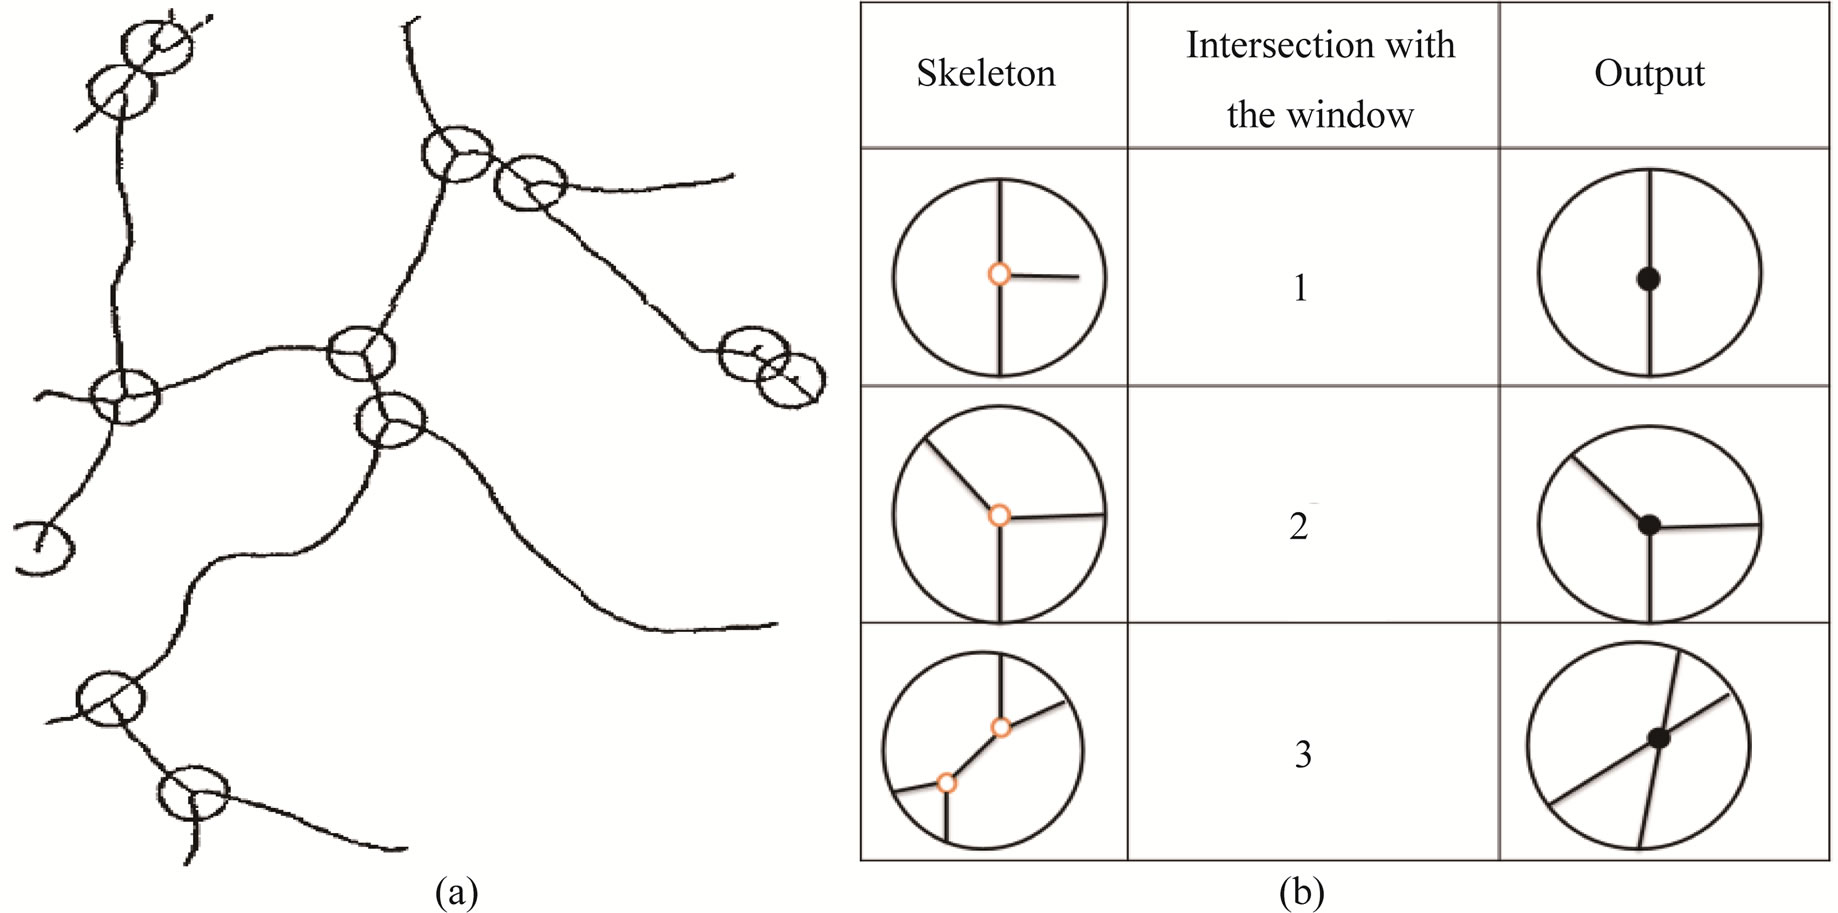
Figure 6. (a) Candidate points marked with circles over the skeleton; (b) Types of landmarks.
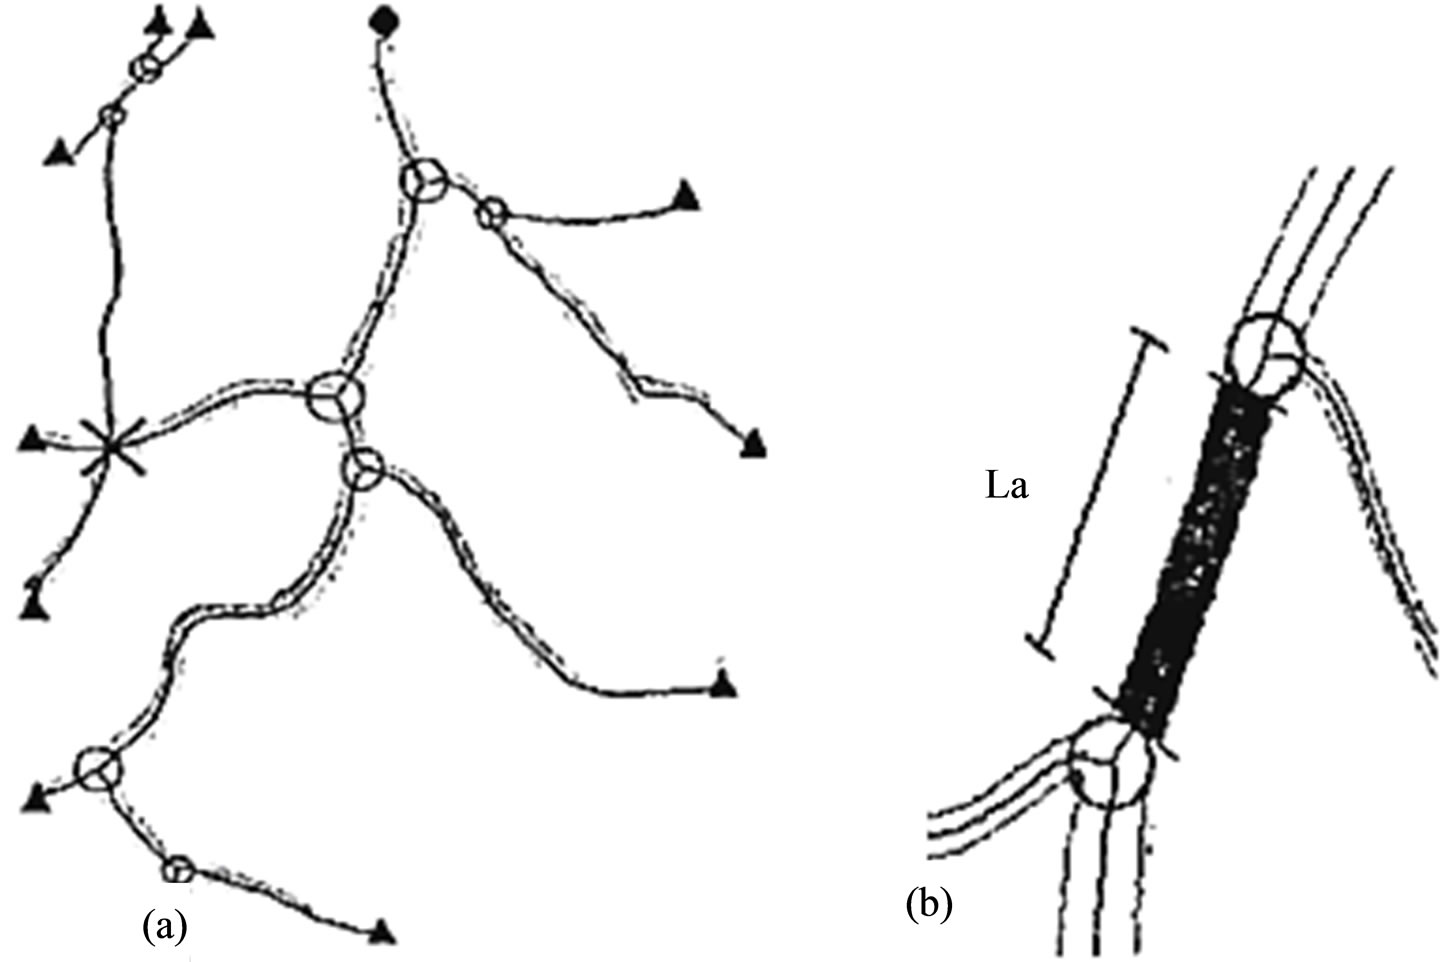
Figure 7. (a) Corrected skeleton with landmarks marked: Bifurcation points are marked with the maximum circle that fits inside the vessel boundaries, terminal points with triangle, crossing points with crosses, and the root point with a black circle; (b) The area A is the number of vessel pixels bounded by the two lines tangents to the circles and perpendicular to the skeleton and La is the true length of the of the skeleton.
Figure 8(a) shows the chain code directions in a 3 × 3 neighborhood. When the first bifurcation point is reached the chain of the current branch is ended and the coordinates of the starting points of the two daughters are found and saved. In order to keep the network information about the relationships between branches along the tree, a binary ordering scheme is adopted by labeling the root as one and, thereafter, the daughters of parent k0 are labeled with key numbers
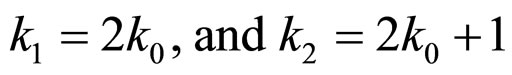
Figure 8(b) shows the numbering scheme used. With this numbering scheme we able to track the tree in either direction. Figure 9" target="_self"> Figure 9 shows the final steps to extraction features and superimposed on the original image.
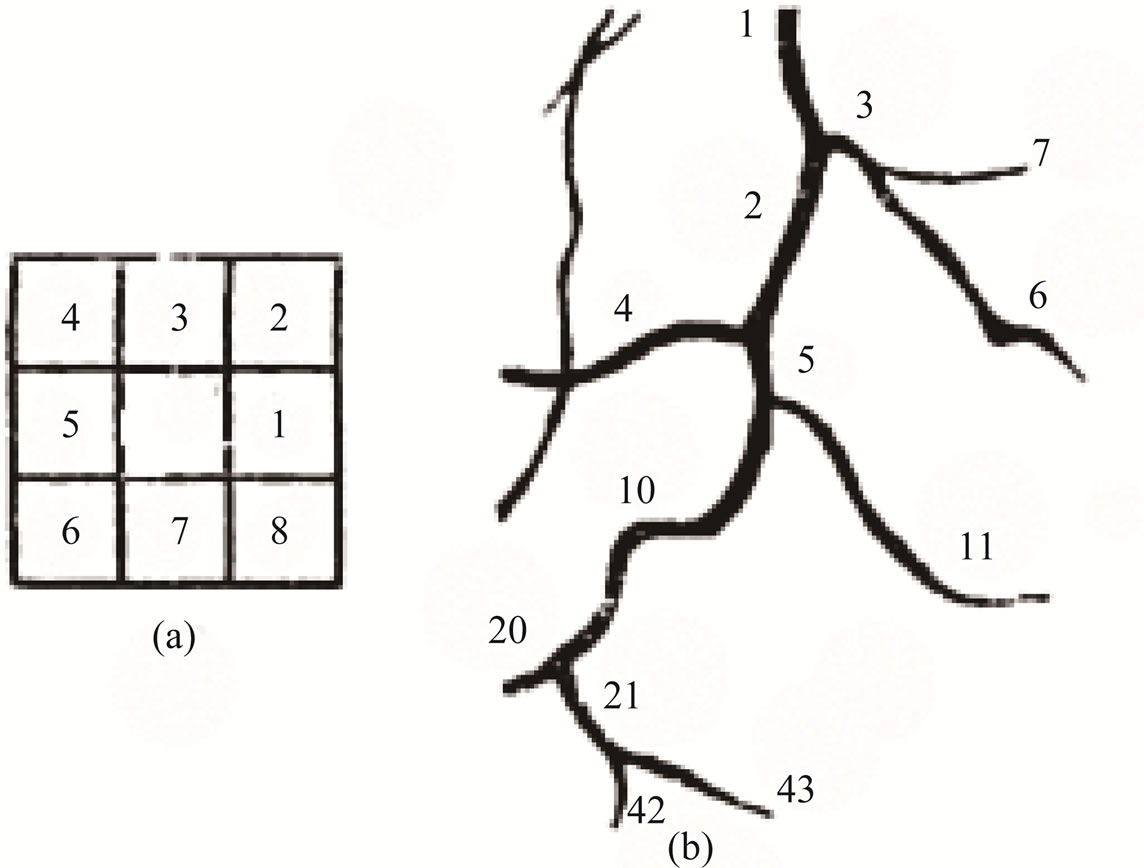
Figure 8. (a) The chain code direction in a 3 × 3 neighborhood; (b) The root is labeled 1 and thereafter the daughters of parent k0 are labeled k1 and k2.
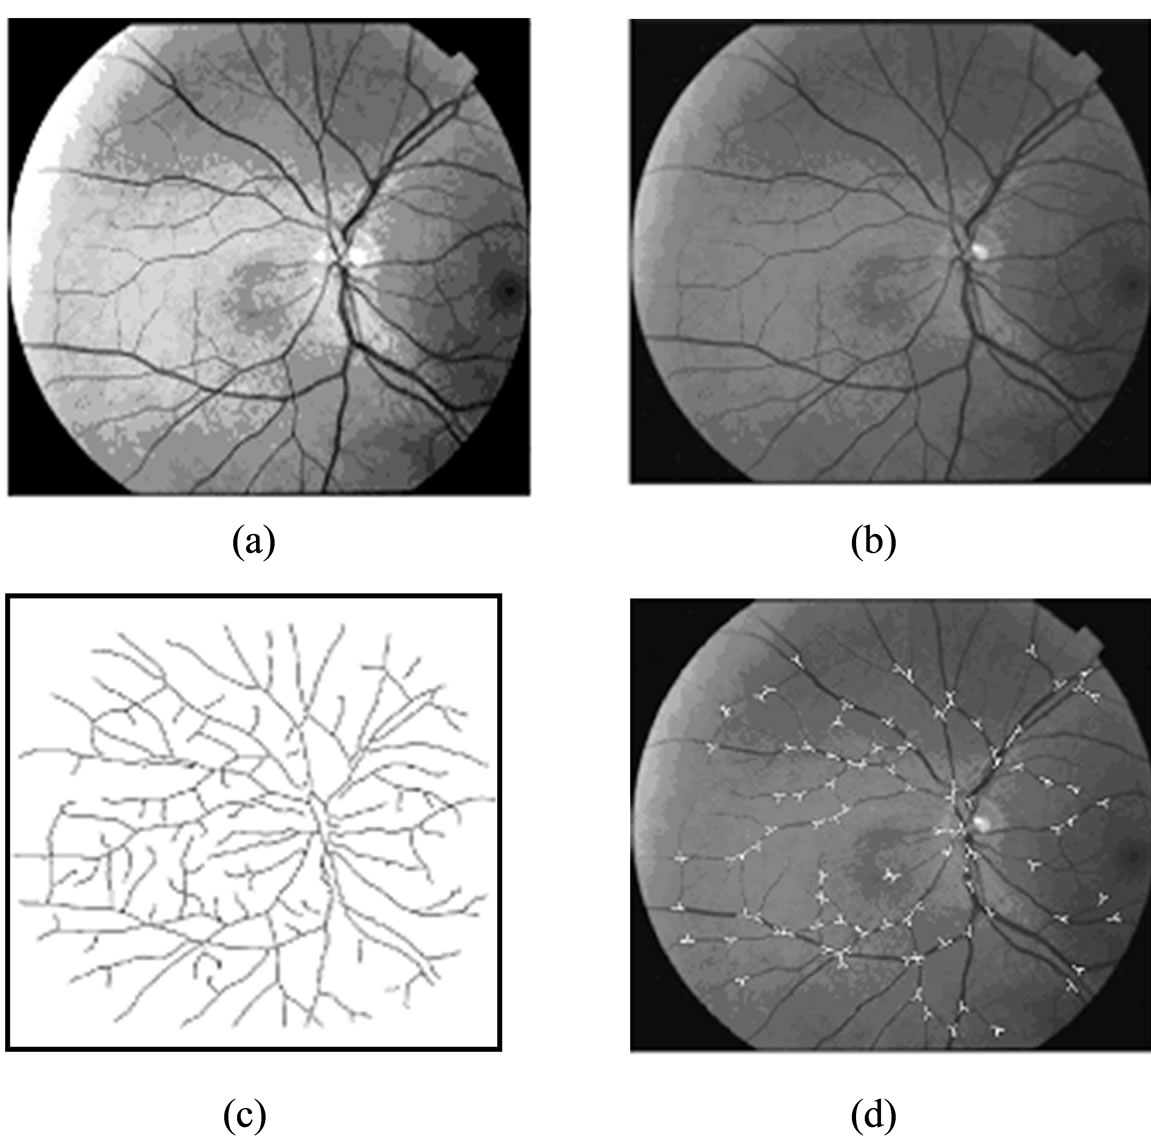
Figure 9. Illustrating the recursive tracing of the vessels and feature extraction of vessels: (a) Original image; (b) Enhancement image; (c) The segmented binary image; and (d) The detected landmarks and superimposed on the original image.
5. Genetic Algorithms
Genetic algorithms form an effective solution for optimization problems [19] and they can be considered as probabilistic search algorithms [20]. Genetic optimizations are used to improve the performance of the matched filter by finding better parameters. Initially, we will briefly discuss the main concept for genetic algorithms, and then the optimization of the matched filter using genetic algorithms will be illustrated. Genetic algorithms operate on a set of individuals called population, where each individual is an encoding of the problem’s input data and are called chromosomes. Each individual’s fitness is calculated using an objective function. In genetic algorithms terminology, each iteration of the search is called a generation. From each generation the fittest individuals are selected and pooled out to form a base for a new population with better characteristics. Genetic algorithms are characterized by attributes such as objective function, encoding of the input data, crossover, mutation, and population size. Below is a brief description of some of the attributes [20].
(1) Objective function. It is used to assign each individual in the population a fitness value; an individual with a higher fitness represents a better solution to the problem than an individual with a lower fitness value;
(2) Encoding. Genetic algorithms operate on an encoding of the problem’s input data (which represent independent variables for the objective function);
(3) Elitism. This is a way to ensure that the highly fitting chromosomes are not lost and copied to the new population. Elitism has been found to be very important to the performance of genetic algorithms;
(4) Crossover. It is a procedure in which a highly fitting chromosome is given an opportunity to reproduce by exchanging pieces of its genetic information with other highly fitting chromosomes;
(5) Mutation. This is often applied after crossover by randomly altering some genes to individual parents;
(6) Population size. It is the number of individuals in a population. The larger the population size, the better the chance that an optimal solution will be found.
Genetic algorithms iterate a fixed number of times. Since the function’s upper bound (the maximum fitness value possible for an individual) may not be known or cannot be reached, we must limit the number of generations in order to guarantee the termination of the search process. This may result in a suboptimal solution. In the next section, we explain how genetic algorithms find the best parameter for the matched filter as proposed in this work.
5.1. Genetic Operators
Our implementation uses three genetic operators: selection, crossover and mutation. For the selection operator we have used a roulette wheel implementation. In this method, each individual is assigned a slice in the roulette wheel. The size of the slice is proportional to its normalized fitness value. This selection strategy favors best fitted individuals but it gives a chance to the less fitted individuals to survive. A steady state policy is also used, this implies to have elite individuals that will be kept in the next population. For the crossover operator, we have used a 1-point crossover implementation. This method uses a crossover probability value to determine where we will divide the genetic material of the two parents to recombine into a new individual. A bit mutation operator is used in our implementation. In this method, a bit is inverted or not depending on a mutation probability. GA parameters were configured as shown in Table 2.
5.2. The Overall Genetic Algorithm
After the definitions of the fitness function, the threshold value, and the genetic algorithm operators, we can write the genetic algorithm as the following algorithm:
(1) Randomly generate the initial populations of P chromosomes;
(2) Evaluate the fitness values of all chromosomes and copy the best chromosome Sb of the initial population in a separate location;
(3) Apply the reproduction, crossover, and mutation operators to generate the next population;
(4) Evaluate the fitness values of all chromosomes in the current population;
(5) Compare the best chromosome Sc of the current population with Sb. If Sc has a higher fitness value, then substitute Sb with Sc;
(6) Replace the worst chromosome Sw of the current population by Sb;
(7) Go to Step 3 until there are G generations;
(8) If the fitness value of the best chromosome is greater than the threshold τ, store the parameters of the chromosome;
(9) Repeat the previous steps n times;
(10) Compute the value of Lt.
5.3. The Immune-Genetic Algorithm
The Immune-Genetic Algorithm (IGA) is an improved genetic algorithm based on biological immune mechanisms. In the course of immune response, biological immune system preserves part of the antibodies as memory cells. When the same antigen invades again, memory cells are activated and a large number of antibodies are generated so that the secondary immune response is more quickly than the initial response. In the meanwhile, there
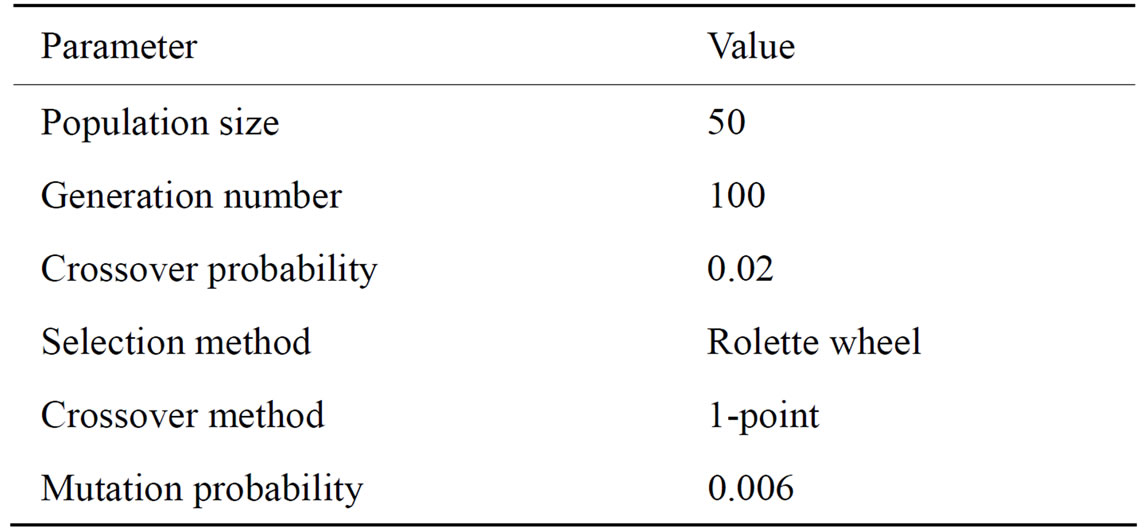
Table 2. List of parameters for the genetic algorithms.
are mutual promotion and inhibition between antibodies. Therefore, the diversity and immune balance of the antibodies are maintained. That is the self-regulatory function of the immune system. The Immune-Genetic Algorithm simulates the process of adaptive regulation of biological antibody concentration, in which the optimal solution of the objective function corresponds to the invading antigens and the fitness f(Xi) of solution Xi corresponds to the antibodies produced by the immune system. According to the direction of solutions and greatly enhances the ability to overcome the local convergence. In general, the Immune-Genetic Algorithm includes:
(1) Antigens definition: Abstract the problem to the form of antigens which the immune system deals with and the antigen recognition to the solution of problem;
(2) Initial antibody population generation: The antibody population is defined as the solution of the problem. The affinity between antibody and antigen corresponds to the evaluation of solution, the higher the affinity, the better the solution;
(3) Calculation of affinity: Calculate the affinity between antigen and antibody;
(4) Various immune operations: The immune operations include selection, clone variation, auto-body tolerance, antibody supplementation and so on. The affinity and diversity are usually considered to be the guidance of these immune operations. Among them, select Options usually refer to the antibody poputlation selected from the population into the next operation or into the next generation of the immune antibody population. Clone variation is usually the main way of artificial immune algorithm to generate new antibodies. Auto-body tolerance is the process of judging the rationality of the presence of the antibodies. Antibody supplementation is the accessorial means of population recruitment;
(5) Evaluation of new antibody population: If the termination conditions are not satisfied, the affinity is recalculated and the algorithm restarts from the beginning. If the termination conditions are satisfied, the current antibody population is the optimal solution;
(6) Evolution of the antibody using standard Genetic Algorithm: Crossover and mutation.
This model makes the immune system learn to identify the antibodies that are helpful to the antigen recognition. Moreover, the introduction of fitness further improves the immunogenicity, ensuring the diversity of antibody population in Genetic Algorithm. Immune-Genetic Algorithm introduces the “immune operator”, genes inoculation and selection, and simulates the specific auto-adaption and artificial immune of the artificial immune system, possessing good properties of fast global convergence. The specific workflow of Immune-Genetic Algorithm is described in Figure 10.
Step 1. Randomly generate μ individuals of parent
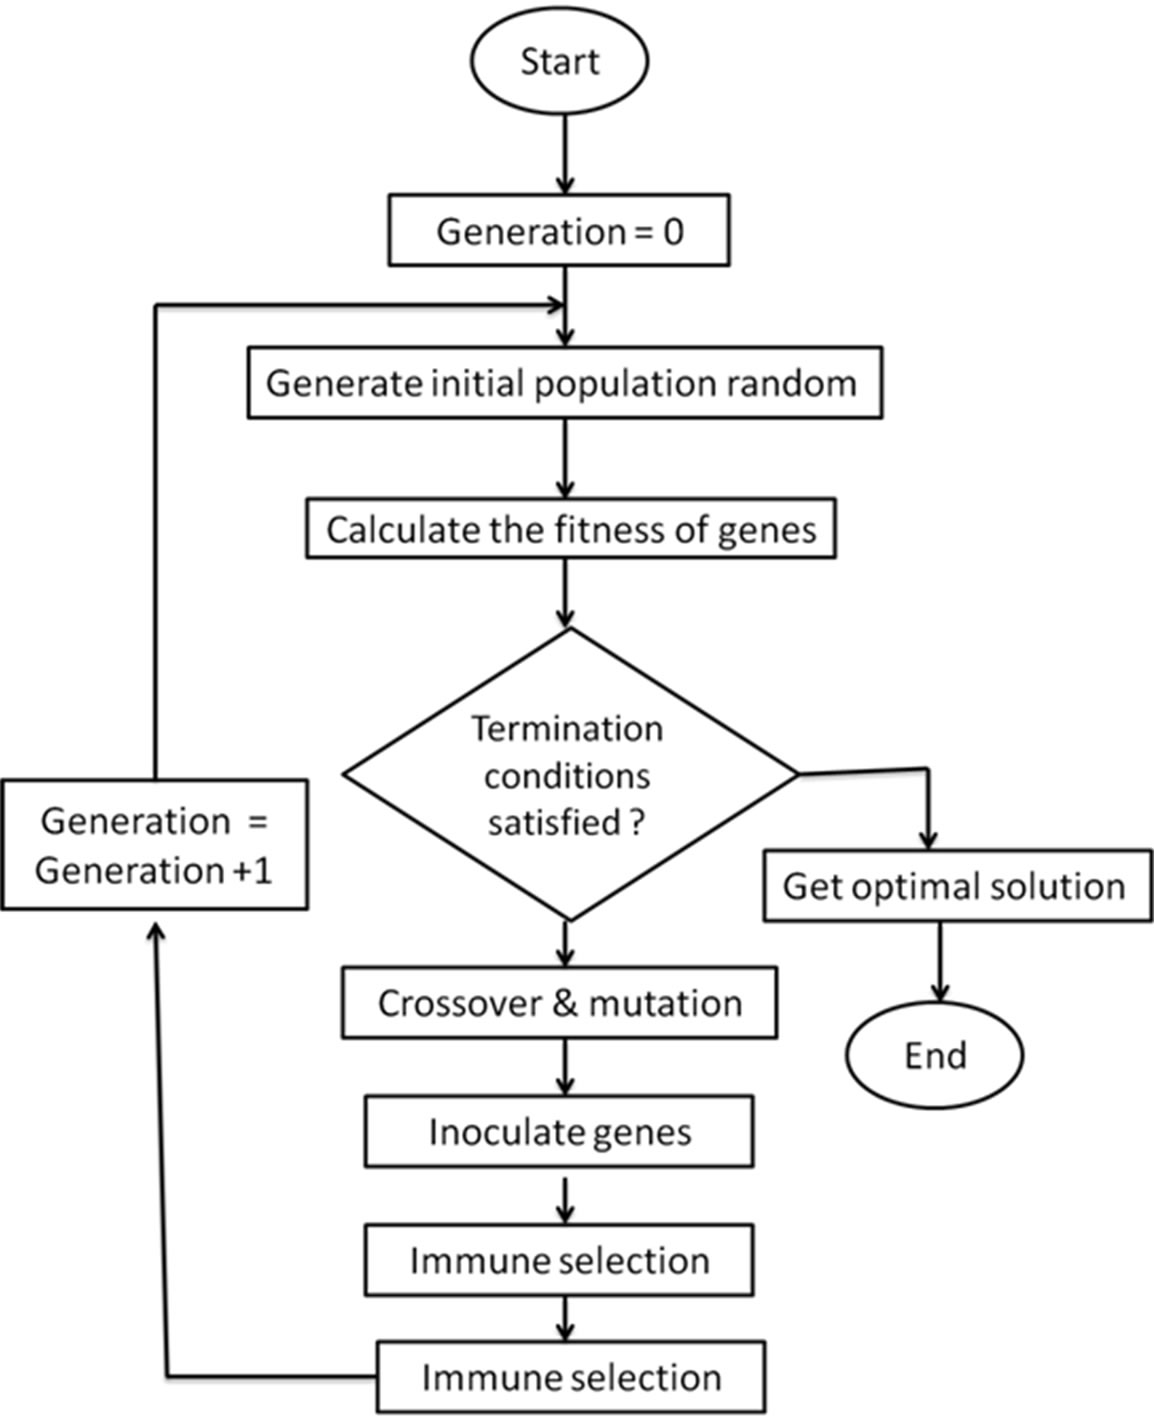
Figure 10. Immune-genetic algorithm workflow.
population. The search pace of thosequasi-optimal values x* is composed of mesh points in Rn. Each part of these points is an integral multiple of Δ. Each individual in the population is presented as (x, σ), where
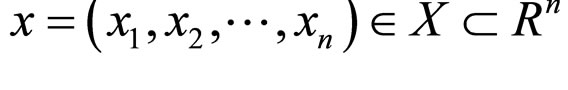 is a solution to the problem.
  is the expected solution.
  , where f* is the max fitness of X.
Step 2. Generate the intermediate population by crossing, with the size 2μ. The specific process is that for each individual (x, σ) of parent population, select another individual (x’, σ’) to crossover with (x, σ) in a crossoverpoint to generate y and y’.
Step 3. Mutate on the individual (x, σ) and generate a new one (x’, σ’).
Step 4. Inoculate genes. Inoculating the individual (x, σ) means to modify the value of x and σ in the range of variation or the restrictions in some parts of the optimal individuals. The inoculation process satisfies: If f(x) = f*, (x, σ) turns to itself with probability l.
Step 5. Immune selection. It consists of two procedures: Immunity testing and selection. The first procedure is to test the inoculated individuals. If its fitness is smaller than its parent’s fitness, there has been a serious degradation on the inoculated individual and its parent individual is used instead for the next competition. Immune Selection is to select μ individuals from 2μ individuals according to their fitness to compose a new parent population.
Step 6. If the termination conditions are not satisfied, generate a new generation and go back to Step 2.
6. Experimental
Experiments are carried out on a PC with Pentium 4, 2.4 GHz CPU with 1 Giga of RAM under windows Xp. Simulation programs are written with MATLAB 7. The value of threshold is τ = 0.3.
Figure 11(a) shows a sample original image from ten normotensive images. Figure 11(b) shows the segmentation image of the original image 11(a). Figure 11(c) shows the thinning of image 11(b). Figure 11(d) shows the detection results of number of terminal, number of bifurcation and number crossover landmarks points in image 11(c).
In evaluating the accuracy and appropriateness of the proposed GAVCC technique in detecting BPs and CPs from FI, the proposed techniques have been applied to two publicly available FI databases, namely the Stare database [21]. A performance evaluation of the GAVCC method has been done with the help of receiver operating characteristics (ROC). Other the methods have also been investigated for both of the image databases for comparison. Following are some of the used acronyms and below is given the set of mathematical definitions [22] used in the analysis.
(1) TP: true positive detections;
(2) TN: true negative detections;
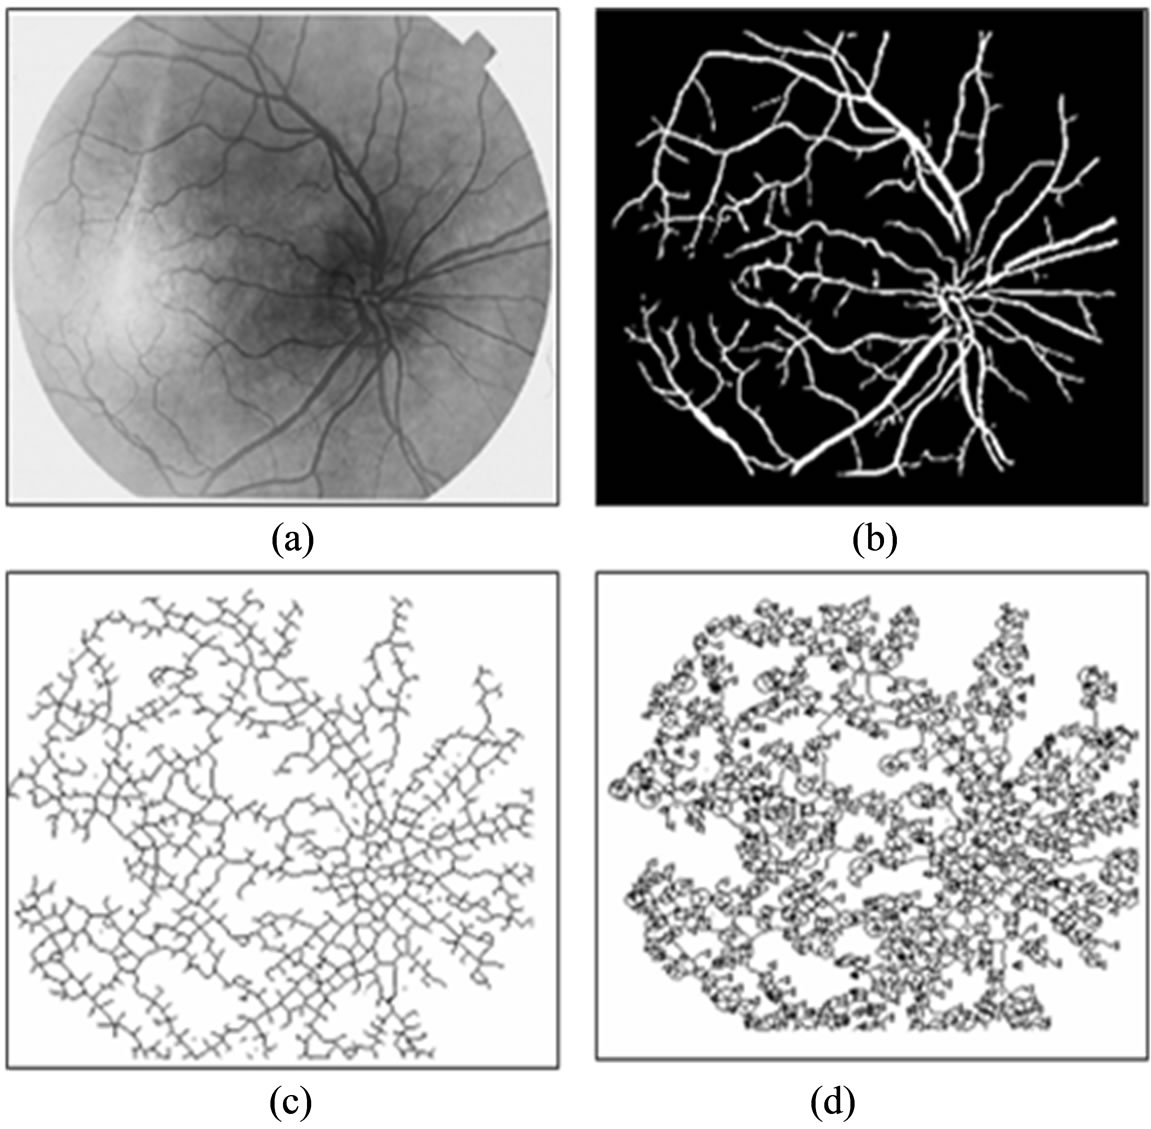
Figure 11. (a) The normotensive original image; (b) The segmentation image; (c) The thinning image; (d) The detection of landmarks points in image(c).
(3) FP: false positive detections;
(4) FN: false negative detections;
(5) ToP: total positives (manually counted from the image);
(6) MP: missed points;
(7) PR: precision;
(8) FR: false activation rate;
(9) TR: true positive rate;
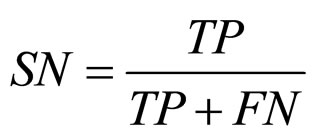
(10) SN: sensitivity;
(11) MR: missed rate;
(12) FR: false activation rate.
where,  ,
,  ,
,  ,
,
 and
and 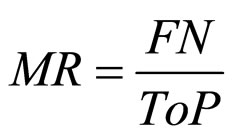
Results obtained from the application of other methods and the proposed method on FIs contained in the Stare database [21] are as shown in Tables 3-5 Each of the tables contains results for one of the three techniques.
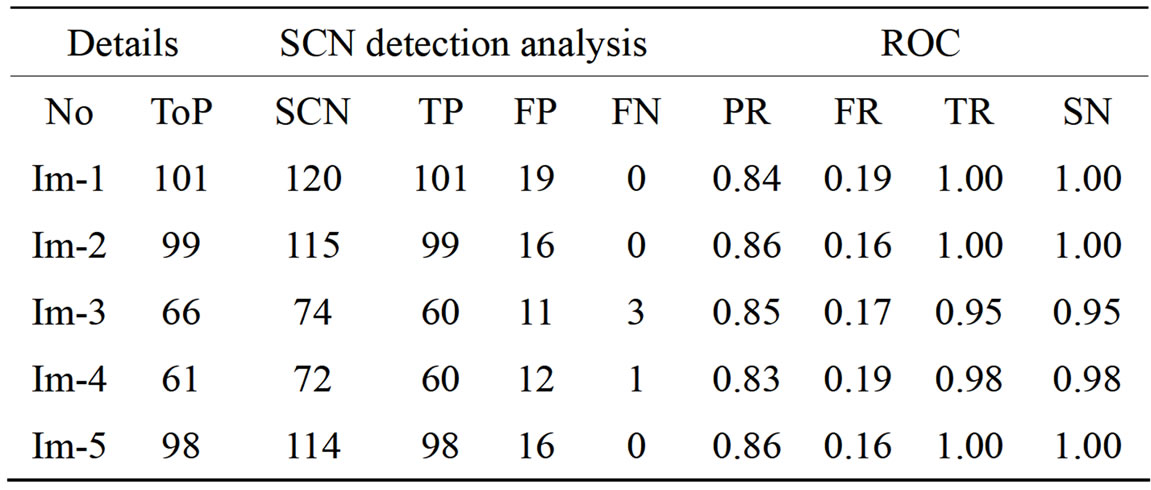
Table 3. The ROC produced by the SCN for stare database [20].
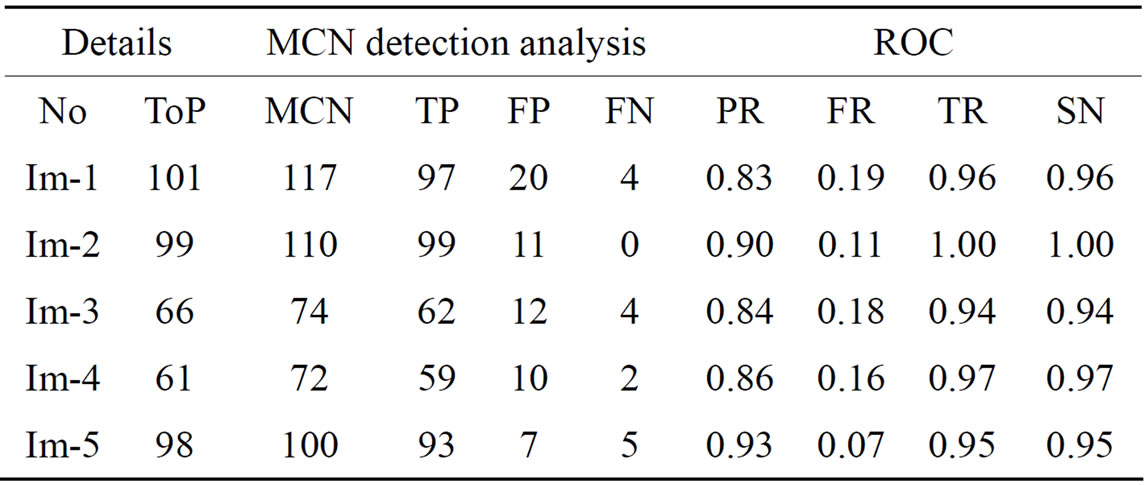
Table 4. The ROC produced by the MCN for stare database [21].
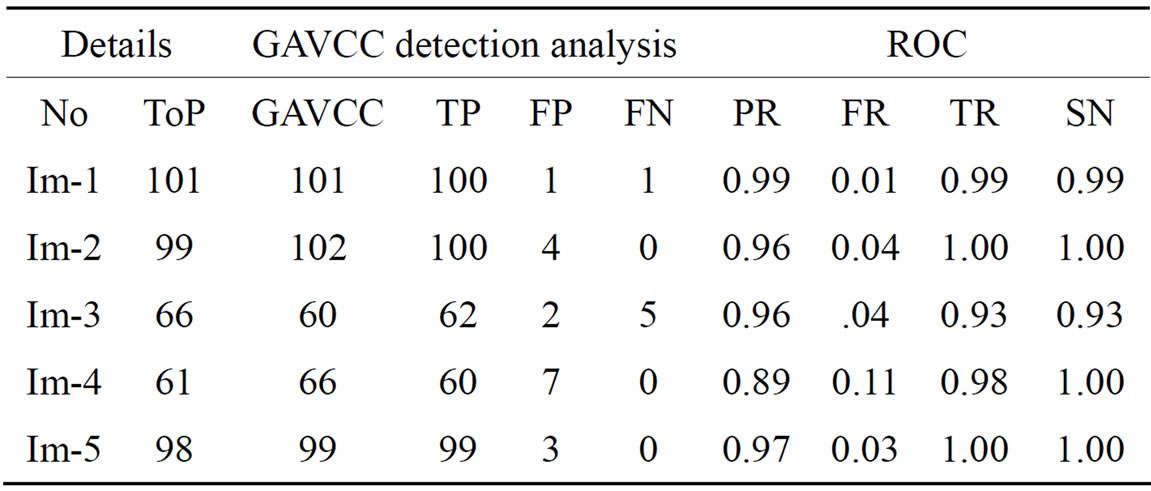
Table 5. The ROC produced by the GAVCC for stare database [21].
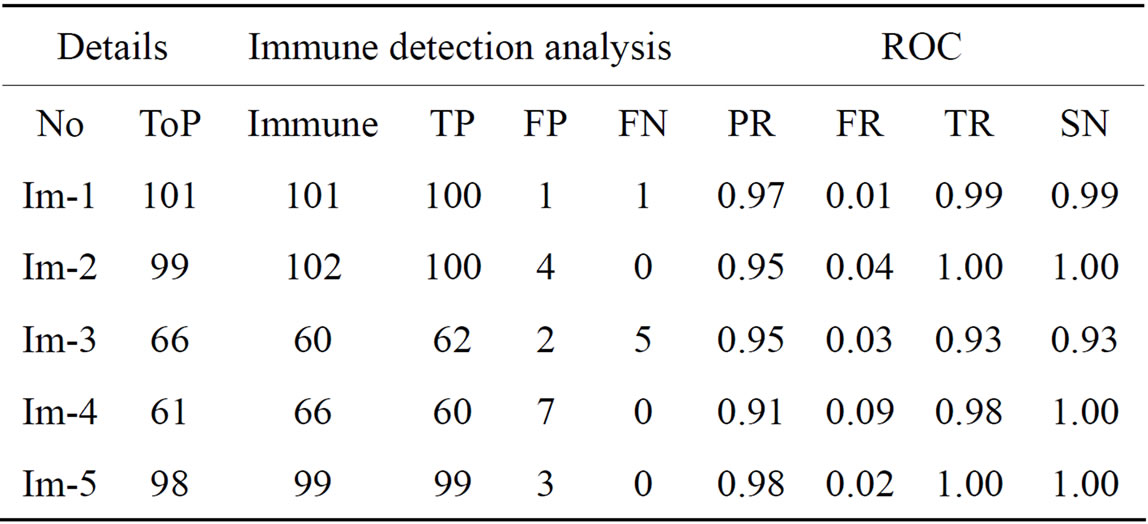
Table 6. The ROC produced by the immune algorithm for stare database [21].
The ROC of the immune genetic and GAVCC methods is more efficiency. The GAVCC method tends to reduce the FR without a simultaneous reduction in PR and TR by making use of the SCN and MCN methods in detecting candidate BPs and CPs. Results obtained with the CCN method are shown in Table 5 for the same five images for which the SCN and MCN results are shown in Tables 3 and 4. Table 6 shows improving genetic algorithm (immune algorithm) is more efficiency but the execution time is very high.
REFERENCES
- A. M. Aibinu, M. I. Iqbal, A. A. Shafie, M. J. E. Salami and M. Nilsson, “Vascular Intersection Detection in Retina Fundus Images Using a New Hybrid Approach,” Computers in Biology and Medicine, Vol. 40, No. 1, 2010, pp. 81-89. doi:10.1016/j.compbiomed.2009.11.004
- A. M. Aibinu, M. I. Iqbal, M. Nilsson and M. J. E. Salami, “A New Method of Correcting Uneven Illumination Problem in Fundus Images,” International Conference on Robotics, Vision, Information, and Signal Processing, Penang, 28-30 November 2007, pp. 445-449.
- A. M. Aibinu, M. I. Iqbal, M. Nilsson and M. J. E. Salami, “Automatic Diagnosis of Diabetic Retinopathy from Fundus Images Using Digital Signal and Image Processing Techniques,” International Conference on Robotics, Vision, Information, and Signal Processing, Penang, 28-30 November 2007, pp. 510-515.
- “Screening for Diabetic Retinopathy in Europe—15 Years after St. Vincent’ the Liverpool Declaration 2005,” Conference Report, Liverpool, November 2005.
- M. I. Iqbal, A. M. Aibinu, I. B. Tijani, M. Nilsson and M. J. E. Salami, “Cross Point Detection Using Fuzzy Logic and Neural Network,” Proceedings of the International Conference on Computer and Communication Engineering, Kuala Lumpur, 13-15 May 2008, pp. 241-246.
- T. Wong and R. McIntosh, “Hypertensive Retinopathy Signs as Risk Indicators of Cardiovascular Morbidity and Mortality,” British Medical Bulletin, Vol. 73-74, No. 1, 2005, pp. 57-70. doi:10.1093/bmb/ldh050
- R.Gelman, M. E. Martinez-Perez, D. K. Vanderveen, A. Moskowitz and A. B. Fulton, “Diagnosis of Plus Disease in Retinopathy of Prematurity Using Retinal Image Multiscale Analysis,” Investigative Ophthalmology & Visual Science, Vol. 46, No. 12, 2005, pp. 4734-4738. doi:10.1167/iovs.05-0646
- M. Ikram, J. Witteman, J. Vingerling, M. Breteler, A. Hofman and P. de Jong, “Retinal Vessel Diameters and Risk of Hypertension: The Rotterdam Study,” Hypertension, Vol. 47, 2006, pp. 189-194. doi:10.1161/01.HYP.0000199104.61945.33
- R. Klein, B. Klein, S. Moss, T. Wong, L. Hubbard, K. Cruickshanks and M. Palta, “The Relation of Retinal Vessel Caliber to the Incidence and Progression of Diabetic Retinopathy—Xix: The Wisconsin Epidemiologic Study of Diabetic Retinopathy,” Archives Ophthalmology, Vol. 122, No. 1, 2004, pp. 76-83. doi:10.1001/archopht.122.1.76
- T. Wong, A. Shankar, R. Klein and B. Klein, “Retinal Vessel Diameters and the Incidence of Gross Proteinuria and Renal Insufficiency in People with Type 1 Diabetes,” Diabetes, Vol. 53, No. 1, 2004, pp. 179-184. doi:10.2337/diabetes.53.1.179
- M. E. Martinez-Perez, A. D. Hughes, A. V. Stanton, S. A. Thom, A. A. Bharath and K. H. Parker, “Retinal Blood Vessel Segmentation by Means of Scale-Space Analysis and Region Growing,” In: C. Taylor and A. Colchester, Eds., MICCAI-99, Lectures Notes in Computer Science, Springer-Verlag, 1999, pp. 90-97.
- A. Hoover, V. Kouznetsova and M. Goldbaum, “Locating Blood Vessels in Retinal Images by Piecewise Threshold Probing of a Matched Filter Response,” IEEE Transactions on Medical Imaging, Vol. 19, No. 3, 2000, pp. 203- 210. doi:10.1109/42.845178
- J. Staal, M. Abramoff, M. Niemeijer, M. Viergever and B. van Ginneken, “Ridge-Based Vessel Segmentation in Color Images of the Retina,” IEEE Transactions on Medical Imaging, Vol. 23, No. 4, 2004, pp. 501-509. doi:10.1109/TMI.2004.825627
- X. Jiang and D. Mojon, “Adaptive Local Thresholding by Verification Based Multithreshold Probing with Application to Vessel Detection in Retinal Images,” IEEE Transactions on Pattern Analysis and Machine Intelligence, Vol. 25, No. 1, 2003, pp. 131-137. doi:10.1109/TPAMI.2003.1159954
- Z. Guo and R. W. Hall, “Parallel Thinning with Two-Sub Iteration Algorithms,” Communications of the ACM, Vol. 32, No. 3, 1989, pp. 359-373. doi:10.1145/62065.62074
- A.-B. M. Salem, A. A. Sewisy and U. A. Elyan, “A Vertex Chain Code Approach for Image Recognition,” Journal of Graphics, Vision and Image Processing, Vol. 5, No. 3, 2005, pp. 1-8.
- M. Sabaghi, S. R. Hadianamrei, M. Fattahi, M. R. Kouchaki and A. Zahedi, “Retinal Identification System Based on the Combination of Fourier and Wavelet Transform,” Journal of Signal and Information Processing, Vol. 3, 2012, pp. 35-38. doi:10.4236/jsip.2012.31005
- V. V. Govindaraju, Z. Shi and J. Schneider, “Feature Extraction Using a Chaincoded Contour Representation,” International Conference on Audio and Video Based Biometric Person Authentication, Guildford, 9-11 June 2003. doi:10.1007/3-540-44887-X_32
- D. E. Goldberg, “Genetic Algorithms in Search, Optimization and Machine Learning,” Addison Wesley, New York, 1989.
- M. Mitchell, “An Introduction to Genetic Algorithms,” The MIT Press, Cambridge, 1997.
- The STARE Database, 2009. http://www.ces.clemson.edu/ahoover/stare
- T. Fawcett, “ROC Graphs: Notes and Practical Considerations for Researchers,” Technical Report MS1143— Extended Version of HPL-2003-4, HP Laboratories, 2004.