Wireless Sensor Network
Vol.4 No.4(2012), Article ID:18624,3 pages DOI:10.4236/wsn.2012.44016
Improved Data Discrimination in Wireless Sensor Networks
Department of Information Technology, Amrita School of Engineering, Coimbatore, India
Email: {sabarishpm, shanpriya.s}@gmail.com
Received January 17, 2012; revised February 26, 2012; accepted March 13, 2012
Keywords: Wireless Sensor Networks (WSN); Data Mining; Clustering; Anomaly Detection; Outlier Detection
ABSTRACT
In Wireless Sensors Networks, the computational power and storage capacity is limited. Wireless Sensor Networks are operated in low power batteries, mostly not rechargeable. The amount of data processed is incremental in nature, due to deployment of various applications in Wireless Sensor Networks, thereby leading to high power consumption in the network. For effectively processing the data and reducing the power consumption the discrimination of noisy, redundant and outlier data has to be performed. In this paper we focus on data discrimination done at node and cluster level employing Data Mining Techniques. We propose an algorithm to collect data values both at node and cluster level and finding the principal component using PCA techniques and removing outliers resulting in error free data. Finally a comparison is made with the Statistical and Bucket-width outlier detection algorithm where the efficiency is improved to an extent.
1. Introduction
Wireless Sensor nodes in the network have two main functions: data forwarding and monitoring the neighbor node’s energy level. Based on the energy level, the node has been divided into advanced node (nodes with high residual energy) and normal node. In real time application, a sensor node senses the information and forwards it to the sink (Base station). The raw data transmitted to the sink node increases the work load of the sink. Self umpiring WSN [1] is composed of cluster of nodes and each cluster has cluster head and all the data transmitted by the nodes are collected and stored in the sink of the cluster. The power levels of the nodes are limited. In this paper, the discrimination of data at the node level and cluster level is done to improve the life time of the network and reduce the workload of the sink. It involves the techniques of clustering and outlier analysis to discriminate the data [2]. Anomaly Detection refers to detecting patterns in a given data set that do not conform to an established normal behaviour. Using the anomaly detection algorithms the malfunctioning nodes are detected and rectified [3,4]. The clustering of the network is implemented using the incremental clustering algorithm based on the centroid values of the network. The information is discriminated using the principal components using PCA algorithm.
2. Related Works
Daniel-Ioan Curiac et al. [5] proposes to detect malicious node by comparing its output with its estimated value computed by an autoregressive predictor. If the difference between the two values is higher than a chosen threshold, the sensor node becomes suspicious. In fact, the predictor can be used to discriminate the normal or abnormal situations of the monitored object or environment. But the problem with this approach is that it is hard to determine the type of the autoregressive model and some types of the predictors are difficult or computationexpensive to build.
Markus Wälchli and Torsten Braun [6] propose a sensor node level unsupervised anomaly detection mechanism, based on the Fuzzy Adaptive Resonance Theory (ART) neural network. The mechanism can be used for office monitoring and is able to distinguish abnormal office access from normal access. Any observed access pattern, being fed to the Fuzzy ART neural network, is mapped to a classification value. The problem with this approach is that the length of different access patterns (time series) is difficult to determine.
Sutharshan Rajasegarar et al. [7] propose an approach based on a distributed, cluster-based anomaly detection algorithm, aiming to minimize the communication overhead while detecting anomalies. The sensor node clusters the measurements and reports the cluster summaries. And the intermediate sensor nodes further merge the cluster summaries before communicating with other nodes. The clustering is also fixed-width. After clustering, the average inter-cluster distance of the K-nearest neighbour (KNN) clusters is used to identify the anomalous clusters.
3. Implementation
The proposed discrimination model is implemented in two levels mainly at node level and clustering level. In which the raw data set D is finally partitioned into three subsets, Devent, Derror and Dordinary. The clustering is done using incremental algorithm, Cluster head is selected using the peterson’s algorithm [8]. Cluster heads are scheduled to rotate themselves with the period of time based on the energy level of the nodes (Residual energy). The cluster head will include the process of data aggregation and forwarding to the Base Station. The premature death of nodes will lead to hole in the network. Hence the cluster heads are selected from the nodes with the high residual energy (Advanced Nodes).
The Implementation of Discrimination [9] in two levels are:
Node level: If the value or gradient of a sample exceeds the range of some physical constant, it is apparently an erroneous sample that should be put into Derror. Otherwise, the set of discrete errors are picked out and the samples of continuous errors are marked by interval for further processing. In our work, linear regression is used based on a fixed size of sliding window. The value differences of the predicted samples and the real-sensed samples reflect the temporal pattern of the sample sequence. Both events and errors would incur significant change of pattern and thus a higher value difference in prediction, according to which the involved samples are marked for further discrimination. The rest of the samples are put into Dordinary.
Cluster level: The local fusion center evaluates the samples in D' with reference to Dordinary. The event samples are finally selected from D' and constitute Devent. We use deviation-based ranking strategy to evaluate the samples in D' because it has been assumed that there is little chance for all of the nearby nodes (within a cluster) to get similar wrong readings.
Datasets are generated using SimPy simulator and stored in database. Dataset of LED was taken into consideration and node level and cluster level discrimination was done using Python. Peterson algorithm was used to select the cluster head. Incremental clustering and PCA was also carried out. Final graph was plotted with the collected data. Data Aggregation has been carried our using READA to eliminate the redundant information while collecting the information in nodes itself [10].
From the data set, LED of red, yellow, green and orange colors are considered. Wireless sensors are setup for the detection of various properties like Wavelength, Voltage, Light, Temperature, Accel_x, Accel_y. The values generated using SimPy (Simulator Python) are entered into the database using MySQL. A total of 492 values are stored into the database. Principal Components are identified as the ID of the sensor, Voltage and Wavelength [11,12]. The outliers are identified using the proposed method and the result is compared and analyzed with the previous statistical method.
4. Comparison and Future Work
Here for the comparison outlier detection process using traditional Statistical method and proposed Bucket-width algorithm green values are only considered. Wavelength vs. Voltage graph is plotted to show the values with outliers. The graph is plotted with Wavelength on X-axis and Voltage on Y-axis.
Total of 87 values are generated for green out of which Statistical method detects 22 outliers (Figure 1) and Bucket-width algorithm detects 24 outliers (Figure 2). In the graph above Normal values are plotted in orange and outliers are plotted in blue.
For the comparison of the Efficiency of the Statistical method vs. Bucket-width outlier detection algorithm total values generated and total outlier detected by the two methods are compared using bar graph (Figure 3).
Statistical method detects 22 outliers and Bucketwidth algorithm detects 24 outliers (Table 1).
Hence increase in Efficiency = ((24 – 22) / 87) × 100 = 2.3% This 2.3% efficiency can be improved when a database having thousands of values is taken.
5. Conclusion
In this paper, self umpiring system which performs incremental cluster algorithm, PCA and outlier detection was tested. In our system each node in the path from
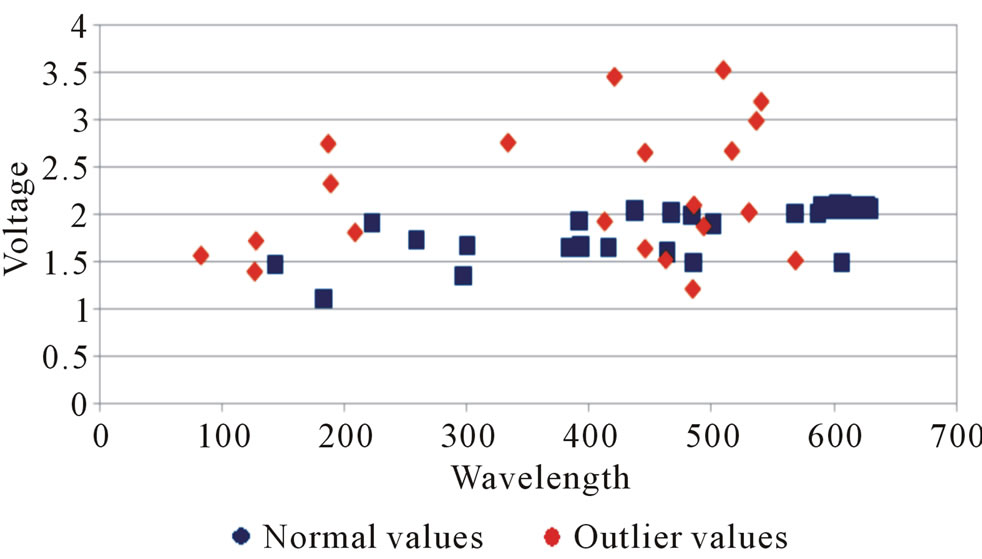
Figure 1. Traditional statistical method with outlier.
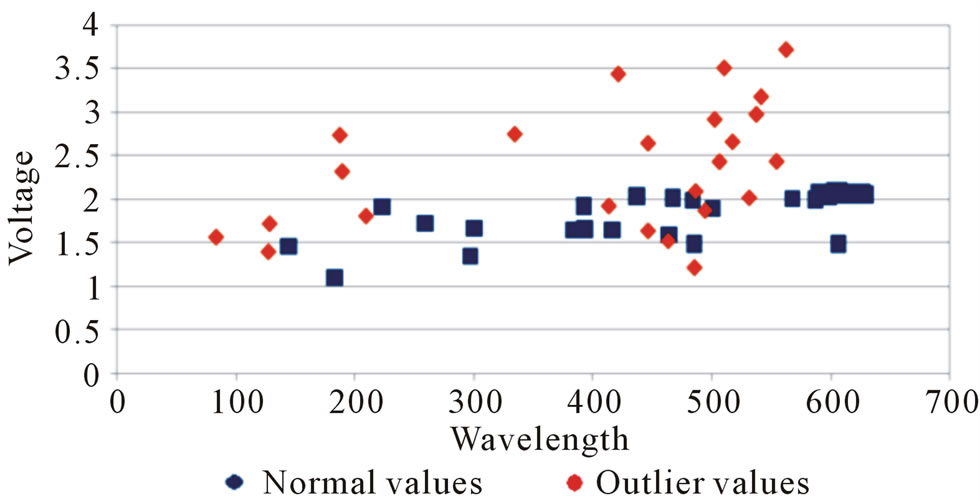
Figure 2. Proposed method with outlier.
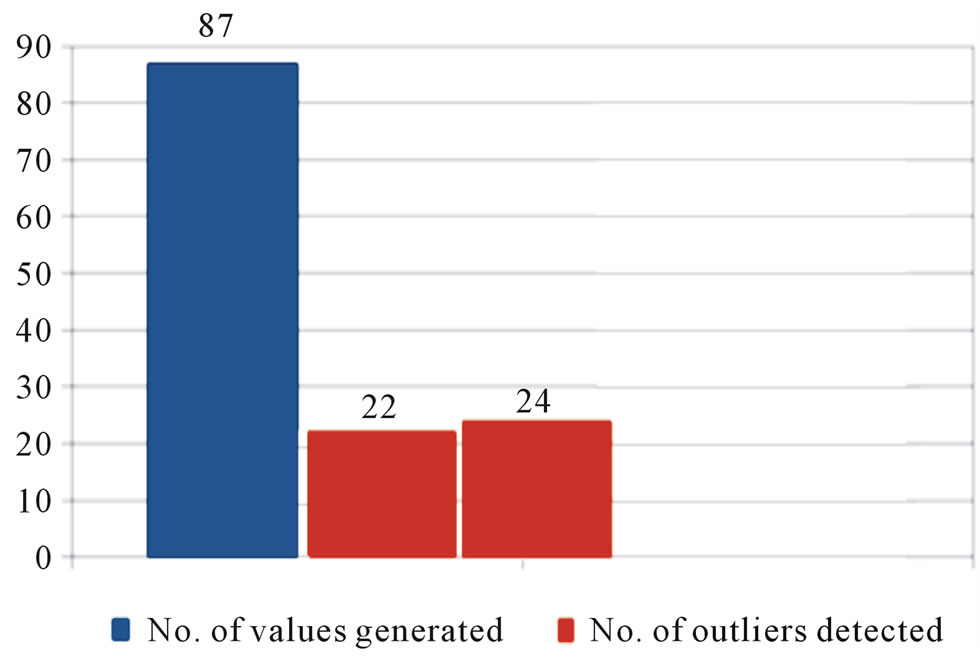
Figure 3. Efficiency of statistical histogram mrthod vs. incremental method.
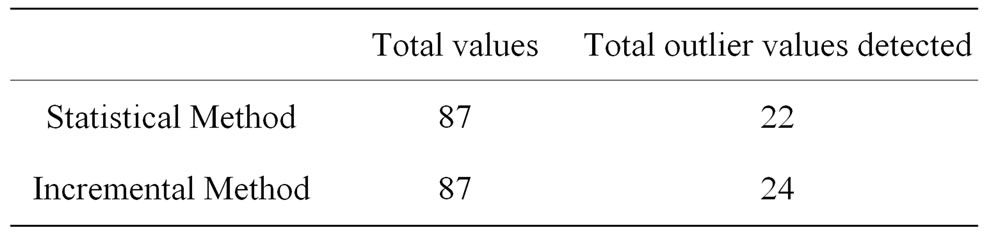
Table 1. Result table with actal datasets and outliers identified.
source to destination has dual roles to perform packet forwarding and umpiring. Self umpiring system is data centric and prone to errors. Data discrimination techniques are used to identify ordinary and erroneous data. Kernel estimation at cluster level will yield better result and future work can be carried on that.
REFERENCES
- A. Kathirvel and R. Srinivasan, “Self Umpiring System for Security in Wireless Mobile Ad Hoc Network,” Wireless Sensor Network, Vol. 2, No. 3, 2010, pp. 264-266. doi:10.4236/wsn.2010.23036
- V. Jha and O. V. S. Yadav, “Outlier Detection Techniques and Cleaning of Data for Wireless Sensor Networks: A Survey,” International Journal of Computer Science and Technology, Vol. 3, No. 1, 2012, pp. 45-49.
- L. Deri, S. Suin and G. Maselli, “Design and Implementation of an Anomaly Detection System: an Empirical Approach,” TERENA Networking Conference in association with the CARNET Users’ Conference, Zagreb, 19-22 May 2003, pp. 1-20.
- Y. K. Jain and S. S. Patil, “Design and Implementation of Anomalies Detection System Using IP Gray Space Analysis,” International Conference on Future Networks, Bangkok, 7-9 March 2009, pp. 203-207. doi:10.1109/ICFN.2009.9
- D.-I. Curiac, O. Banias, F. Dragan, C. Volosencu and O. Dranga, “Malicious Node Detection in Wireless Sensor Networks Using an Autoregression Technique,” Third International Conference on Networking and Services, Athens, 19-25 June 2007, p. 83. doi:10.1109/ICNS.2007.79
- M. Wälchli and T. Braun, “Efficient Signal Processing and Anomaly Detection in Wireless Sensor Networks,” Applications of Evolutionary Computing, Vol. 5484, 2009, pp. 81-86. doi:10.1007/978-3-642-01129-0_9
- S. Rajasegarar, C. Leckie, M. Palaniswami and J. C. Bezdek, “Distributed Anomaly Detection in Wireless Sensor Networks,” 10th IEEE Singapore International Conference on Communication systems, Singapore, 30 October-2 November 2006, pp. 1-5. doi:10.1109/ICCS.2006.301508
- E. Parvar, M.-R. Yazdani, N. EffatParvar, M. Dadlani and A. Khonsari, “Improved algorithms for Leader Election in Distributed Systems,” 2nd International Conference on Computer Engineering and Technology (ICCET), Chengdu, 16-18 April 2010, pp. 6-10. doi:10.1109/ICCET.2010.5485357
- X. n. Cui, Q. Li, B. h. Zhao, “Data Discrimination in Fault-Prone Sensor Networks”, Wireless Sensor Network, Vol. 2, No. 4, 2010, pp. 285-292. doi:10.4236/wsn.2010.24039
- K. Khedo, R. Doomun and S. Aucharuz, “READA: Redundancy Elimination for Accurate Data Aggregation in Wireless Sensor Networks,” Wireless Sensor Network, Vol. 2, No. 4, 2010, pp. 302-308. doi:10.4236/wsn.2010.24041
- A. Weingessel and K. Hornik, “Local PCA algorithms,” IEEE Transactions on Neural Networks, Vol. 11, No. 6, 2000, pp. 1242-1250. doi:10.1109/72.883408
- D.-A. Le Borgne, S. Raybaud and G. Bontempi, “Distributed Principal Component Analysis for Wireless Sensor Networks,” Sensors, Vol. 8, No. 8, 2008, pp. 4821-4850. doi:10.3390/s8084821