Journal of Water Resource and Protection
Vol.6 No.2(2014), Article ID:42881,14 pages DOI:10.4236/jwarp.2014.62013
Water Supply Network Losses in Jordan
1Lulea University, Lulea, Sweden
2Al al-Bayt University, Mafraq, Jordan
Email: Nadhir.alansari@ltu.se, n.alibrahiem@gmail.com
alsaman_marwan@yahoo.com, Sven.Knutsson@ltu.se
Received November 26, 2013; revised December 24, 2013; accepted January 17, 2014
ABSTRACT
Water supply network losses are an international problem especially in countries suffering from water scarcity like Jordan. Jordan is one of the poorest countries in its water resources and it is estimated to be below the water poverty line. Jordan is located in the Middle East and has a surface area of approximately 90,000 km2. Its population is around 6.3 million and it is estimated that the population will be 7.8 million in 2022. The gap between water supply and demand is widening due to development and a relatively high population growth rate. In addition, global climate change is expected to intensify the water shortage problem in Jordan. Thirteen years of complete records obtained from the Ministry of Water and Irrigation were analyzed. According to these records, water losses in Jordan reach about 50%. In view of the evaluation of the data and the case study conducted in this research, it is believed that Jordan can overcome the water shortage problem by adopting a water demand management strategy. In this context, efforts should be focused on reducing water losses. If this is achieved, it will save huge quantities of water and revenue.
Keywords:Jordan; Water Supply Network; Water Losses; Neamie
1. Introduction
Water supply network losses are an international problem in developed countries [1-4] as well as developing countries [5-7]. The situation becomes more critical in countries suffering from water shortages like Jordan. Jordan has a surface area of approximately 90,000 km2 (Figure 1) and its population is around 6.3 million. It is estimated that the population will be 7.8 million in 2022 [8]. Jordan is located in the Middle East, at the eastern end of the Mediterranean Sea. The most distinctive topographic features of Jordan are the Rift Valley, a narrow strip of highlands (with a maximum elevation of 1600 m above sea level), the steppe, the desert zone and the Dead Sea (426 m below sea level in 2010).
The climate is of a Mediterranean type in western Jordan which is characterized by dry, hot summers, mild wet winters and extreme variability in rainfall during the year as well as from year to year. The climate in the highlands is characterized by cold winters and mild summers. The Jordan Rift Valley and Aqaba have a subtropical climate—hot in summer and warm in winter. The desert region has a continental climate with large variations in temperature. Precipitation is very low and ranges from 30 to 600 mm annually. About 93.5% of the country has less than 200 mm of rainfall, and only 0.7% of the country has annual precipitation of more than 500 mm [9]. The rainy season starts in November and ends in April. Most of the country (83%) is composed of desert and desert steppe.
The total precipitation amounts to 8.2 km3 and about 92% of it is lost by evaporation. The country is estimated to be below the poverty line by 682 million m3/year, The developed surface water potential was approximately 295 million m3 in 2007, and is projected to reach 365 million m3 by 2022 [9].
Jordan relies mainly on its groundwater resources which accounts for about 54% of water supply in from 12 groundwater basins (Figure 2). Renewable groundwater resources are 450 million m3/year with a safe yield of 275.5 to million m3/year [10]. Abstraction of groundwater is beyond sustainable limits causing a deficit of 151 million
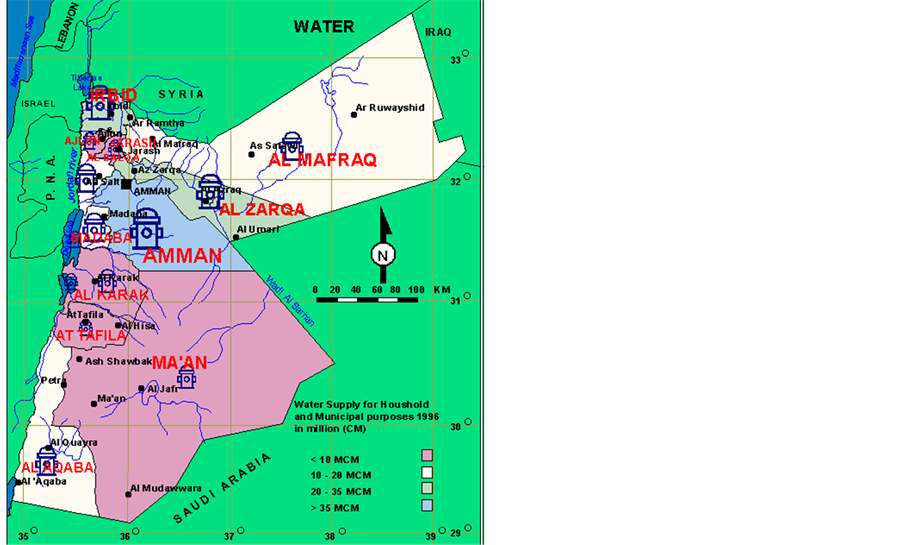
Figure 1. Location map of Jordan.
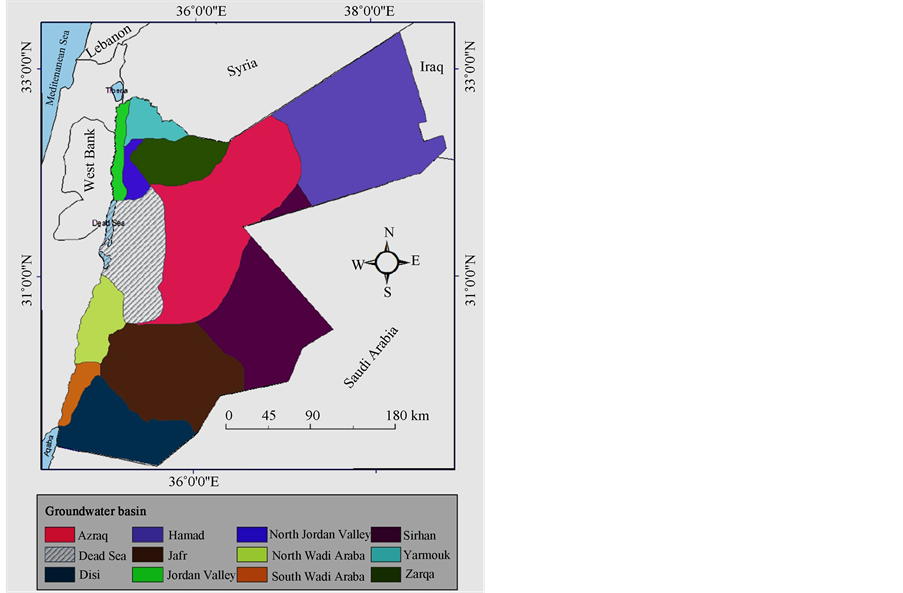
Figure 2. Ground water basins in Jordan.
m3/year in 2007 as an example [9]. Surface water resources form about 37% of the total water supply from 16 basins (Figure 3). Yarmouk accounts for almost 50% of the country’s surface water resources. Other water sources are fossil water, treated wastewater (110 million m3 in 2009) and brackish water. The contribution of treated wastewater is increasing with time where it was only 7 million m3 in 1984 and increased to about 67 million m3 in 1996 [11]. For these reasons, Jordan is considered to be one of the poorest countries in terms of its water resources.
The difficulties to estimate the water losses in developing countries are the access to the data and the distribution of the data within several departments. This research is a study and investigation of the information obtained from the Ministry of Water and Irrigation about the extracted, supplied and sold water quantities. Complete records were studied for the period 1986 to 1998 in particular. Water losses in Jordan reached about 50% of the supplied water quantities [5] where the accepted rate should be less than 25% [12]. The benefits of reducing these losses are discussed and a case study was carried out to help decision makers to overcome the problem of shortages in water supply.
2. Water Resources of Jordan
A number of authors have reported shortages of water
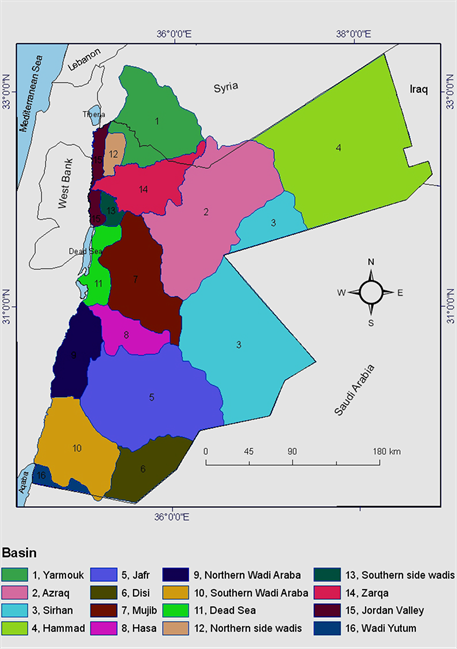
Figure 3. Surface water basins of Jordan.
resources in the Middle East [13-16]. At least 12 Arab countries have acute water scarcity problems with less than 500 m3 of renewable water resources per capita available [17,18]. The supply of fresh potable water is essential to life, socioeconomic development, and political stability in the region. It was reported that one cubic meter of water can provide drinking water for one person for one year or the same quantity can produce only one kg of food grain when used for irrigation in a dry climate [19]. The need for a rationalized holistic management of this most vital natural resource is paramount in order to attain a sustainable society.
Jordan is among the most arid countries in the world and the allocation per capita reaches less than 150 l/capita/day [17,18,20]. Aquastat [21] stated that the water withdrawal by source in 2005 was, Groundwater 59%, surface water 31% and wastewater contributions and others 10%. Due to the sharp increase in population the per-capita water availability, dropped from 3600 m3 in 1946 to 145 m3 in 2008 [9]. By 2022, the population may exceed 7.8 million, and total water demand may reach 1673 million m3. Water deficit of 659 million m3 (2009) could be reduced to 457 million m3 by 2022 [9]. The Jordanian government constructed 28 dams between 1950 and 2008 with a total storage capacity of 368 million m3 and at the same time, locations were identified for a number of reservoirs that would give the potential to add 444 million m3 to Jordan’s water storage capacity.
Municipal water consumption increased by an average of 8% per year while it was 6.6 and 3% within the industrial and agricultural sectors respectively. The increase of water consumption in these sectors is due to the increase in investments in these sectors of the economy. According to the records the average consumption per capita in the municipal sector reaches 138 l/capita/day while it reached 147 and 145 l/capita/day in 2010 and 2011 respectively [22]. When water losses are taken into consideration, this amount decreases to 70 - 75 l/capita/day. Within the industrial and agricultural sectors the allocated water per capita (as an average) reaches about 126 and 493 l/capita/day respectively. In 2005, the allocation was 165 m3/capita/day [21], and expected allocations in 2015, 2025 and 2050 are 130, 121, 100 m3/capita/day respectively [23]. El-Fadel and Maroun [24] stated that Jordan has a shortfall in supply by 53%.
The Ministry of Water and Irrigation [22] stated that municipal water supplied in 2009, 2010 and 2011 reached 313.4, 330 and 330.1 million m3 respectively. This gives 144,147 and 150 l/capita/day for these years respectively. Furthermore, the total amount of water released for drinking and irrigation purposes in 2010 and 2011 were 229.675 and 222.272 million m3 [22].
The highest percentage of water consumption is in the field of Agriculture followed by municipal and then industrial sectors [20]. Nimah [23] indicated that by 2050 the available water in Jordan will be 100 m3/capita/year. The Ministry of Water and Irrigation [22] published the projected water demand for the year 2025 and the type of water use (Figures 4 and 5). In this report the municipal, industrial and agricultural demands were 613,117, and 700 million m3 respectively. It was also noticed that they added 100 and 29 million m3 as nuclear power plant and touristic water demands. In addition, the same report showed that the total demand will reach 1695 million m3 in 2030 (710, 150, 700, 100, 35 million m3 for municipal, industrial, agricultural, nuclear and touristic water demands respectively). Jordan’s Water Strategy Plan [8] indicated that the available water in 2022 is 1632 million m3 (Figure 6).
The largest consumer of water across the region is agriculture which accounts for 66% of demand, [25] and therefore the water shortage problem cannot be objectively analyzed nor adequately addressed without a tho rough consideration of agriculture in the region [26]. For
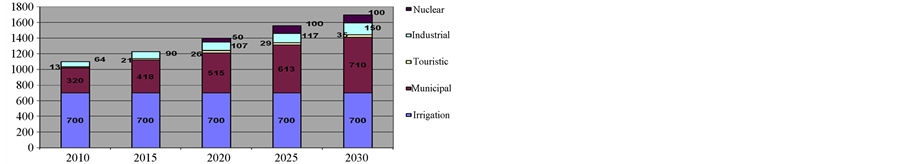
Figure 4. Projected water demand in Jordan [22].

Figure 5. Type of water use in Jordan in million cubic meters (MCM) [22].
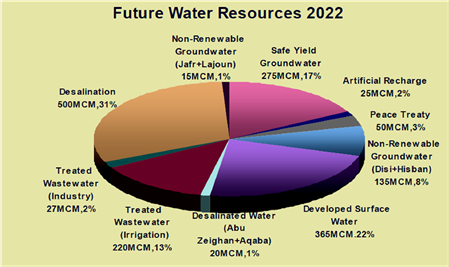
Figure 6. Future available water resources in Jordan 2022 [12].
example an approximate 10 percent transfer of water away from agriculture would produce a 40 percent increase in domestic water supply for Jordan [26]. Postel [27], argues that rather than diverting precious water to agriculture this water could be saved by importing the food/grain. However, this is not the case in many Middle Eastern countries which have unrealistic aspirations of food self-sufficiency and in it would require a most fundamental change in national outlook [28]. Sadik and Barghouti [26] emphasized that the extent of the problem is so severe that “the future challenges in meeting the growing demands for water are beyond the capabilities of individual countries”. Mitigating supply shortfalls could be achieved by re-allocation of current agricultural supplies [13].
The Ministry of Water and irrigation usually satisfy the demand through supply management practices and with the diminishing opportunities to increase water supply and the escalating costs of the projects to augment supply, the ministry should give greater emphasis to demand management [11,26,29,30].
In addition to the above, the effect of climate change is expected to intensify the water shortage problem in Jordan. The Middle East and North Africa region (MENA) contains hyper-arid, arid and semi-arid zones [31]. Several research projects have concluded that arid and semi-arid regions are highly vulnerable to climate change (e.g. [32]). It is expected that the region will suffer from higher temperatures and intense heat waves affecting inhabitants and crop yields, and will also affect marine ecosystems and fisheries. Less but more intense rainfall, coupled with higher temperatures, will likely cause more droughts and greater flooding, sea level rise, more intense cyclones and new areas exposed to dengue, malaria, and other vector and waterborne diseases. Al-Ansari and Baban [33] and Al-Ansari et al. [34,35] indicated that future rainfall forecast is decreasing with time in Jordan. The drought will affect the agricultural life and water supply [36]. This is due to the fact that most of the agricultural areas of the MENA region are rain-fed [37] and decreases groundwater recharge which is already depleting [38].
3. Water Losses
Water losses are defined here as the water which has no revenue [5]. These can be classified as:
Technical losses: they result from breakdown or seepage within the distribution pipes systems (Figure 7). This type of loss can be divided into three groups:
Apparent technical loss: this is due to apparent breakdown of the distribution net systems.
Unseen loss: such loss is due to the breakdown of the pipes in the distribution network under the ground.
Administrative losses: these are due to the existence of broken water quantity meters, human errors (e.g. issuing wrong bills), not installing meters correctly, using the water illegally, centralization, and weak governance (Figure 8). Charalambous [39] has summarized what happens typically to the distributed water (Table 1).
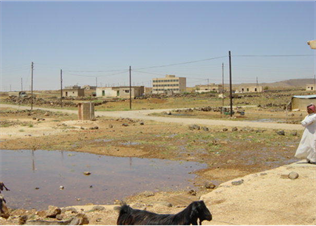
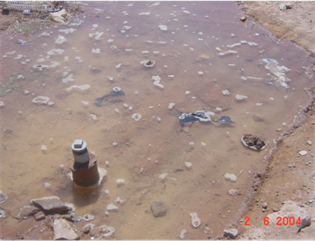
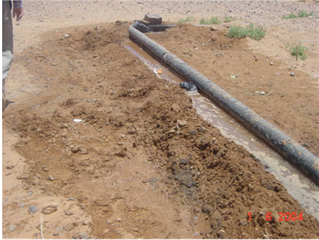
Figure 7. Examples of technical losses: left-broken pipe; middle-leaking pipe; right–breaking pipe to supply water to livestock.

Table 1. Water distribution [39].
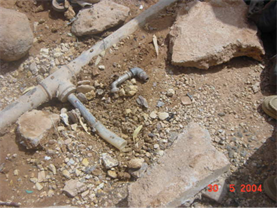
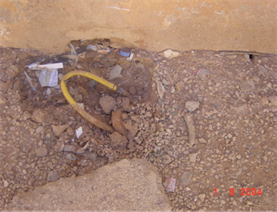
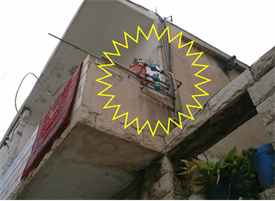
Figure 8. Examples of administrative loss in Mafraq: leftthe meter is removed and replaced by a T-joint; middle-pipe connection passing the meter; right-connection to supply the housing unit before the meter.
To calculate the loss the following equation is used:
Quantity of water loss (L) = Net supplied water (Ss) − Net sold water (So) + Water consumed outside water meters (C).
Records extending from 1986 to 1998 were investigated to see the percentage of water loss in different governorates in Jordan in addition to the data given by the World Bank for the period 1999 to 2004 (Table 2). Accordingly, it was evident that almost all the governorates lose about 50% of the supplied water (Table 2). The Mafraq governorate had the highest water losses (69.13%). This is believed to be due to the very large area of the governorate (26,541 km2) and this is in part due to the length of the water supply pipelines which amounts to about 10,000 km. Consequently, long supply pipelines make it hard for the inspection and maintenance teams to report or repair seepages and leakages [40]. In addition, this governorate’s population livelihood is based on livestock. In many cases, livestock owners deliberately make seepages in the supply pipe lines using guns, or they break the lines in valleys, in order to secure water needs for their livestock [41]. Furthermore, it seems that as the water supply increases with time, so do the losses where it is increasing with an annual average of about 5%. The records indicate that the administrative losses were between 27% - 32.8% and the illegal water use had the highest percentage of 11.8% followed by faults in water meters (10.6%). This is followed by faulty readings (5.3%) and faulty estimation of the volume of water consumed (3%). On the other hand, technical losses
Table 2 . Percentage water losses in governorates of Jordan (Sources of data from 1999 to 2004 is [42]).
reached an average of 25.6% from the total volume of water supplied. These figures are considered very high compared to developed countries where it is about 10% [43,44].
The high percentage of water losses affect the quantity of water available and this usually forces the water authorities to search for new water resources to compensate for the losses rather than manage demand and leakage. In 1986, the allocation per capita per day was 92 l/capita/ day, while the allocation drops to 42 l/capita/day after counting the losses. In 1998 however, the allocation capita/day was 144 liter and drops to 62 liter after counting the losses. The decrease in allocation per capita is ranging from 42% to 45% (see Table 3).
It should be noted that the administrative loss does not affect the total water supply, simply because these quantities of water do exist but were consumed in an illegal way while the technical losses affect the total volume of water supplied. The records indicate that the volume of supplied water decreased to 97.6 and 162.3 MCM in 1984 and 1998 respectively while the technical losses were 26.8 and 23.5% respectively (Table 4). This leads to an estimated loss 35.9 and 56.8 million Jordanian.
Dinars (JD) (51.3 - 81.14 US Dollars) in 1986 and 1988 respectively. This was estimated using the using the following equations:
 (1)
(1)
 (2)
(2)
where:
WP: Volume of Consumed water WS: Volume of supplied water Tr: Percentage technical water loss Ar: Percentage administrative water loss Using the least squares method, then we get:
 (3)
(3)
This indicates that technical water loss will cause a decrease of 0.69 m3 of the offered water and administrative loss will cause an increase of 0.04 m3.
If the technical water loss is decreased by 15% then the volume of consumed water will increase (see Table 5). For 1998 records the water consumed will increase from 205.3 to 217.4 million m3.
If we consider the water allocation is 200 l/capita/day then the required water in 1986 will be 204.1 million m3 and increases to 335.9 million m3 for the year 1998. For the purpose of finding the effect of the water losses on the required quantities of water, the following equation was used:
 (4)
(4)
where:
Wd: Needed water Wn: Total water required
Table 3 . Water supplied and lost for the period 1984-1998.
Table 4. Volume of supplied water and percentage of lost water.
Table 5. Effect of decreasing technical water loss on actual consumed water.
Wp: Water supply Tr: Percentage technical loss Ar: Percentage administrative loss This shows that the administrative loss will decrease the quantity of the required water (Table 6). If we take 1986 as an example then the quantity of needed water is 204.1 million m3 and if we add the total losses then this quantity increases to 276.5 million m3 and we already know the quantity of water which is referred to as administrative loss (36.4 million m3) already exist within the quantity required (Table 6). As for the year 1998, the total quantity of water required, including the total loss, is 471.9 million m3 and when we disregard the administrative loss the required water quantity is 370 million m3 (Table 6).
For future predictions, it was assumed that the water losses will be dealt with and will decrease to 20, 15 and 10% in 2015, 2020 and 2025 respectively (Table 7). In this case the required water quantities will be 476.9, 610.7 and 747.2 million m3 in 2015, 2020, and 2025 respectively (Table 7). From an economic perspective, 70% of the cost was considered for water supply while the remainder, 30%, was considered as sewerage services costs [42,45]. The cost of one cubic meter of extracted water was calculated through the actual expenditure involved and it was found to be 0.170 and 0.390 JD for the years 1986 and 1988 respectively indicating an increase of 125%. Furthermore, the selling price of one cubic meter of water was 0.37 and 0.88 JD for the years 1986 and 1998 respectively. Using the financial balance sheets of the water authorities during the study period, it is found that revenue from the sale of one cubic meter of extracted water will be 0.1 to 0.166 JD for the years 1986 and 1998 respectively indicating an increase of 66%.
When the revenue of one cubic meter of sold water is calculated it will be 262 and 381 JD for the years 1986 and 1998 respectively. This implies that the cost of lost water was 8.74 million JD (1986) and 22.6 million JD (1998) showing an increase of 158% (Table 8).The actual price or cost of the lost water is its cost plus the revenue if it was sold as follow:
 (5)
(5)
where:
TC: Total cost WL: Quantity of lost water Acp: Average cost of 1 m3of extracted water Ars: Average revenue 1 m3 of sold water Using the above equation, the cost of lost water reached 21.2 million JD (1986) and 75 million JD (1998) (Table 8) while the financial budget of the water authority was showing a negative balance of 3 million JD (1986) and 32.8 million JD (1998).
The total value of lost water reached 131%, and 186% of the income of the water authority in 1986, and 1998 respectively (Table 8). There is a decrease noticed in
Table 6 . Effect of water losses on the quantity of required water.
Table 7. Effect of decreasing water losses on expected water requirements.
Table 8. The monetary value of water losses and the impact of reduced water losses return.
1997 which is due to the introduction of a new water tariff (Table 8). If we consider the total studied record (1986-1998) then the accumulated total cost of the lost water reaches 552 JD. In case we consider that water losses were reduced by 30% of the total supplied water, then we get a surplus of 9.44 million JD in 1986 and 40 million JD in 1998. The cost of reducing water losses is about 2.5 million JD plus 10% for contingencies [46]. Accordingly, if each water authority in Jordanian Governorates is given one million JD to overcome the water losses then the overall surplus in the income of the water authority will be about 75 million JD.
4. Case Study
Neamie city was selected as a case study for the water losses. Neamie city is located within the Irbid Governorate in the northern part of Jordan (Figure 9). Its area is approximately 16 km2 and its population is about 13,000. The area is mountainous and for this reason water is distributed through the supply water network using electrical pumps. Complete records of the year 1998 were used in these analyses of the water losses. The records of the Water Authority of Irbid indicate that water losses reached 54.2% during the studied period. Analyses of the records revealed that:
About 92% of the families of the beneficiaries were composed of 8 persons.
Water services reach 90.4% of the inhabitants.
The length of the water supply network pipelines is 27 km. According to operation and maintenance records, about 20% of the supply network pipes are older than 30 years and are in a medium to good condition. The remainder, 80%, is almost new.
Water is supplied through three wells about 500 m away from the city.
From an economic perspective, the relationship between high prices of a “Normal Good” and its consumption rate is inversely related while the relationship is directly related between income and consumption rate. For an “Inferior Good” the relationship is inverse between income and consumption rate. Consumed water can be evaluated using the following equation:
 (6)
(6)
where:
Wc: Consumed water P: price of water Y: Income Ed: Educational level F: Number of persons in the family G: Garden Using the above equation, and taking into consideration that the most effective variables on water consumption in Neamie city are: the number of persons within the family and their educational level, the existence of a garden, the price of water and the family income.
Three months of records for July, August and September, 1998 were analyzed (Tables 9-11). During the summer the quantity of supplied water increased to 140,000 m3 i.e. an increase of 64,000 m3 over winter figures (46%). This indicates a strong relationship between the season and the quantity of consumed water. It was also noticed that, according to these tables, the allocation per capita per day was 96 l. Using the records indicates that the percentage of losses reaches 48.9% in Irbid Governorate and 55% in Neamie city. Using water meter readings, water losses reached 58.1% where the consumed water was 58,590 m3 with a difference of 6451 m3.
It was also noticed that the type of consumed water were 93.6% household use, 2.3% commercial, 2% governmental, 1.3% agricultural and 0.8% industrial uses. In addition 59% of the consumers had gardens with an area of 1000 to 1500 m2. Most of the gardens were planted with olive, fig, grapevines and some ornamental trees. Rural consumers formed 0.9% and the total area of their farms was 472 acres. About 77% of the water counters were not properly protected, 17.2% of them were not working and 6% of them were not properly working. Furthermore, 5.6% of the water counters were installed in the opposite direction, or there was a by-pass before the counter or they were tampered with.
To calculate the technical losses, all the malfunctions during the investigated period were studied through the operation and maintenance reports. Since there was no accurate measure or standard to determine the losses, the following equations were used:
 (7)
(7)
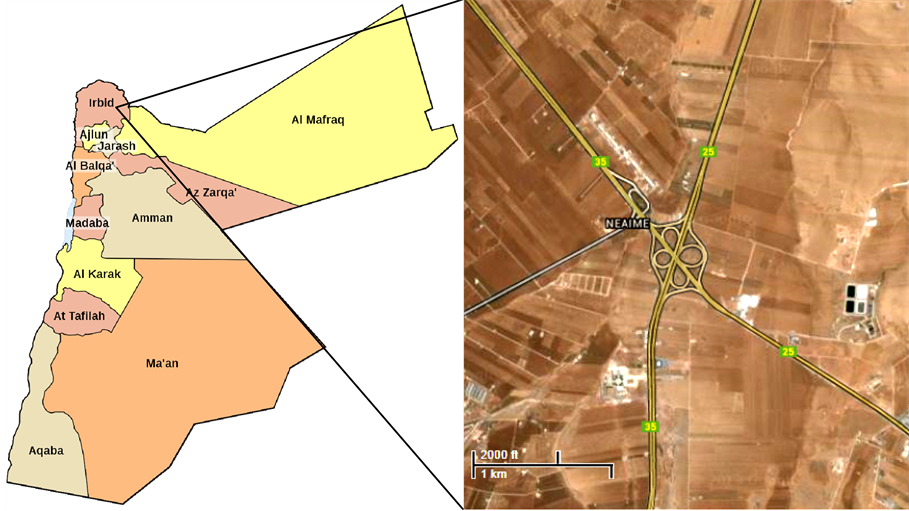
Figure 9. Location map of Neamie city.
Table 9. Water losses in Neamie city in 1998 assuming water year starts October 1997 till September 1998.

Table 10. Three months analyses for actual water readings of consumed water for the period July-September, 1998.
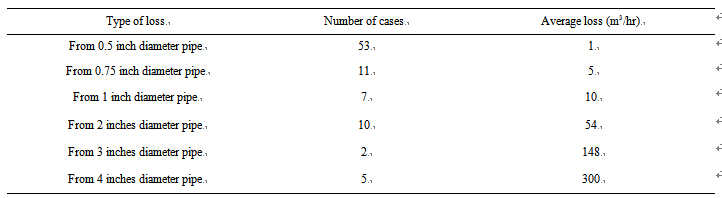
Table 11. Type of water losses during the investigated period.
where:
WTl: Water lost in cubic meters Wo/t: Average loss per unit time (minute)
T: Time
 (8)
(8)
where:
WL: Quantity of water lost
∑NL: Number of malfunctions i: Diameter of pipe T: Time The results showed that the quantity of water lost was 15,243 m3 which is equal to 10.9% of the total supplied water for the period July-September and it was 18% of the total water lost that year.
The quantities of lost water due to administrative errors were calculated using the records and it is the difference between the quantities actually consumed, and the amount of water sold. This quantity was 6,451 m3 representing 4.6% of the total supplied water. Water quantities lost due to errors of officers reading the water counters were about 1893 m3 which represents 1.4% of the total water supply. As far as the water counters that are not functioning are concerned, this caused the loss of 6634 m3 representing 4.7% of the total water supplied. Finally, the losses due to illegal use of water were calculated by adding all the losses and subtracting it from the total loss. This indicated that it was 50968 m3 representing 36.5% of the total supplied water. This quantity was the highest compared to other types of losses.
5. Discussion
There is no international unified recipe to reduce water losses that can be applied or used. Several different methods can be used to reduce the losses. This depends on several factors; the most important is the technical conditions, and economic potential of the Water Authority, in addition to the desirable size of the reduction in losses. This problem of overcoming the water losses is the most important problem facing all countries without exception.
The strategy for reducing water losses depends directly on the management techniques used in the water sector. Before thinking about finding new water sources or establishing new pumping stations or drilling of new wells to meet the growing water needs, we must think how we can draw on all the capabilities and potential to reduce water losses. This will provide significant quantities of water that already exist within the network to the public. It does not cost a lot of either effort or funds or require extra extraction, processing, distribution and transport. To reduce the losses we have to secure the economic base, technical competence administrative structures. Therefore there are many of the administrative, technical solutions and economic measures that can be adapted to solve the problem.
These measures can be summarized as follows:
1) Administrative measures
These measures are as important as technical measures to reduce water losses. A secure economic, well qualified and efficient administrative and technical staff can greatly improve the administration of the water authority. This can be achieved by:
Setting a special law and regulations for the water authority. This will improve the action of the authority.
Restructuring the water authority. Although the water authority enjoys the independence on financial and administrative levels, but its budget is subject to the procedures and provisions that apply to any ministry or government department. The water authority should be restructured on the basis of actual financial and administrative independence, without the intervention of the Ministry of Water and Irrigation, or any other governmental entity, and therefore will allocate the money necessary to overcome the water losses and can have a good selection process to get highly qualified staff.
Granting other water departments of the Water Authority the required autonomy in the implementation of water projects and make decisions that work to reduce water losses.
Improving the internal administrative staff by selecting highly qualified and trained personnel Financial incentives should be used to encourage staff to increase productivity. Intensive training programs should be implemented for the rehabilitation of the staff as well as to train them using international experts and try to learn from experiences of developed countries.
Reconsidering consumers contracts so that they hold the responsibility of excessive unjustified water wasting and be subject to the issue of accountability and trial for illegal water use. Each consumer should have a file. In this file full information about the consumer (e.g. monthly consumption rate, number of family members, annual income, unserved area, and type of water use) and the documentation of the public network on the ground. Under charts and maps mounted with locations and type and size of pipes, fittings and knowing conduct of the pipeline and that part buried in the ground to avoid long time search through the site for waterproofing, in order to speed in finding water losses in the cases of faults for maintenance and repair and that will reduce water losses.
2) Technical Measures
New technologies should be adopted in finding covered (under surface of ground) seepages or leakages.
The life span of the water supply network should be considered.
Human capacity building program is to be adopted for workers in the maintenance of public networks on scientific grounds, through the provision of qualified technical personnel.
Providing suitable methods and materials for maintenance.
Maintenance groups should work round the clock to repair leaks and monitor the distribution network.
Periodic maintenance of the water counters at home should be carried out and protecting these counters from adverse weather (e.g. major waves of snow).
Adopting the idea of pumping water to water central tanks, and then to the public network, rather than direct pumping to the network which requires high pressure. High pressure reduces the accuracy of the counters, and potential damage to the network. In addition, it will avoid the destruction of counters and leakage of weak sites in the public network.
Discontinuous pumping of water to the public network should be avoided because it helps to form a rusty layer in the metallic parts of the water counters and the pipes of the network.
Water counters should be installed in accessible locations so that water authority personnel can monitor them and pin point any illegal acts to bypass these counters.
3) Economic Measures
The water authority should adopt water demand management, which includes direct and indirect actions to monitor water use that affects the behavior of the consumer. This includes financial incentives, and public awareness. Such programs are considered as of low-cost projects but they are effective in reducing water losses.
Public awareness programs should be adopted and should address all the public sectors.
Internal and external monitoring teams should be established to monitor performance. Water quality and economic distribution methods should be adopted. These teams should monitor all systems of accounting, financial conditions, legal and the economic situation of the authority and check monthly and annual reports. They should set highly effective economic and financial indicators to measure the performance level of the water authority.
Water prices should be set on the basis of the overall cost. It is assumed that the revenues from the water should cover the cost of production. Restructuring of water rates on the basis of total cost of production will reduce the losses, in addition to the reduction of unjustified water consumption.
Privatization of some of the duties of the water authority will raise the performance in the water sector. As an example the monitoring and maintenance operations could be given to the private sector.
6. Conclusion
Thirteen years of complete records of the Jordanian Ministry of Water and Irrigation were investigated. Furthermore, water losses in Neamie city were also analyzed as a case study. The data analyzed from these records showed that Jordan is severely suffering from a water shortage problem. This problem is expected to intensify in future due to the effect of global climatic change. It was also noticed that water losses through the distribution network reach about 50%. To overcome this problem, a water demand strategy should be adopted. Water allocation to the agricultural sector should be decreased due to the fact that most of the water is consumed by this sector. In addition, minimizing the water losses will save huge quantities of water and revenue. Technical, administrative and economic measures to be taken by the Ministry of Water and Irrigation were also identified in this research project.
Acknowledgments
Most of the work presented in this paper forms part of the second Author’s Master Dissertation submitted to Al al-Bayt University in Jordan. Thanks to Dr. Ali El-Naqa of the Hashemite University, Jordan for his assistance. Professor Ian Foster of Northampton University gratefully revised the paper and gave fruitful suggestions. The research presented has been financially supported by Luleå University of Technology, Sweden and by “Swedish Hydropower Centre SVC” established by the Swedish Energy Agency, Elforsk and Svenska Kraftnät together with Luleå University of Technology, The Royal Institute of Technology, Chalmers University of Technology and Uppsala University. Their support is highly appreciated.
REFERENCES
- R. Liemberger, “The New German Water Loss Regulations in Context with Other International Applications of the IWA Water Balance and Real Loss Performance Indicators,” IWA Conference, Limassol, 2002.
- A. O. Lambert and M. Fantozzi, “Recent Advanced in Calculating Economic Intervention Frequency for Active Leakage Control, and Implication for Calculation of Economic Leakage Levels,” IWA International Conference on Water Economics, Statistics and Finance, Greece, 8-10 July 2005.
- H. Sewilam, “Capacity Development for Drinking Water Loss Reduction: Challenges and Experiences,” UN-Water Decade Programme on Capacity Development, United Nations University, 2011.
- J. Koelbl and R. Gschleiner, “Austria’s new guideline for water losses”, Water Supply Networks and Pipelines, 2009.
- N. A. Al-Ansari, S. Al-Oun, W. Hadad, and S. Knutsson, “Water Loss in Mafraq Governorate, Jordan”, Journal of Natural Science, 2013, Vol. 5, No. 3, pp. 333-340. http://dx.doi.org/10.4236/ns.2013.53046
- M. Fantozzi, A. Pretner and D. Marshallsay, “Management Optimization of Water Distribution Systems: The TILDE Project (Tool for Integrated Leakage Detection),” In: A. Hamdy and R. Monti, Ed., Food Security under Water Scarcity in the Middle East: Problems and Solutions, CIHEAM-IAMB, Bari, 2005, 444 p.
- M. Tabesh, A. H. Asadiyani Yekta and R. Burrows, “An Integrated Model to Evaluate Losses in Water Distribution Systems,” Water Resources Manage, Vol. 23, No. 3, 2009, pp. 477-492. http://dx.doi.org/10.1007/s11269-008-9284-2
- Jordan’s Water strategy, “Water for Life,” Jordan’s Water Strategy 2008-2022, 2008. http://web.idrc.ca/uploads/user-S/12431464431JO_Water-Strategy09.pdf
- UNESCO, “Managing Water under Uncertainty and Risk,” The United Nations World Water Development, Report 4, Chapter 39, 2012.
- FAO (Food and Agriculture Organization of the United Nations), “Irrigation in the Middle East Region in Figures: AQUASTAT Survey 2008,” FAO, Rome, 2008. www.fao.org/nr/water/aquastat/countries_regions/jordan/jordan_cp.pdf
- N. A. Al-Ansari. N. Alibrahiem, M. Alsaman and S. Knutsson, “Water Demand Management in Jordan,” Journal of Engineering, Vol. 6, No.1, 2014, pp. 19-26.
- S. Haffner, D. Bley, G. Klein and K. Rudolph, “Water Supply and Sanitation Systems—the First Point of Action,” In: H. Sewilam, Ed., Capacity Development for Drinking Water Loss Reduction: Challenges and Experiences, UN-Water Decade Programme on Capacity Development, UN University, 2011.
- P. Rogers and P. Lydon, “Water in the Arab World,” Massachusetts, Harvard University Press, Cambridge, 1994.
- A. K. Biswas, “International Waters of the Middle East —From Euphrates, Tigris to Nile,” Oxford University Press, Bombay, 1994.
- N. A. Al-Ansari, “Water Resources in the Arab Countries: Problems and Possible Solutions,” UNESCO International Conference on World Water Resources at the Beginning of the 21st Century, Paris, 3-6 June 1998.
- N. A. Al-Ansari, “Management of Water Resources in Iraq: Perspectives and Prognoses,” Journal of Engineering, Vol. 5, No. 8, 2013, pp. 667-68.
- C. C. Cherfane and S. E. Kim, “Arab Region and Western Asia, UNESCWA, in Managing Water under Uncertainty and Risk,” UN World Water Development Report 4, Chapter 33, 2012.
- J. Barr, S. Grego, E. Hassan, M. Niasse, W. Rast and J. Talafré, “Regional Challenges, Global Impacts, in Managing Water under Uncertainty and Risk,” UN World Water Development Report 4, Chapter 7, 2012.
- J. C. Perry and J. Bucknall, “Water Resource Assessment in the Arab World: New Analytical Tools for New Challenges,” In: N. J Jagannathan, A. S. Mohamed and A. Kremer, Eds., Water in the Arab World: Management perspectives and Innovations, World Bank, Middle East and North Africa Region, Washington, 2009.
- R. Alkhaddar, W. Sheely and N. A. Al-Ansari, “Jordan’s Water Resources, Supply and Future Demand,” Water International, Vol. 30, No. 3, 2005, pp. 1-11. http://dx.doi.org/10.1080/02508060508691870
- Aquastat, FAO, “Countries, Regions, Transboundary River Basins,” Jordan, 2013. http://www.fao.org/nr/water/aquastat/countries_regions/JOR/index.stm
- Ministry of Water and Irrigation, Annual Report, 2011.
- M. Nimah, “Water Resources,” In: Tolba and N. Saab. Eds., Arab Environment and Future Challenges, Chapter 5, the Arab Forum for Environment and Development, 2008.
- M. El-Fadel and R. Maroun, “Virtual Water Trade as an Adaptation Demand Management of Climate Change Impact on Water Resources in the Middle East,” In: F. Zereini and H. Hotzl, eds., Climatic Changes and Water Resources in the Middle East and North Africa, Springer, Berlin, 2008, pp. 93-108. http://dx.doi.org/10.1007/978-3-540-85047-2_9
- M. Hiniker, “Sustainable Solutions to Water Conflicts in the Jordan Valley,” Green Cross International, Geneva, 1999.
- A. K. Sadik and S. Barghouti, “The Water Problems of the Arab World: Management of Scarce Water Resources,” In: P. Rogers and P. Lydon, eds., Water in the Arab World, Harvard University Press, Cambridge, 1994, pp. 4-37.
- S. Postel, “Last Oasis—Facing Water Scarcity,” World Watch Institute WW Norton & Co, New York, 1992.
- B. Charrier and F. Curtin, “A Vital Paradigm Shift to Maintain Habitability in the Middle East: The Integrated Management of International Watercourses,” Water for Peace in the Middle East and Southern Africa, Geneva: Green Cross International, 2007.
- E. Salameh and P. Udluft, “Towards a Water Strategy for Jordan,” Hydrogeologie und Umwelt, Wurzburg, 2001.
- W. Owens and K. Brunsdale, “Solving the Problem of Fresh Water Scarcity in Israel, Jordan, Gaza and the West Bank,” Water for peace in the Middle East and Southern Africa, Green Cross International, Geneva, 2000, pp. 67-74.
- WRI, World Resources Institute, “Drylands, People, and Ecosystem Goods and Services: A Web-Based Geospatial Analysis,” 2002. http://www.wri.org
- IPCC (Intergovernmental Panel on Climate Change), “Climate Change Impacts, Adaptation and Vulnerability,” Cambridge University Press, Geneva, 2007.
- N. A. Al-Ansari and S. Baban, “Rainfall Trends in the Badia Region of Jordan,” Surveying and Land Information Science, Vol. 65, No. 4, 2005, pp. 233-243.
- N. A. Al-Ansari, E. Salameh and I. Al-Omari, “Analysis of Rainfall in the Badia Region, Jordan,” Al-Bayt University Research Paper No.1, 1999, 66 p.
- N. A. Al-Ansari, B. Al-Shamali and A. Shatnawi, “Statistical Analysis at Three Major Meteorological Stations in Jordan,” Al Manara Journal for Scientific Studies and Research, Vol. 12, 2006, pp. 93-120.
- M. Medany, “Impact of Climate Change on Arab Countries,” Chapter 9, 2008. www.afedonline.org/afedreport/english/book9.pdf
- T. Oweis and A. Hachum, “Water Harvesting and Supplemental Irrigation for Improved Water Productivity of Dry Farming Systems in West Asia and North Africa,” New Directions for a Diverse Planet, Proceedings of the 4th International Crop Science Congress, Brisbane, 26 September-1 October 2004, Published on CDROM, 2004. www.cropscience.org.au .
- K. A. Voss, J. S. Famiglietti, M. H. Lo, C. Linage, M. Rodell and S. Swenson, “Groundwater Depletion in the Middle East from GRACE with Implications for Transboundary Water Management in the Tigris-EuphratesWestern Iran Region,” Water Resources Research, Vol. 49, No. 2, 2013, pp. 904-914. http://dx.doi.org/10.1002/wrcr.20078
- B. Charalambous, “Leakage Management: A Practical Approach,” HHBS, 2002.
- Water Authority of Jordan (WAJ), “Analysis of Water Systems in the Mafraq Governorate, Final Report,” Main Report, Prepared with SAFEGE and SIGMA and Financed by French Government, Jordanian Ministry of Water and Irrigation, Amman, 1998.
- N. Akel, “Water Crises and Industrial Production,” 1st Edition, Moasasat al Murshed for Advertisement and Publications, Amman, 2005.
- World Bank, “Water Sector Review,” Report No. 17095-JO. World Bank, Washington, DC, 1997.
- L. C. Stephen and B. D. Brooks, “Watershed, the Role of Fresh Water in the Israeli-Palestinian Conflict,” International Development Research Center, Ottawa, 1994.
- S. Sharma, “Water Losses in the Distribution System: Performance Indicators of Water Losses in Distribution System,” 2008. http://www.switchurbanwater.eu/outputs/pdfs/GEN_PRS_PI_of_Water_Losses_AC_Apr08.pdf
- N. A. Fawah, “Economics of Drinking Water in Jordan,” MSc. Thesis, University of Jordan, Jordan, 1996. (Unpublished)
- Ministry of Water and Irrigation (MWI), “Study of Water Losses in Jordan,” Ministry of Water and Irrigation, Amman, 1998.
NOTES
*Corresponding author.