Journal of Water Resource and Protection
Vol.5 No.6(2013), Article ID:33044,13 pages DOI:10.4236/jwarp.2013.56060
Phosphorus Mass Balance of the Illinois River Watershed in Arkansas and Oklahoma
1Department of Agricultural and Biological Engineering, Purdue University, West Lafayette, USA
2Alexander Consulting 5802 South 129th East Avenue, Tulsa, USA
3Lithochimeia, Inc., 110 West 7th St., Tulsa, USA
4CDM, Inc. 1331 17th Street, Denver, USA
Email: *lamah@purdue.edu, engelb@purdue.edu, mbsmith@flash.net, bfisher@lithochim.com, olsenrl@cdm.com
Copyright © 2013 Bernard Engel et al. This is an open access article distributed under the Creative Commons Attribution License, which permits unrestricted use, distribution, and reproduction in any medium, provided the original work is properly cited.
Received April 13, 2013; revised May 15, 2013; accepted June 9, 2013
Keywords: Phosphorus; Nonpoint Source Pollution; Lake; Watershed
ABSTRACT
Water quality degradation in the Illinois River Watershed (IRW) has been linked to excess nutrients, primarily phosphorus (P). A mass balance study was performed on the IRW in Oklahoma and Arkansas to quantify the magnitude of P entering the watershed between the closure of Lake Tenkiller’s dam in 1954 to 2006. Results showed that a substantial mass of P was, and is, being imported into the watershed relative to the mass of P leaving the watershed. The study demonstrated that poultry production has been the major contributor of P imported to the watershed since 1964, and is currently responsible for more than 76% of the net annual P additions to the IRW. Between 1949 and 2002, more than 200,000 tonnes of P was added to the IRW. A P delivery ratio for the IRW was computed from the mass balance results and observed loads indicating that 4% of annual P applied to the IRW landscape reached Lake Tenkiller between 1999 and 2006. Allocation of P loads from 1949 to 2002 to Lake Tenkiller computed with the delivery ratio showed that wastewater treatment plant (WWTP) discharges were responsible for more than 50% of P reaching Lake Tenkiller in 1949, followed by dairy cattle (32% of loads). Poultry contribution to P reaching Lake Tenkiller was 5% in 1949 but increased rapidly to become the largest source in 1969 at approximately 49%, and in 2002 at 54%. Both dairy and WWTP portions of the loads declined from 1949 levels with less than 4% attributable to dairy and less than 34% assigned to WWTP in 2002.
1. Introduction
The Illinois River Watershed (IRW) encompasses nearly 4257 square kilometers in northeast Oklahoma and northwest Arkansas (Figure 1). Land uses in the IRW are dominated by agricultural activities (poultry and beef cattle production, with minor dairy and swine production) and forests. Urban areas in the IRW are located largely along the watershed’s northeastern boundary. The watershed spans seven counties and feeds the largest reservoir in Eastern Oklahoma, Tenkiller Ferry Reservoir (locally known as Lake Tenkiller). The Illinois River was designated a “Wild and Scenic River” by the State of Oklahoma in 1970 and benefits from protections this designation provides. This promotes tourism in the IRW, which sees its peak between April and September when stream flow and temperatures are best for river activities [1]. The main recreational activities in the watershed are canoeing/kayaking, camping, fishing, hiking, hunting, horseback riding, wildlife viewing, and sightseeing.
Reports of diminishing water quality caused by eutrophication of Lake Tenkiller and the water quality degradation of the Illinois River and its tributaries have prompted concerns from both local citizens and state officials [2-5]. Eutrophication has been attributed to excess nutrients, specifically phosphorus (P) in fresh water systems [6]. These concerns resulted in a series of Total Maximum Daily Loads (TMDLs) to reduce P loads in the Illinois River segments that are currently on the States of Oklahoma’s and Arkansas’ 303(d) list for TP; http://www.aquaterra.com/projects/descriptions/illinois.php.
Several prior studies of the IRW attempted to identify the potential sources of P reaching the IRW streams and rivers and Lake Tenkiller [3,7-9]. Point source discharges
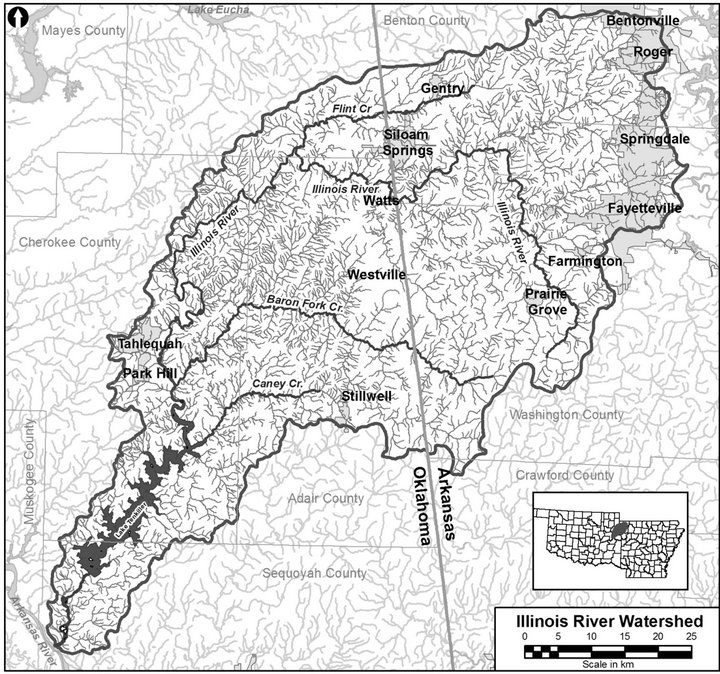
Figure 1. Illinois river watershed in southwest Arkansas and northeast Oklahoma.
of P into the IRW waters, while not the majority of P discharge, have been reduced in recent years as WWTP facilities have been upgraded and P limits were placed on WWTP discharges [3]. Non-point sources (NPSs) of P that have been identified include livestock production (poultry, cattle, dairies, swine), recreation, on-site waste disposal from septic systems, in-stream gravel mining, bank erosion, nurseries, and urban runoff. Poultry waste application within the IRW to pastures has been identified as a substantial contributor to overall P loads within IRW streams and rivers and Lake Tenkiller [5,10].
Poultry production operations within the IRW produce a substantial amount of poultry waste containing P. Poultry waste produced within the IRW range between 317,500 and more than 454,000 tonnes annually [11]. Because poultry feed formulations consistently include the addition of substantial amounts of calcium phosphates (typically dicalcium phosphate, defluorinated rock phosphate or tricalcium phosphate), poultry wastes contain high concentrations of P. The combination of fecal droppings, bedding material, feather waste, feed and soil, referred to as poultry litter [12,13], typically contains about 2% by weight of total P [13-15]. As a consequence, the P content of poultry waste in the IRW ranges from 3.95 million to nearly 4.54 million kilograms annually. With few exceptions, the preferred practice for poultry waste disposal is land application to pasture and cropped areas near poultry production farms [16,17], and nearly all poultry waste generated within the IRW is land disposed within the IRW by broadcast and spreading [11].
Tortorelli and Pickup [18] and Pickup et al. [19] used LOADEST (load estimator software) [20] to compute P loads between 1997 and 2004 at the Illinois River and Baron Fork USGS observation stations within the IRW (Figure 1). The authors found that observed P loads to Lake Tenkiller were greater per unit area than that for other watersheds in the region. Pickup et al. [19] indicated that average annual P load entering Lake Tenkiller was about 262,000 kilograms per year, and more than 86% of this load, which is predominately NPS P, was transported to the lake by runoff.
The study of the movement of P in and out of a watershed (e.g., a mass balance analysis) provides insight into the primary sources of P within that watershed, and provides context for estimating the potential for the movement of P to streams, rivers and lakes within a watershed as many investigators have previously found an association between P mass balance and NPS P loads to water bodies (e.g, Slaton et al. [10], Nelson et al. [21]; Bennett et al. [22]).
Bennett et al. [22] calculated a P budget for the agriculture-dominated Lake Mendota watershed located in Wisconsin and found that approximately 34,000 kg of P reach the lake annually. Similar mass balance approaches were used to estimate accumulation of nutrients in North Carolina watersheds [23,24]. Jaworski et al. [25] conducted a nutrient mass balance for a watershed finding animal waste and fertilizer to be the largest sources of P inputs to the watershed with animal waste contributing 60% of total P watershed inputs. McMahon and Woodside [26] found that livestock were the largest source of P inputs to a watershed at 50% for a watershed mass balance. Harned et al. [27] found livestock waste was the largest contributor to P inputs into the Mobile River Watershed.
The accumulation of excess P in soils creates conditions for increased P delivery to surface and groundwater. Thus, Fluck et al. [28] reported that the accumulation of P within the Lake Okeechobee watershed is likely to contribute to P reaching the lake. Other studies also demonstrated that P levels in runoff were positively correlated with soil P levels [10,29-33]. Slaton et al. [10] indicated that a fundamental component of nutrient management strategies is to determine the balance between nutrient inputs and outputs to identify areas where soil nutrient inputs are greater than removals. Many of these “critical areas” coincide with areas subject to concentrated animal production [10]. In a detailed budgeting analysis of P containing materials, Fluck et al. [28] reported that net P imports to the watershed are primarily the result of agricultural activities. Agricultural activities such as poultry farms were found to provide the greatest P surpluses [34], with an annual surplus of 65 kg P per ha, which may present a potential hazard to surface water quality [35].
Based on a national nutrient balance assessment, Kellogg et al. [36] and Kellogg [37] found the Illinois River Watershed, northwest Arkansas, and northeast Oklahoma as being vulnerable and prone to P losses in runoff due to excess manure being land applied. Accumulated P in northwest Arkansas soils for a 5 year period was estimated to be 32 kg/ha [10]. Nelson et al. [21] estimated nearly 1,234,000 kg of P were annually applied to the landscape in the Arkansas portion of the IRW, of which about 1,030,000 kg originate from poultry litter application to pastures, representing approximately 83% of P inputs to the watershed.
Nutrient mass balance data can be used to determine masses of nutrients reaching water bodies, as well as to allocate nutrient loads to their sources. Alternatively, pollutant export coefficients may be used [38-40]. For example, Daly et al. [41] used observed P load data and watershed characteristics (land use, soil type, and soil P data) to derive coefficients for modeling P loads from other watersheds. Winter and Duthie [42] calculated P losses from an approximately 75 km2 watershed using a coefficient based modeling approach and found that modeled P losses were within 7% of observed values. Similarly, Johnes and Heathwaite [43] used an export coefficient based model to examine the impacts of land use changes on P losses.
In freshwater systems, the presence of an excess of P is nearly always the cause of eutrophication, and P control is critical to mitigating eutrophication. The work presented in this study is a P mass balance analysis of the IRW in Oklahoma and Arkansas.
The study was motivated by the eutrophication and aquatic habitat degradation of surface waters within the IRW, with the purpose to identify the primary source(s) of P causing this eutrophication and aquatic habitat degradation in the watershed
2. Materials and Methods
2.1. Mass Balance for P Loads
A P mass balance study was performed on the IRW to quantify the most significant sources of P entering the watershed between the closure of Lake Tenkiller’s dam in 1954 to 2006. The approach and data sources used in this study were consistent with those discussed in the nutrient mass balance literature (e.g., von Bernuth and Salthouse [44], Nelson et al. [21]). The most significant sources of P flows into the IRW were identified from previous studies of the IRW and other watersheds in the region, and analysis of IRW data. The USDA Agricultural Census data on livestock production and nutrient excretion values were used to compute net P additions to the watershed for livestock. Following Slaton et al. [10], cattle grazing in the watershed are not introducing new P to the watershed, and thus only the feed imported into the watershed for supplemental feeding of grazing cattle was attributed to cattle.
Figure 2 shows the most significant P additions to and removals from the IRW. The data sources for computing the P imports and exports are identified in Table 1. Livestock numbers were obtained from the USDA Agricultural Census for each of the counties in the watershed. For some counties, only a portion of the county was within the watershed. For these counties, livestock within the watershed were apportioned to the watershed based on the proportion of pasture within that county that was also within the watershed. Livestock within the IRW are linked to pastures. This includes poultry due to the use of pasture for poultry waste disposal. Land use data for obtaining pasture data were the USGS land use land cover data for 2001. The assumption regarding poultry allocation to the IRW was validated using poultry house location data described in a section below. Livestock populations contributing P to the Illinois River Watershed since 1949 are shown in Table 2.
Net P additions to the IRW from livestock were computed based on livestock populations (shown in Table 2), weight of livestock, and values for P in livestock waste. The mass of poultry waste generated and its P content from poultry houses in the Eucha-Spavinaw watershed
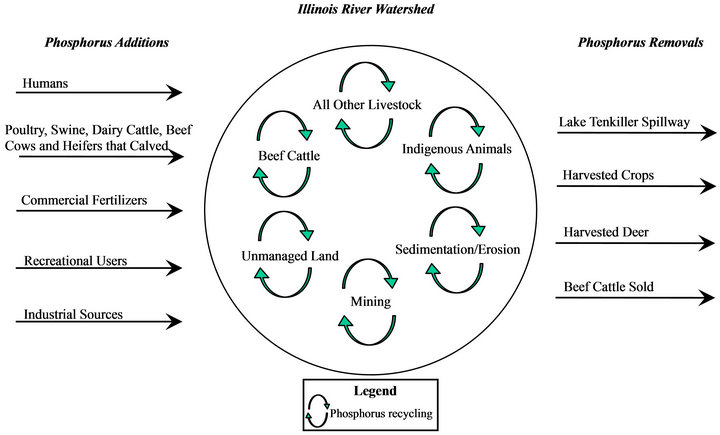
Figure 2. Phosphorus mass balance flow diagram for the illinois river watershed.

Table 1. Data sources used in mass balance analysis.
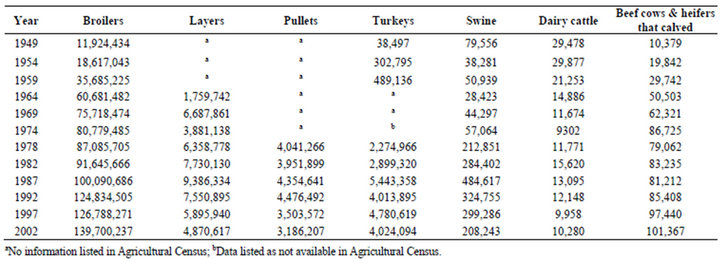
Table 2. Livestock populations in the Illinois river watershed compiled from USDA census data.
(adjacent to the IRW) were analyzed and coefficients were determined to quantify poultry waste and P content by type of poultry. Phosphorus waste content for other livestock was obtained from the USDA Agricultural Waste Management Field Handbook [46]. Contribution from grazing cattle was computed based on supplemental cattle feed recommendations by the Oklahoma State University Extension program [45] and IRW cattle population. Commercial fertilizer sales between 1951 and 2002 at the county level were obtained from Arkansas and Oklahoma (Table 3), and allocated to the watershed based on proportion of pasture and cropped land in the IRW (cropped land represented less than 600 ha in the watershed). Industrial P discharges for each year were obtained from discharge permit data (Table 1). Phosphorus from humans was computed from human populations obtained from the US Census and a P coefficient for humans reflecting P in excrement and laundry and other household uses [46]. Phosphorus from visitors to the IRW was computed based on the annual visitors and length of stay to the watershed (Caneday, personal communication) and the P coefficient for humans [46].
Phosphorus removed from the IRW by cattle was computed based on cattle population, cattle weight, and the amount of P in cattle [47]. A similar approach for deer was used to estimate P removed by deer harvested. Deer kills were obtained from state agencies in Oklahoma and Arkansas that track deer harvests (Table 1). Phosphorus removed in crops harvested within the IRW was computed from the cropped area (USDA Agricultural Census data) and coefficients representing the amount of P in crops (NRCS; npk.nrcs.usda.gov). Phosphorus leaving Lake Tenkiller in flow through the spillway was computed for the period of 1999-2006 based on P concentrations in the outflow and volume of flow.
Poultry population within the IRW was also computed through identification of active poultry house facilities in the watershed. Potential poultry house locations were identified from aerial photography (obtained in 2005; [11]). Active houses and the types of birds produced in the active houses were identified through examination of county tax records for Oklahoma and Arkansas, Oklahoma Department of Agriculture Food and Forestry poultry registration records, industry records and field investigation. The length and width of each active house was measured on the air photo using standard GIS tools, and these data were used to calculate the area for each type (broiler, hen, pullet, turkey) of active poultry house. The locations of active poultry houses identified using this process are shown in Figure 3 (note that each location in the figure has multiple houses).
In order to estimate the number of type of poultry produced within the IRW, data regarding the number of birds of each type produced per unit area of poultry house per

Table 3. Annual P additions (in tonnes) to the IRW based on estimated commercial fertilizer sales between 1951-2002 for the IRW in Oklahoma and Arkansas.
unit time were obtained. These data were derived from a comprehensive set of nutrient management plans (NMPs) for the Eucha/Spavinaw watershed (a smaller watershed, north of and immediately adjacent to the IRW) which had the same type of poultry operations as found in the IRW. Each farm’s NMP provided data regarding: 1) type of poultry produced, 2) number of houses in operation at the farm or location, 3) bird capacity of each poultry house, and 4) annual number of flocks produced. The estimates of the number of birds produced per unit area of poultry house per unit time for each type of poultry obtained from these data were combined with the photogrammetric and other data from the IRW to compute the number of birds of each type produced within the IRW. The results of this computation are provided in Table 4. Additional buildings that were identified as poultry production facilities in which poultry production was not confirmed were excluded from the data in Table 4 [11]. These estimates are based on reported house capacity. Consequently, they would be expected to be slightly larger than actual production. These estimates of poultry production, which total approximately 184,900,000 birds of all types, are only about 8% higher than the reported industry number of birds for the year 2005 of 170,836,000.
Poultry production data provided by the poultry industry indicated that poultry population in 2002 within the IRW was 145,267,000, which is within 5% of values computed from USDA Agricultural Census data for the same year (approximately 151,781,000 from Table 2). Industry data were unavailable for other years in which census data were available. These analyses confirmed the validity of the approach used in distributing USDA Agricultural Census poultry populations to the IRW as well as the photogrammetric/records review/on-ground inves-

Figure 3. Locations of active poultry houses in the Illinois river watershed.

Table 4. Estimated 2005 poultry production within the IRW based on photogrammetric data, records review and onground investigation.
tigation approach to estimating poultry production.
2.2. Phosphorus Delivery Ratio and Allocation of P Loads
A nutrient mass balance identifies the flows of nutrients into and out of an area such as a watershed. To quantify the movement of these nutrients to water bodies, further analysis is required. A quantification approach that uses delivery ratios can be used to link watershed nutrient inputs and delivery of nutrients to water bodies. A delivery ratio for P within the IRW was computed from the annual mass of P imported (net), P discharged to streams and rivers by waste water treatment plants (WWTPs), and observed P loads to Lake Tenkiller between 1999 and 2006. This P delivery ratio can be used to allocate P reaching water bodies to the sources of P imported into a watershed [21,40,41].
The difference in total P loads at the gauging stations nearest to Lake Tenkiller and the WWTP discharges can be attributed to NPS sources of P. Of course this assumes that all WWTP discharges of P reach the gauging stations closest to the lake. Note that this assumption will likely underestimate NPS P contributions. With this assumption, the P delivery ratio for the IRW is:
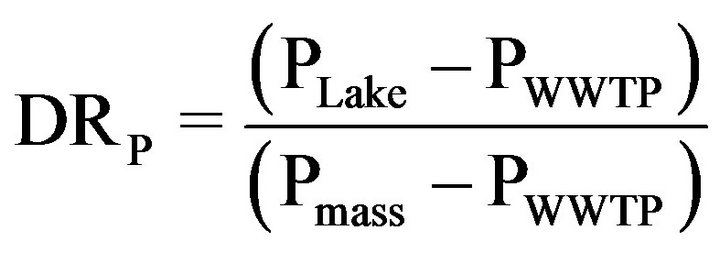
where DRP is annual P delivery ratio; PLake is P mass reaching Lake Tenkiller; PWWTP is P mass coming from WWTPs; and Pmass is annual mass of P imported.
The P loads to Lake Tenkiller were computed using the approach described by Tortorelli and Pickup [18] and Pickup et al. [19] that used LOADEST (LOAD ESTimator software) [20]. Loads were estimated by multiplying daily streamflow by corresponding P concentrations using linear regression [18]. Phosphorus concentrations were determined through laboratory analysis from discrete water-quality samples collected over several years [18,19]. Observed P concentrations from USGS and the Oklahoma Water Resources Board (OWRB) water quality samples, and USGS stream flow data were used to compute observed P loads between 1997 and 2006 at the USGS gauging stations nearest to Lake Tenkiller (Table 5).
A portion of the P in the IRW rivers and streams reaching Lake Tenkiller is from WWTP discharges. Total P discharges from WWTPs discharging into the IRW were subtracted from total P masses at the USGS gauging stations to determine NPS P contributions to IRW surface waters. Recent discharges from WWTPs were computed from WWTP discharge data (1999-2007), Permit Compliance System (PCS) data) from the Oklahoma Department of Environmental Quality and the Arkansas Department of Environmental Quality. WWTP discharges prior to 2003 were supplemented with data obtained from Gade [9]. Changes in WWTP technology significantly reduced P contributions beginning in 2003. From the late 1990s to 2003, WWTP P discharges were 92,500 kg annually and were reduced to a little more than 40,800 kg annually starting in 2003.
Allocation of P loads to sources was completed using the computed P delivery ratio for the IRW and the P mass balance data. Multiplication of the annual import of P into the watershed by the delivery ratio allowed identification of the mass of P delivered to Lake Tenkiller in that year. Summing these sources and the WWTP contribution provides the total P delivered to Lake Tenkiller. From these data, the allocation percentages of P sources were computed.
3. Results and Discussion
3.1. Mass Balance
The largest sources of P inputs into the IRW from 1949 through 2002 are shown in Table 6. For the most recent period, poultry contributed more than 75% of P additions to the IRW, followed by commercial fertilizer (~7%), dairy cattle production (~5%), and humans (~3%). Cattle are included in this table because overall they are a net contributor to P inputs to the watershed due to supplemental feed. A portion of the human and industrial P sources are directly discharged into the waters of the IRW through WWTPs.
The primary sources of P addition to the IRW have changed significantly from the closure of the Lake Tenkiller dam in 1954 to the most recent period. In the late 1940s and 1950s, dairy represented the primary source of P addition to the IRW. By the 1960s, poultry was the largest source of P addition to the IRW, with poultry being responsible for more than one-half of the P additions to the watershed in this period. As documented in Table 6, total P additions to the IRW have increased by more than 3.5 times from the closure of the dam to 2002 with poultry being responsible for nearly all of this increase.
Phosphorus removal from the IRW is shown in Table 7. The majority of the net removals of P from the IRW are due to P in the water flowing through the Lake Tenkiller spillway. Also notable is the magnitude of P leaving the IRW (Table 7) compared to P imported into this watershed (Table 6). P additions were ~5500 tonnes in 2002 compared to removal of 82 tonnes. The difference be-

Table 5. USGS gage stations at which P loads to Lake Tenkiller were computed.

Table 6. Annual P additions, in tonnes, to the Illinois river watershed.
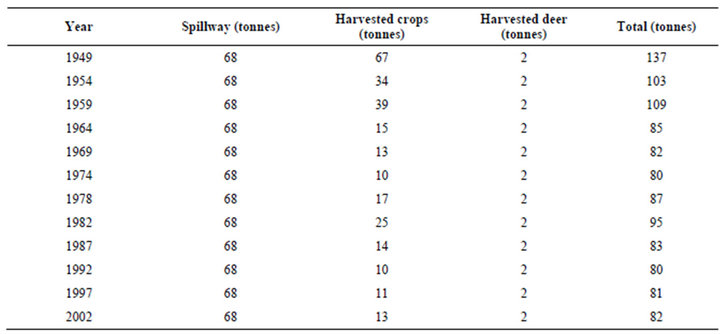
Table 7. Annual P removals for the Illinois river watershed.
tween the P entering the IRW and that leaving the watershed is the amount of P accumulating in the IRW. Accumulation of P leads to increased P losses in runoff over time, creating long-term opportunities for elevated P losses with runoff [10,29-32].
The net addition of P into the IRW from 1949 to 2002 was determined using linear interpolation between years in which P net additions were computed. From 1949 to 2002, approximately 200,000 tonnes of P were added to the IRW and approximately 4500 tonnes were removed, resulting in a net addition of 195,000 tonnes (>95%). Almost 68% of the addition, more than 134,000 tonnes, was attributable to poultry production. Other studies completing nutrient mass balances for watersheds also found that livestock, including poultry, were the largest contributors of P within the watershed (Jaworski et al. [25], McMahon and Woodside [26]; Harned et al. [27]). Sharpley et al. [34] indicated that the spatial separation of crop and poultry production systems results in a largescale one-way transfer of nutrients from grain to poultry producing areas. This is certainly the case for the IRW based on the mass balance analysis. Tarkalson and Mikkelsen [35] also found large P surpluses from poultry farms. The results for the IRW mass balance analysis are consistent with similar analyses for the Arkansas portion of the IRW [10,21].
The soil test P data for the IRW area supports the findings of the mass balance analysis and shows that soil P levels have increased to levels well beyond agronomic requirements. Background soil test P levels in the IRW are approximately 9 - 19 mg∙kg−1 based on samples from the Nickel Reserve (undeveloped, non-agricultural lands in the IRW) that has not received P inputs from fertilizer or livestock waste. The county-level soil test P levels within the IRW (Table 8) that were obtained from state soil nutrient testing facilities at the University of Arkan-

Table 8. Soil test P levels in the IRW counties.
sas and Oklahoma State University supports the P accumulation computed in the IRW mass balance. Bennett et al. [22] examined soil P as part of their mass balance study and concluded that the soil P in their study area was also in agreement with the mass balance analysis.
3.2. Phosphorus Delivery
The annual P loads at the three USGS gauging stations nearest to Lake Tenkiller are shown in Table 9. The mean annual P load between 1997 and 2006 to Lake Tenkiller was approximately 229,000 kg. These values were consistent with values reported by Pickup et al. [19] and Tortorelli and Pickup [18]. The total annual P loads to Lake Tenkiller vary by an order of magnitude during the ten year period due to the variability in rainfall and flows within the IRW rivers and streams.
The proportion of P that was applied to the IRW landscape that becomes NPS P runoff was determined for the 1999 through 2006 period. This period was selected simply because increased sampling of runoff events was initiated in 1999 by the USGS and thus the data in this period best represent P in runoff within the IRW. The P delivery ratio computed for this period indicates that 4% of P applied to the IRW landscape reached Lake Tenkiller
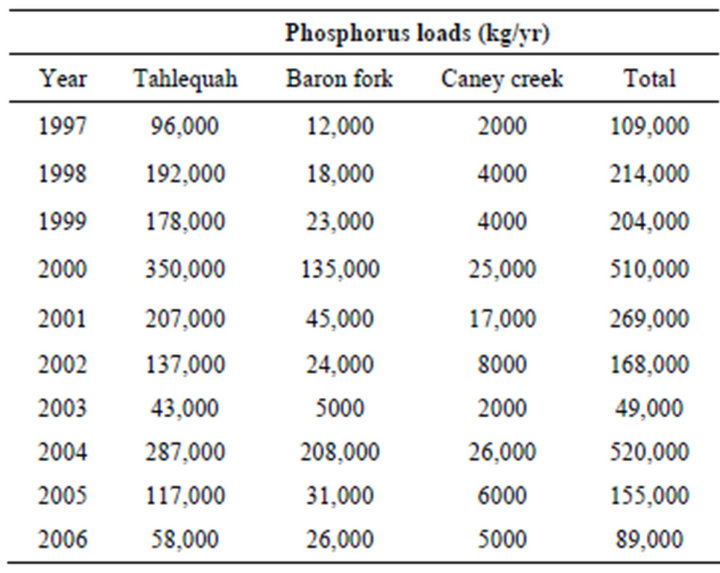
Table 9. Annual P loads at IRW gaging stations nearest Lake Tenkiller.
between 1999 and 2006 in the form of NPS P. If retention of WWTP discharged P in the streams and rivers was considered, the proportion of P from application on the landscape that reaches Lake Tenkiller would be greater. Further, the proportion of P from the IRW landscape that reaches streams and rivers is likely to be greater than 4% because this value represents P delivered by the streams and rivers to Lake Tenkiller, not simply P delivered to streams by runoff.
The computed P delivery ratio for the IRW is consistent with delivery ratios found by other researchers. Nelson et al. [21], for example, found that approximately 4% of P applied to the Arkansas portion of the IRW reached the Illinois River at the Arkansas-Oklahoma border. If cattle waste is removed from the Nelson et al. [21] calculation (cattle are recycling P and not adding P to the watershed [10]), the proportion of P that is applied to the landscape that reaches the Illinois River at the Arkansas-Oklahoma border would be slightly more than 5%. Fluck et al. [28] determined that approximately 7% of P applied to land in the Lake Okeechobee watershed reached the lake, while Jaworski et al. [25] found that 8% of P applied to the upper Potomac watershed was exported through flow in the river. Weidhaas et al. [48,49] used a quantitative PCR assay approach to confirm that poultry waste applied in the IRW was running off and reaching streams and rivers. Willett et al. [50] modeled the IRW and assumed that 5% of poultry waste that was land applied was lost to the IRW waters. Sharpley et al. [30] indicated that 5% of P in poultry waste that is land applied to fields runs off, and thus may eventually reach the lake.
The value reported by Sharpley [34] represents P loss from a field, and thus the P loss percentage from a watershed the size of the IRW would be expected to be lower. The portion of P reaching the Illinois River within Arkansas reported by Nelson et al. [21] was larger as would be expected given the concentration of poultry operations in this portion of the watershed (Figure 3), the distance of this location from Lake Tenkiller, and the characteristics of the watershed in Oklahoma compared to those in Arkansas (lower soil test P, lower P applied to the landscape, more forested area).
The proportion of P reaching Lake Tenkiller attributable to the IRW’s most significant P sources was computed for the 1999-2006 period (Table 10). The NPS sources were computed using the portion of P land applied in the IRW that reaches Lake Tenkiller (4%), and the amount of P from each source applied to the IRW landscape. The industrial and majority of human P contributions are treated by WWTP, and thus contributions of these sources were proportional to their contribution to the WWTP and the amount of P discharged by WWTP. The results, presented in Table 10, show that poultry is responsible for almost 60% of P reaching Lake Tenkiller for the 1999-2006 period, followed by humans and industrial sources (WWTP discharges represent approximately 27% of total P reaching the lake). This is consistent with Cooke et al. [51] who estimated that P runoff from poultry litter was 63% of loading from the IRW from 2001-2004 and 71% after the 2004 WWTP upgrades. Stevenson et al. [52] found that poultry and urban activities in the IRW had substantial effects on P pollution and benthic algal biomass, which is consistent with findings herein. Poultry processing also contributes a significant amount (approximately 1/3) of the industrial P effluent to WWTP [53]. In 2003, the WWTP discharge of P was reduced from facilities in the IRW, and thus the proportion of P attributable to land application of poultry waste is likely even greater than reported in Table 10.
The historical proportion of P reaching Lake Tenkiller attributable to various sources was computed using the P inputs into the IRW (Table 6) and the P delivery ratio computed in this study (4%). The results are shown in Table 11. Prior to the completion of Lake Tenkiller in 1954, WWTP P discharge contributed more than 50% of the total P reaching the location of the lake. The proportion of P attributable to WWTP has declined since 1949 due to other sources of P contributing increasing loads to the lake. Further, in 2003 WWTP discharge of P was reduced from 92,500 kg to approximately 40,800 kg as a result of changes in WWTP technology. In 1949, dairy cattle were responsible for approximately 32% of P contributions to the IRW (Table 11), but the dairy proportion has steadily declined, reaching less than 4% of the total loads to the lake in 2002. The decline is due to a reduction in the number of dairy cattle in the IRW as well as an increase in P contributions from other sources.
The proportion of P loads attributable to commercial fertilizer declined from more than 9% (1949) to approximately 5% in 2002 (Table 11). The proportion of P load
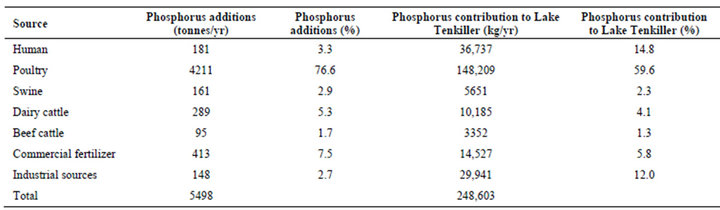
Table 10. Sources of P additions to the Illinois river watershed and their contribution to Lake Tenkiller between 1999 and 2006.
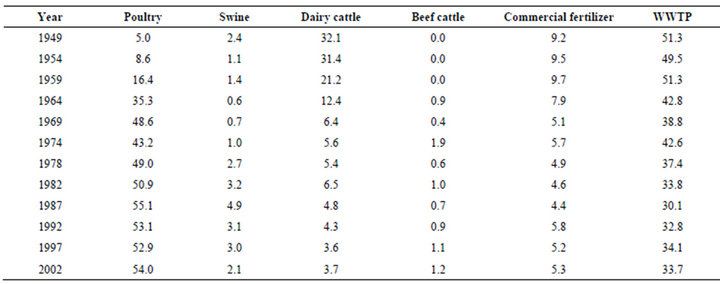
Table 11. Proportion of P in percent reaching Lake Tenkiller attributable to significant sources.
attributable to commercial fertilizer decreased despite increased fertilizer use in the IRW from 1949 to 2002 (Table 3). The decrease is a result of the significant increase in P from poultry production that offsets the increase in commercial fertilizer use. P loads attributable to poultry increased from 5% in 1949 to 54% in 2002 (Table 11). Since 1969, land application of poultry waste has contributed more P to Lake Tenkiller than any other source (Table 11). This change in poultry contribution of P to Lake Tenkiller is a result of the increase in poultry production as well as the associated P increases in waste that is applied to the IRW landscape (Tables 2 and 6).
The P contribution results in recent years were confirmed by Olsen et al. [54] who identified P from land applied poultry waste and WWTP discharges as the most significant P sources in IRW waters based on principal components analysis of IRW data. The proportion of P attributable to land application of poultry waste computed with the delivery coefficient and P inputs to the IRW landscape for 2002 (54%) is similar to that calculated from the Groundwater Loading Effects of Agricultural Management Systems (GLEAMS) and routing modeling for the 1998-2006 period (45%) [53]. The GLEAMS and routing model analysis also considered contributions of cattle in and near streams within the IRW.
4. Conclusions
A P mass balance was computed for the IRW that lies within Arkansas and Oklahoma. The streams and rivers within the IRW and Lake Tenkiller at the outlet of the watershed have been the focus of numerous studies exploring eutrophication. More than 200,000 tonnes of P was added to the IRW between 1949 (just prior to dam closure) and 2002 with nearly 68% of this addition attributable to poultry production. The IRW P mass balance showed that poultry production is currently responsible for more than 76% of the net annual P additions to the IRW. Analysis of historical data showed that poultry production has been the major contributor of P imported to the IRW since 1964. Prior to 1964, dairy cattle production was responsible for the majority of the P imported. However, a decline in dairy cattle production and rapid increase in poultry production within the IRW has greatly changed the P mass balance sources between 1949 and 2002.
The mass balance results and observed P loads to Lake Tenkiller were used to compute a P delivery ratio for P applied to the landscape within the IRW. The delivery ratio of 4% is comparable to values described in other studies. The delivery ratio was used to compute P loads to Lake Tenkiller from 1949 to 2002, and to allocate these loads to the most significant sources. In 1949 WWTP discharges were responsible for more than 50% of P reaching Lake Tenkiller, followed by dairy cattle which were responsible for 32% of loads. The poultry contribution to P reaching Lake Tenkiller was 5% in 1949 but grew rapidly and became the largest source in 1969 (~49%), and in 2002 reached 54%. Both dairy and WWTP portions of the loads have declined from 1949, with dairy responsible for less than 4%, and WWTP less than 34% of total P loads in 2002. Further reductions of WWTP loads occurred in 2003 as a result of WWTP upgrades.
The mass balance and delivery ratio based P allocation indicated that poultry appeared to be a significant contributor of P into the IRW, as well as P reaching Lake Tenkiller. Addressing eutrophication of IRW streams and rivers and Lake Tenkiller will require reduction in the contribution of P from poultry production.
5. Acknowledgements
The authors would like to thank Motley Rice, LLC for their financial support of this work.
REFERENCES
- OSRC (Oklahoma Scenic Rivers Commission), “The Illinois River Management Plan—1999. Oklahoma Scenic Rivers Commission,” 1998.
- S. L. Nolen, J. H. Carroll, D. L. Combs, J. C. Staves and J. N. Veenstra, “Limnology of Tenkiller Ferry Lake, Oklahoma, 1985-1986,” Proceedings of the Oklahoma Academy of Sciences, Vol. 69, 1989, pp. 45-55.
- S. Haraughty, “Comprehensive Basin Management Plan for the Illinois River Basin in Oklahoma,” Oklahoma Conservation Commission, 1999.
- OWRB (Oklahoma Water Resources Board), “Justification for Adding Nutrient Limited Watershed Designations to Waterbodies, Appendix A,” 2005. http://www.owrb.ok.gov/util/rules/pdf_rul/new_nlws_tenkiller_tbird.pdf
- W. J. Andrews, M. F. Becker, S. J. Smith and R. L. Tortorelli, “Summary of Surface-Water Quality Data from the Illinois River Basin in North Oklahoma, 1970-2007,” US Geological Survey Scientific Investigations Report, 5182, 2009, 39 p.
- R. P. Richards, F. G. Calhoun and G. Matisoff, “The Lake Erie Agricultural Systems for Environmental Quality Project: An Introduction,” Journal of Environmental Quality, Vol. 31, No. 1, 2002, pp. 6-16. doi:10.2134/jeq2002.0006
- USEPA (United States Environmental Protection Agency) Region 6 and Department of Environmental Quality State of Oklahoma. “Water Quality Modeling Analysis in Support of TMDL Development for Tenkiller Ferry Lake and the Illinois River Watershed in Oklahoma,” 2001, EPA Contract EP-C-06-029, WA 3-36.
- D. E. Storm, M. J. White and M. D. Smolen, “Illinois River Upland and In-Stream Phosphorus Modeling,” Oklahoma Department of Environmental Quality, Oklahoma City, 2006.
- D. R. Gade, “An Investigation of the Sources and Transport of Nonpoint Source Nutrients in the Illinois River Basin in Oklahoma and Arkansas,” Ph.D. Thesis, Oklahoma State University, Stillwater, 1998.
- N. A. Slaton, K. R. Brye, M. B. Daniels, T. C. Daniel, R. J. Norman and D. M. Miller, “Nutrient Input and Removal Trends for Agricultural Soils in None Geographic Regions in Arkansas,” Journal of Environmental Quality, Vol. 33, No. 5, 2004, pp. 1606-1615. doi:10.2134/jeq2004.1606
- J. B. Fisher, R. Hight, R. van Waasbergen, B. Engel and M. Smith, “Estimates of the Mass Generated, Disposal Timing and the Spatial Distribution of Disposal Sites within the Illinois River Watershed (Oklahoma and Arkansas, United States),” Proceedings of the 20 International Symposium on Environmental Science and Technology, Shanghai, 2-5 June 2009, pp. 1238-1247.
- G. W. Malone, “Evaluation of Litter Materials Other than Wood Shavings,” Proceedings of the National Poultry Waste Management Symposium, National Poultry Waste Management Symposium Committee, Auburn, 1992, pp. 274- 284.
- P. A. Moore Jr., “Best Management Practices for Poultry Manure Utilization That Enhance Agricultural Productivity and Reduce Pollution,” In: J. L. Hatfield and B. A. Steward, Eds., Animal Waste Utilization: Effective Use of Manure as a Soil Resource, Ann Arbor Press, Chelsea, Michigan, 1998, pp. 89-124.
- J. B. Fisher, R. L. Olsen, F. M. Soster, B. Engel and M. Smith, “The History of Poultry Waste Contamination in the Illinois River Watershed as Determined from Sediment Cores Collected from Tenkiller Ferry Reservoir (Oklahoma, United States),” Proceedings of the 2009 International Symposium on Environmental Science and Technology, Shanghai, 2-5 June 2009, pp. 1222-1238.
- B. P. Jackson, M. Bertsch, M. L. Cabrera, J. J. Camberato, J. C. Seaman and C. W. Wood, “Trace Element Speciation in Poultry Litter,” Journal of Environmental Quality, Vol. 32, No. 2, 2003, pp. 535-540.
- C. M. Williams, J. C. Barker and J. T. Sims, “Management and Utilization of Poultry Wastes,” Reviews of Environmental Contamination & Toxicology, Vol. 162, 1999, pp. 105-157. doi:10.1007/978-1-4612-1528-8_3
- C. M. Williams, “Poultry Waste Management in Developing Countries,” Food and Agriculture Organization of the United Nations, Poultry Development Review, Agriculture and Consumer Protection Department, Animal Production and Health Division, 2011. http://www.fao.org/ag/againfo/themes/documents/poultry/PDR_environment_main.pdf
- R. L. Tortorelli and B. E. Pickup, “Phosphorus Concentrations, Loads, and Yields in the Illinois River Basin, Arkansas and Oklahoma, 2000-2004,” US Geological Survey Scientific Investigations, 2006.
- B. E. Pickup, W. J. Andrews, B. E. Haggard and W. R. Green, “Phosphorus Concentrations, Loads and Yields in the Illinois River Basin, Arkansas and Oklahoma, 1997- 2001,” US Geological Survey Water Resources Investigations Report 03-4168, USGS, Reston, 2003.
- R. Runkel, C. G. Crawford and T. A. Cohn, “Load Estimator (LOADEST): A Fortran Program for Estimating Constituent Loads in Streams and Rivers 2004,” US Geological Survey Techniques Methods, Book 4, Chap. A5, 2004.
- M. A. Nelson, K. L. White and T. S. Soerens, “Illinois River Phosphorus Sampling Results and Mass Balance Computation. Proceedings AWRC Annual Research Conference, Arkansas Water Resources Center, Fayetteville, 2002.
- E. M. Bennett, T. Reed-Andersen, J. N. Houser, J. R. Gabriel and S. R. Carpenter, “A Phosphorus Budget for the Lake Mendota Watershed,” Ecosystems, Vol. 2, No. 1, 1999, pp. 69-75. doi:10.1007/s100219900059
- M. A. Mallin and L. B. Cahoon, “Industrialized Animal Production—A Major Source of Nutrient and Microbial Pollution to Aquatic Ecosystems,” Population and Environment, Vol. 24, No. 5, 2003, pp. 369-385. doi:10.1023/A:1023690824045
- C. Stow, M. Borsuk and D. Stanley, “Long-Term Changes in Watershed Nutrient Inputs and Riverine Exports in the Neuse River, North Carolina,” Water Research, Vol. 35, No. 6, 2001, pp. 1489-1499. doi:10.1016/S0043-1354(00)00402-4
- N. A. Jaworski, P. M. Groffman, A. A. Keller and J. C. Prager, “A Watershed Nitrogen and Phosphorus Balance: The Upper Potomac River Basin,” Estuaries, Vol. 15, No. 1, 1992, pp. 83-95. doi:10.2307/1352713
- G. McMahon and M. D. Woodside, “Nutrient Mass Balance for the Albemarle-Pamlico Drainage Basin, North Carolina and Virginia, 1990,” Journal of the American Water Resources Association, Vol. 33, No. 3, 1997, pp. 573-589. doi:10.1111/j.1752-1688.1997.tb03533.x
- D. A. Harned, J. B. Atkins and J. S. Harvill, “Nutrient Mass Balance and Trends, Mobile River Basin, Alabama, Georgia, and Mississippi,” Journal of the American Water Resources Association, Vol. 40, No. 3, 2004, pp. 765- 793. doi:10.1111/j.1752-1688.2004.tb04458.x
- R. C. Fluck, C. Fonyo and E. Flaig, “Land-Use-Based Phosphorus Balances for Lake Okeechobee, Florida, Drainage Basins,” Applied Engineering in Agriculture, Vol. 8, No. 3, 1992, pp. 813-820.
- P. A. Vadas, P. J. A. Kleinman, A. N. Sharpley and B. L. Turner, “Relating Soil Phosphorus to Dissolved Phosphorus in Runoff: A Single Extraction Coefficient for Water Quality Modeling,” Journal of Environmental Quality, Vol. 43, No. 2, 2005, pp. 572-580. doi:10.2134/jeq2005.0572
- P. A. Vadas, R. D. Harmel and P. J. A. Kleinman, “Transformations of Soil and Manure Phosphorus after Surface Application of Manure to Field Plots,” Nutrient Cycling in Agroecosystems, Vol. 77, No. 1, 2007, pp. 83-99. doi:10.1007/s10705-006-9047-5
- M. Daniels, T. Daniel, D. Carman, R. Morgan, J. Langston and K. Van Devender, “Soil Phosphorus Levels: Concerns and Recommendations,” Cooperative Extension Service, University of Arkansas, FSA1029-500-3-04R, 2004.
- J. T. Sims, “The Role of Soil Testing in Environmental Risk Assessment for Phosphorus,” In: A. N. Sharpley, Ed., Agriculture and Phosphorus Management: The Chesapeake Bay, CRC Press, Boca Raton, 2000, pp. 57-80.
- A. N. Sharpley, T. C. Daniel, J. T. Sims and D. H. Pote, “Determining Environmentally Sound Soil Phosphorus Levels,” Journal of Soil and Water Conservation, Vol. 51, No. 2, 1996, pp. 160-166.
- A. N. Sharpley, S. Herron and T. Daniel, “Overcoming the Challenges of Phosphorus-Based Management in Poultry Farming,” Journal of Soil and Water Conservation, Vol. 62, No. 6, 2007, pp. 375-389.
- D. Tarkalson and R. A. Mikkelsen, “A Phosphorus Budget of a Poultry Farm and a Dairy Farm in the Southeastern US, and the Potential Impacts of Diet Alterations,” Nutrient Cycling in Agroecosystems, Vol. 66, No. 3, 2003, pp. 295-303. doi:10.1023/A:1024435909139
- R. L. Kellogg, C. H. Lander, D. C. Moffitt and N. Gollehon, “Manure Nutrients Relative to the Capacity of Cropland and Pastureland to Assimilate Nutrients: Spatial and Temporal Trends for the United States,” Animal Residuals Management, Vol. 140, 2000, pp. 18-157.
- R. L. Kellogg, “Potential Priority Watersheds for Protection of Water Quality from Contamination by Manure Nutrients,” Animal Residuals Management Conference 2000, Kansas City, 12-14 November 2000, pp. 646-665.
- M. J. Bowes, J. H. Gordon, P. Irons and D. D. Hornby, “The Relative Contribution of Sewage and Diffuse Phosphorus Sources in the River Avon Catchment, Southern England: Implications for Nutrient Management,” Science of the Total Environment, Vol. 344, No. 1-3, 2005, pp. 67-81. doi:10.1016/j.scitotenv.2005.02.006
- G. Hanrahan, M. Gledhill, W. A. House and P. J. Worsfold, “Phosphorus Loading in the Frome Catchment, UK: Seasonal Refinement of the Coefficient Modeling Approach,” Journal of Environmental Quality, Vol. 30, No. 5, 2001, pp. 1738-1746. doi:10.2134/jeq2001.3051738x
- P. J. Johnes, “Evaluation and Management of the Impact of Land Use Change on the Nitrogen and Phosphorus Load Delivered to Surface Waters: The Export Coefficient Modelling Approach,” Journal of Hydrology, Vol. 183, No. 3-4, 1996, pp. 323-349. doi:10.1016/0022-1694(95)02951-6
- K. Daly, P. Mills, B. Coulter and M. McGarrigle, “Modeling Phosphorus Concentrations in Irish Rivers Using Land Use, Soil Type, and Soil Phosphorus Data,” Journal of Environmental Quality, Vol. 31, No. 2, 2002, pp. 590- 599. doi:10.2134/jeq2002.0590
- J. G. Winter and H. C. Duthie, “Export Coefficient Modeling to Assess Phosphorus Loading in an Urban Watershed,” Journal of the American Water Resources Association, Vol. 36, No. 5, 2000, pp.1053-1061. doi:10.1111/j.1752-1688.2000.tb05709.x
- P. J. Johnes and A. L. Heathwaite, “Modelling the Impact of Land Use Change on Water Quality in Agricultural Catchments,” Hydrological Processes, Vol. 11, No. 3, 1997, pp. 269-286. doi:10.1002/(SICI)1099-1085(19970315)11:3<269::AID-HYP442>3.0.CO;2-K
- R. D. von Bernuth and G. Salthouse, “Manure and Fertilizer Nutrient Balance: A Methodology Applied to Michigan,” Applied Engineering in Agriculture, Vol. 15, No. 6, 1999, pp. 695-700.
- D. R. Gill and K. S. Lusby, “Feeding High Protein Range Cubes,” Oklahoma State University Cooperative Extension Service, Stillwater, 2003.
- USDA (United States Department of Agriculture), “Agricultural Waste Management Field Handbook,” USDASoil Conservation Service, Washington, DC, 1992.
- ASAE (American Society of Agricultural Engineers), “Manure Production and Characteristics,” American Society of Agricultural and Biological Engineers, St. Joseph, 2005.
- J. L. Weidhaas, W. Macbeth, R. L. Olsen, M. J. Sadowsky, D. Norat and V. J. Harwood, “Identification of a Brevibacterium Marker Gene Specific to Poultry Litter and Development of a Quantitative PCR Assay,” Journal of Applied Microbiology, Vol. 109, No. 1, 2010, pp. 334- 347.
- J. L. Weidhaas, T. W. Macbeth, R. L. Olsen and V. J. Harwood, “Correlation of Quantitative PCR for a Poultry-Specific Brevibacterium Marker Gene with Bacterial and Chemical Indicators of Water Pollution in a Watershed Impacted by Land Application of Poultry Litter,” Applied and Environmental Microbiology, Vol. 77, No. 6, 2011, pp. 2094-2102. doi:10.1128/AEM.02555-10
- K. Willett, D. Mitchell, H. Goodwin, B. Vieux and J. Popp, “The Opportunity Cost of Regulating Phosphorus from Broiler Production in the Illinois River Basin,” Journal of Environmental Planning and Management, Vol. 49, No. 2, 2006, pp. 181-207. doi:10.1080/09640560500507884
- G. D. Cooke, E. B. Welch and J. R. Jones, “Eutrophication of Tenkiller Reservoir, Oklahoma, from Nonpoint Agricultural Runoff,” Lake and Reservoir Management, Vol. 27, No. 3, 2011, pp. 256-270. doi:10.1080/07438141.2011.607552
- R. J. Stevenson, B. J. Bennett, D. N. Jordan and R. D. French, “Phosphorus Regulates Stream Injury by Filantous Green Algae, Thresholds, DO, and pH,” Hydrobiologia, Vol. 695, No. 1, 2012, pp. 25-42. doi:10.1007/s10750-012-1118-9
- B. Engel, “Poultry Waste Generation and Land Application in the Illinois River Watershed and Phosphorus Loads to the Illinois River Watershed Streams and Rivers and Lake Tenkiller,” Report in Case No. 05-CU-329- GKF-SAJ, United States District Court for the Northern District of Oklahoma, Tulsa, 2008.
- R. L. Olsen, R. W. Chappell and J. C. Loftis, “Water Quaty Sample Collection, Data Treatment and Results Presentation for Principal Components Analysis: Literature Review and Illinois River Watershed Case Study,” Water Research, Vol. 46, No. 9, 2012, pp. 3110-3122. doi:10.1016/j.watres.2012.03.028
NOTES
*Corresponding author.