Journal of Water Resource and Protection
Vol. 3 No. 6 (2011) , Article ID: 5707 , 8 pages DOI:10.4236/jwarp.2011.36047
A Dam Break Analysis Using HEC-RAS
Department of Civil and Environmental Engineering, Mississippi State University, Starkville, U.S.
Email: xiongyiwv@yahoo.com
Received March 16, 2011; revised March 25, 2011; accepted March 28, 2011
Keywords: Dam Break, Analysis, Model, HEC-RAS, Hydrograph
ABSTRACT
This paper firstly described the dam break in the aspects of theories and models. Break parameters prediction, the understanding of dam break mechanics, peak outflow prediction were shown as the essential for the dam break analysis, and eventually determined the loss of the damages. Secondly, as an application example, Foster Joseph Sayers Dam break was further modeled and analyzed using USACE Hydrologic Engineering Center’s River Analysis System (HEC-RAS) model based on available geometry data. The results show that dam break is a complicated and comprehensive process involving lots of principles. Combination of mechanics and case studies, reflection of predominant mechanisms of headcut erosion, more specific categorization of dam, prudent investigation and inference of dam break process are needed in developing a satisfactory dam break simulation model. Foster Joseph Sayers Dam break due to piping elongates the time period of high water surface level, which increases the duration of risk. However, the dam break does not increase the downstream maximum water surface elevation (Max. W.S. Elev) significantly at previous design Probable Maximum Flood (PMF). Dam break has a greater impact on the downstream location where is closer to the dam in accordance with the comparison of the hydrographs at different downstream locations. Sensitivity analysis demonstrates that the changes of dam break parameters had no much influence on the downstream Max. W.S. Elev.
1. Introduction
There is an old Chinese proverb - “The Great Levee is ruined by ant nest”. Generally, it warns people that small cases might result in big troubles. However, it always reminds water resource engineers the probability of dam failure.
Dam provides many benefits for our society, but floods resulting from the failure of constructed dams have also produced some of the most devastating disasters of the last two centuries. Simulation of dam break events and the resulting floods are crucial to characterizing and reducing threats due to potential dam failures. Development of effective emergency action plans requires accurate prediction of inundation levels and the time of flood wave arrival at a given location.
Dam failure results from both eternal force and internal erosion. Case studies show that dam failure may arise due to different reasons ranging from seepage, piping (internal erosion), overtopping due to insufficient spillway capacity and insufficient free board and to settlement due to slope slides on the upstream shells and liquification due to earthquakes [2]. USACE Hydrologic Engineering Center (HEC) Research Document 13 lists a list of more complete causes as follows: 1) Earthquake; 2) Landslide; 3) Extreme storm; 4) Piping; 5) Equipment malfunction; 6) Structure damage; 7) Foundation failure; 8) Sabotage [10]. Regardless of the reason, almost all failures begin with a breach formation. Basically, breach is defined as the opening formed in the dam body that leads the dam to fail and this phenomenon causes the concentrated water behind the dam to propagate towards downstream regions [2]. Despite the fact that the main modes of failure have been identified as piping or overtopping, the actual failure mechanics are not well understood for either earthen or concrete dams [10].
Previous assumptions of instantaneous and complete breaches simplify the modeling process. However, the assumptions are not appropriate for most cases or only applicable to a certain stage of the dam break. In the last two decades, more researchers have proposed headcutting as the predominant mechanics of dam break for cohesive embankments or rockfill embankments with a cohesive core [3,7]. In overtopping failure, a small headcut is typically formed near the toe of the dam and then advances upstream until the crest of the dam is breached [1,12]. In some cases it may initiate at the knickpoint present at the downstream edge of the crest [1,12]. As advance upstream it will widen and assume a semi-circular shape which improves stability of the headcut through arching of the soil mass [1,12]. In some cases, multiple stairstep headcuts form on the downstream face of the dam [1,12]. Headcut initiation takes place when the protective cover on an embankment fails, allowing localized erosion that creates an overfall. Factors affecting the initiation of headcutting include embankment slope, vegetation type and quality or riprap type and size, cover discontinuities, flow concentrations, flow velocities, and unit discharges. Headcut initiation can be modeled using tractive stress-based approaches [9]. The key erosion zone once a headcut has formed is at the base of the headcut overfall. As material is eroded from this area, support for the above soil mass is removed, leading to sudden collapse of the soil block. Tailwater conditions at the base of the overfall and aeration of the nappe are key factors in headcut advance [12].
U.S. Bureau of Reclamation [11] grouped the analysis methods into four categories: 1) Physically based methods (Table 1 lists the major models summarized by Singh, Scarlatos and Wurbs); 2) Parametric models; 3) Predictor equations; 4) Comparative analysis.
Dam failure analysis models developed by National Weather Service (NWS) such as DAMBRK, SMPDBK, and FLDWAV are widely used as well as BREACH. Gee and Brunner [4] compared USACE Hydrologic Engineering Center’s River Analysis System (HEC-RAS) model [5,6] with FLDWAV in the aspect of dam break flood routing. They concluded that the differences in the interpretation and approximation of river geometry are the primary source of the differences in the model simulations, although the numerical algorithms for solution of the St. Venant Equations are similar [4].
Dynamic Breach geometry (breach depth and width, breach side slope factor), timing (breach initial time, breach formation time, etc.), failure mode, breach progression, flow conditions, material, geometry and type of the dam can affect peak hydrograph estimation. Sensitivity analyses performed by previous researchers show that these parameters have varied influences on the peak flow in terms of locations, magnitudes of the dam, etc. Case studies data and/or the prediction equations are generally used to predict breach parameters. As for this prediction method, data uncertainty results from limited case studies and less detailed investigations, etc. is an important issue.
Physically based dam break model uses principles of hydraulics, sediment transport to simulate the development of the breach. Well understanding and modeling of the mechanisms of breach development and other physiccal processes (structure failure, erosion processes, etc) are required in this case. The two primary tasks in the hydraulic analysis of a dam breach are the prediction of the reservoir outflow hydrograph and the routing of that hydrograph through the downstream valley [12].
Many investigators have proposed simplified methods for predicting peak outflow from a breached dam. All of these methods, except Walder and O’Connor, are straightforward regression relations that predict peak outflow as a function of various dam and/or reservoir parameters, with the relations developed from analysis of case study data from real dam failures [13]. In contrast, Walder and O’Connor’s method is based upon an analysis of numerical simulations of idealized cases spanning a range of dam and reservoir configurations and erosion scenarios [13].
The dam break tool in HEC-RAS can simulate the

Table 1. Embankment breach models [8,14].
breach of an inline structure such as dam, or a lateral structure such as a levee. The objective of this study is to apply HEC-RAS to a dam break analysis based on given geometry data.
2. Foster Joseph Sayers Dam Break Simulation
2.1. Study Area
Foster Joseph Sayers Dam (Figure 1) is located on Route 150 in Centre County, PA, on Bald Eagle Creek about 1mile upstream from Blanchard and 14 miles above the mouth at Lock Haven. This 100-foot high and 1.3 mile long dam forms Foster Joseph Sayers Reservoir. The dam is a unit of a comprehensive flood control project for the protection of communities in the West Branch Susquehanna River Subbasin.
2.2. Dam Break Simulation and Analysis Using HEC-RAS
Foster Joseph Sayers Dam Break Analysis was completed using HEC-RAS model. Figure 2 represents the HEC-RAS geometry data.
In order to quantify the incremental effects of a dam break, totally three scenarios were simulated for Probable Maximum Flood (PMF) conditions: “without the dam”, “dam break”, “without Dam break”. Also, for better understanding the Foster Joseph Sayers Dam Break mechanisms and impacts, some dam breach parameters were adjusted to simulate the dam break and analyze the sensitivities. In addition, only piping break mode was analyzed because the spillway has adequate capacity to prevent the dam failure due to overtopping. Five scenarios of break simulation were compared: break with adjusted full formulation time, break with adjusted breach width, break with adjusted breach depth, break with adjusted side slope factor under PMF, and break without adjustment under PMF.
In this Dam Break Analysis, using mixed flow regime simulation, both upstream and downstream boundary conditions (inflow hydrograph and rating curve, respectively) and the gate opening height were identified.
Assume the Piping failure Starting WS at the Headwater Peak Stage of 660.00 instead of 664.00 in the previous simulation as the water elevation can not reach 664.00 right behind the dam based on the given flow condition. The detailed dam breach data are shown as Figure 3 and Figure 4. The break analyses of adjusted breach parameters are based on these basic data as well.
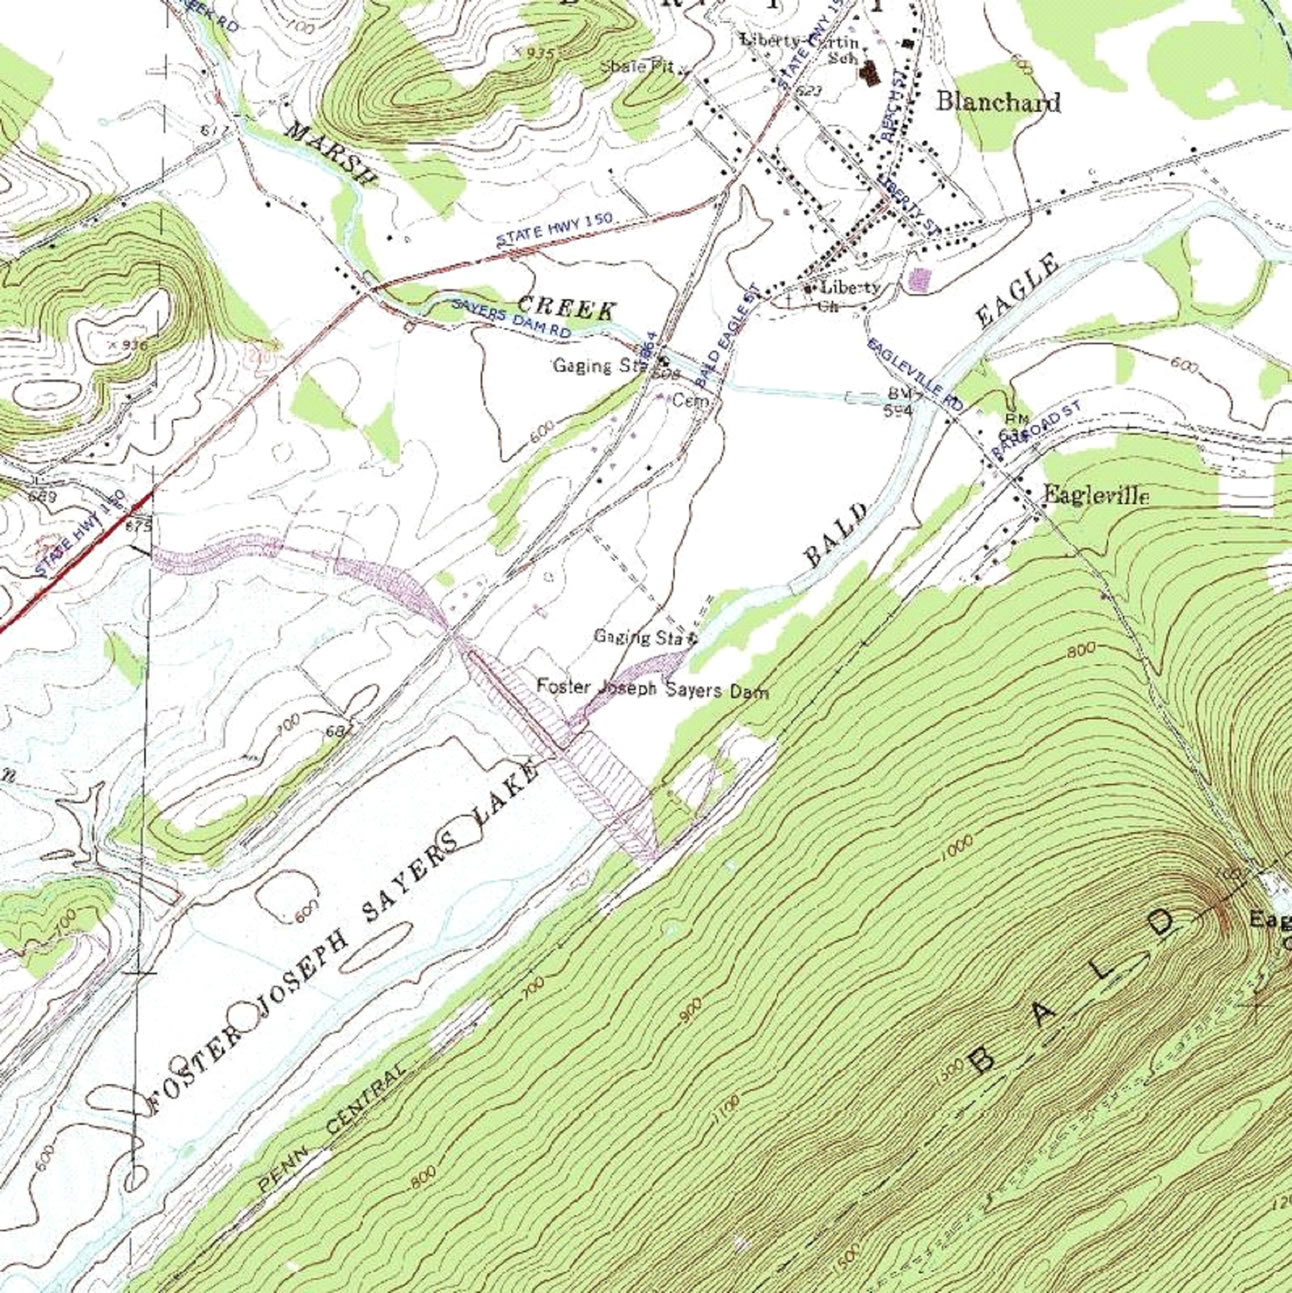
Figure 1. Topo map of sayers dam and vicinity area.
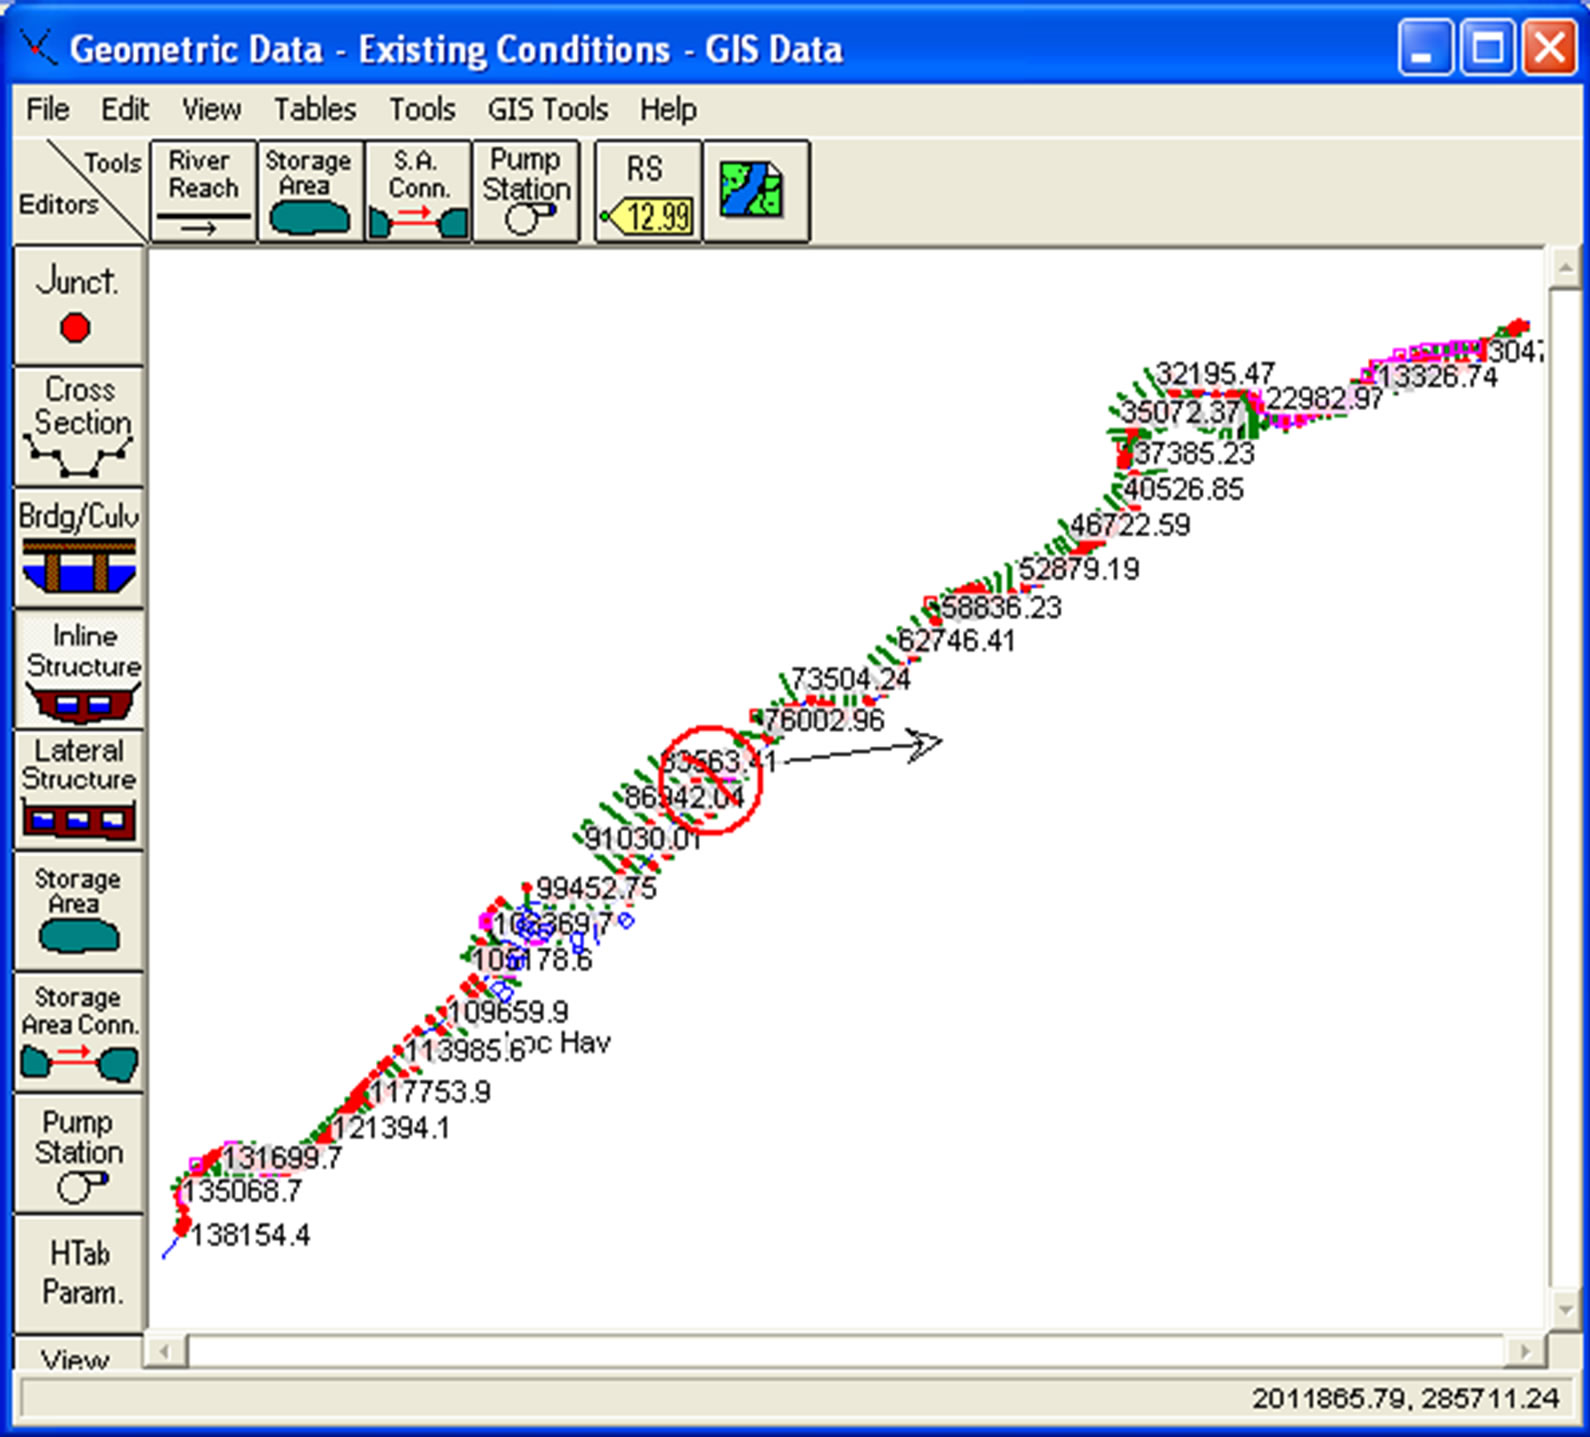
Figure 2. Hec-ras simulation of sayers dam break on bald eagle creek.
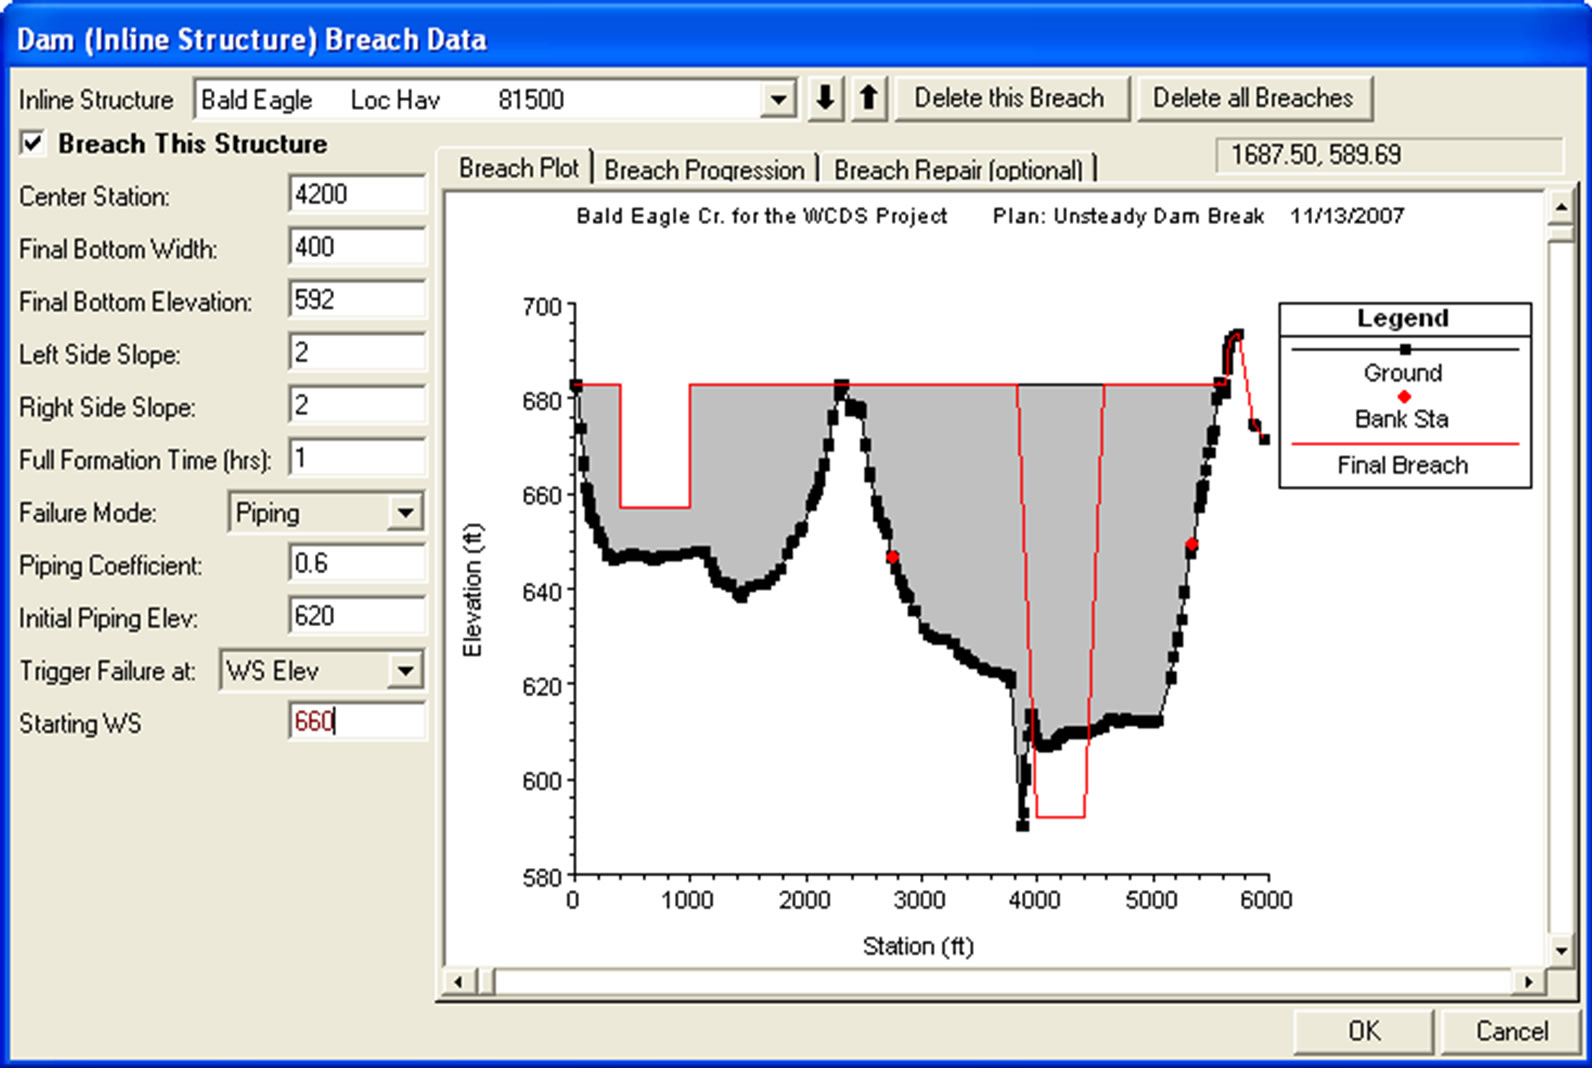
Figure 3. Dam breach plot.
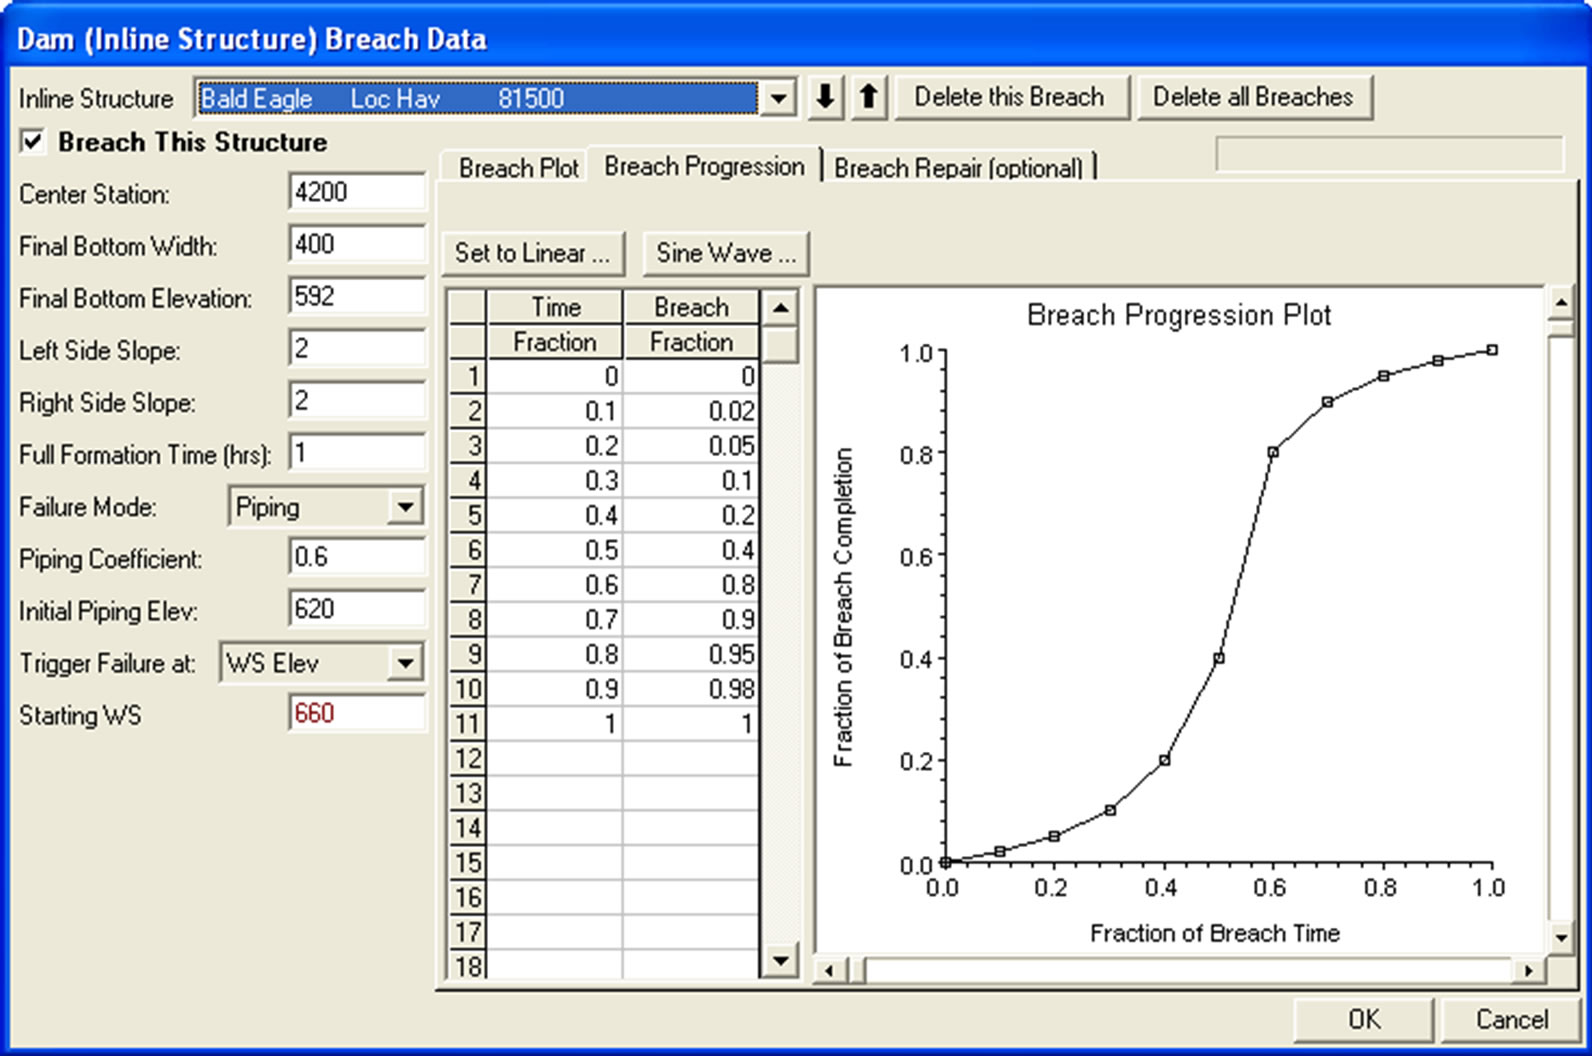
Figure 4. Dam breach presumed progression.
In this study, two downstream key locations, Blanchard (RS 76002.96) and Lock Haven (RS 659.942), and the two cross sections (RS 81849.41 and RS 81084.18, respectively) near the dam are four typical areas of concern. For PMF conditions, comparisons of the “without dam”, “with break” and “without break” results and sensitivity analysis at these locations were used to ascertain the additional hazard caused by the breach.
3. Results
Figure 5 shows the stage and flow hydrographs at RS 81849.41 (immediate upstream of the dam) for scenarios of “no dam break”, “dam break” and “without dam”. Apparently, The Sayers dam attenuates the peak flow at RS 81849.41 effectively. “Without dam” has a much lower stage than both “no dam break” and “dam break”.
Before the time of Feb 22, 1999, the stage and flow hydrographs are overlapped for both “dam break” and “no dam break”, while after that the “no dam break” flow drops suddenly and the “dam break” stage is lower than “no dam break” stage. It shows that there is a significant drawdown of the reservoir in the case of “dam break”.
At downstream of dam (RS 81084.18), both the stage and flow of “no dam break” drop dramatically after Feb 22, 1999 as shown in Figure 6, compared with those of “dam break”. It looks that dam break elongates the time period of higher water surface level, and greatly weakens the flood protection capacity of the dam and at the downstream area near the dam.
As for “dam break”, the peak outflow occurs after the breach reaches its maximum depth, approximately 20 hours’ delay.
As shown in Figure 7, the effects of dam break on the flow and stage are less significant than those of RS 81084.18 which is nearer the dam.
The peak stage of “without dam” is much higher than RS 81084.18 and the advantage of dam in the flood control at Blanchard is coming out.
Similar to Blanchard area, dam failure has less impact on the further downstream flood control, while flood situation is much more severe at Lock Haven without dam as shown in Figure 8.
The inflow hydrograph is increased to 1.2 times the designed PMF by setting the multiplier as 1.2 in flow hydrograph dialogue. Then, a comparison of the three scenarios results again shows that no significant changes are found as described above except for the increased duration of high stage and flow in the case of “without break”, and higher stage and flow for all three scenarios.
Table 2 gives the incremental results of dam failure analysis, and three scenarios are compared at four different locations. It does not make any difference between the “dam break” and “no dam break” except at downstream of the dam (RS 81084.18), which might indicate the downstream area near the dam is the critical and sensitive area in terms of dam failure.
Obviously, the scenario without dam poses much greater risk on further downstream area (Blanchard and Lock Haven) as shown in Table 2.
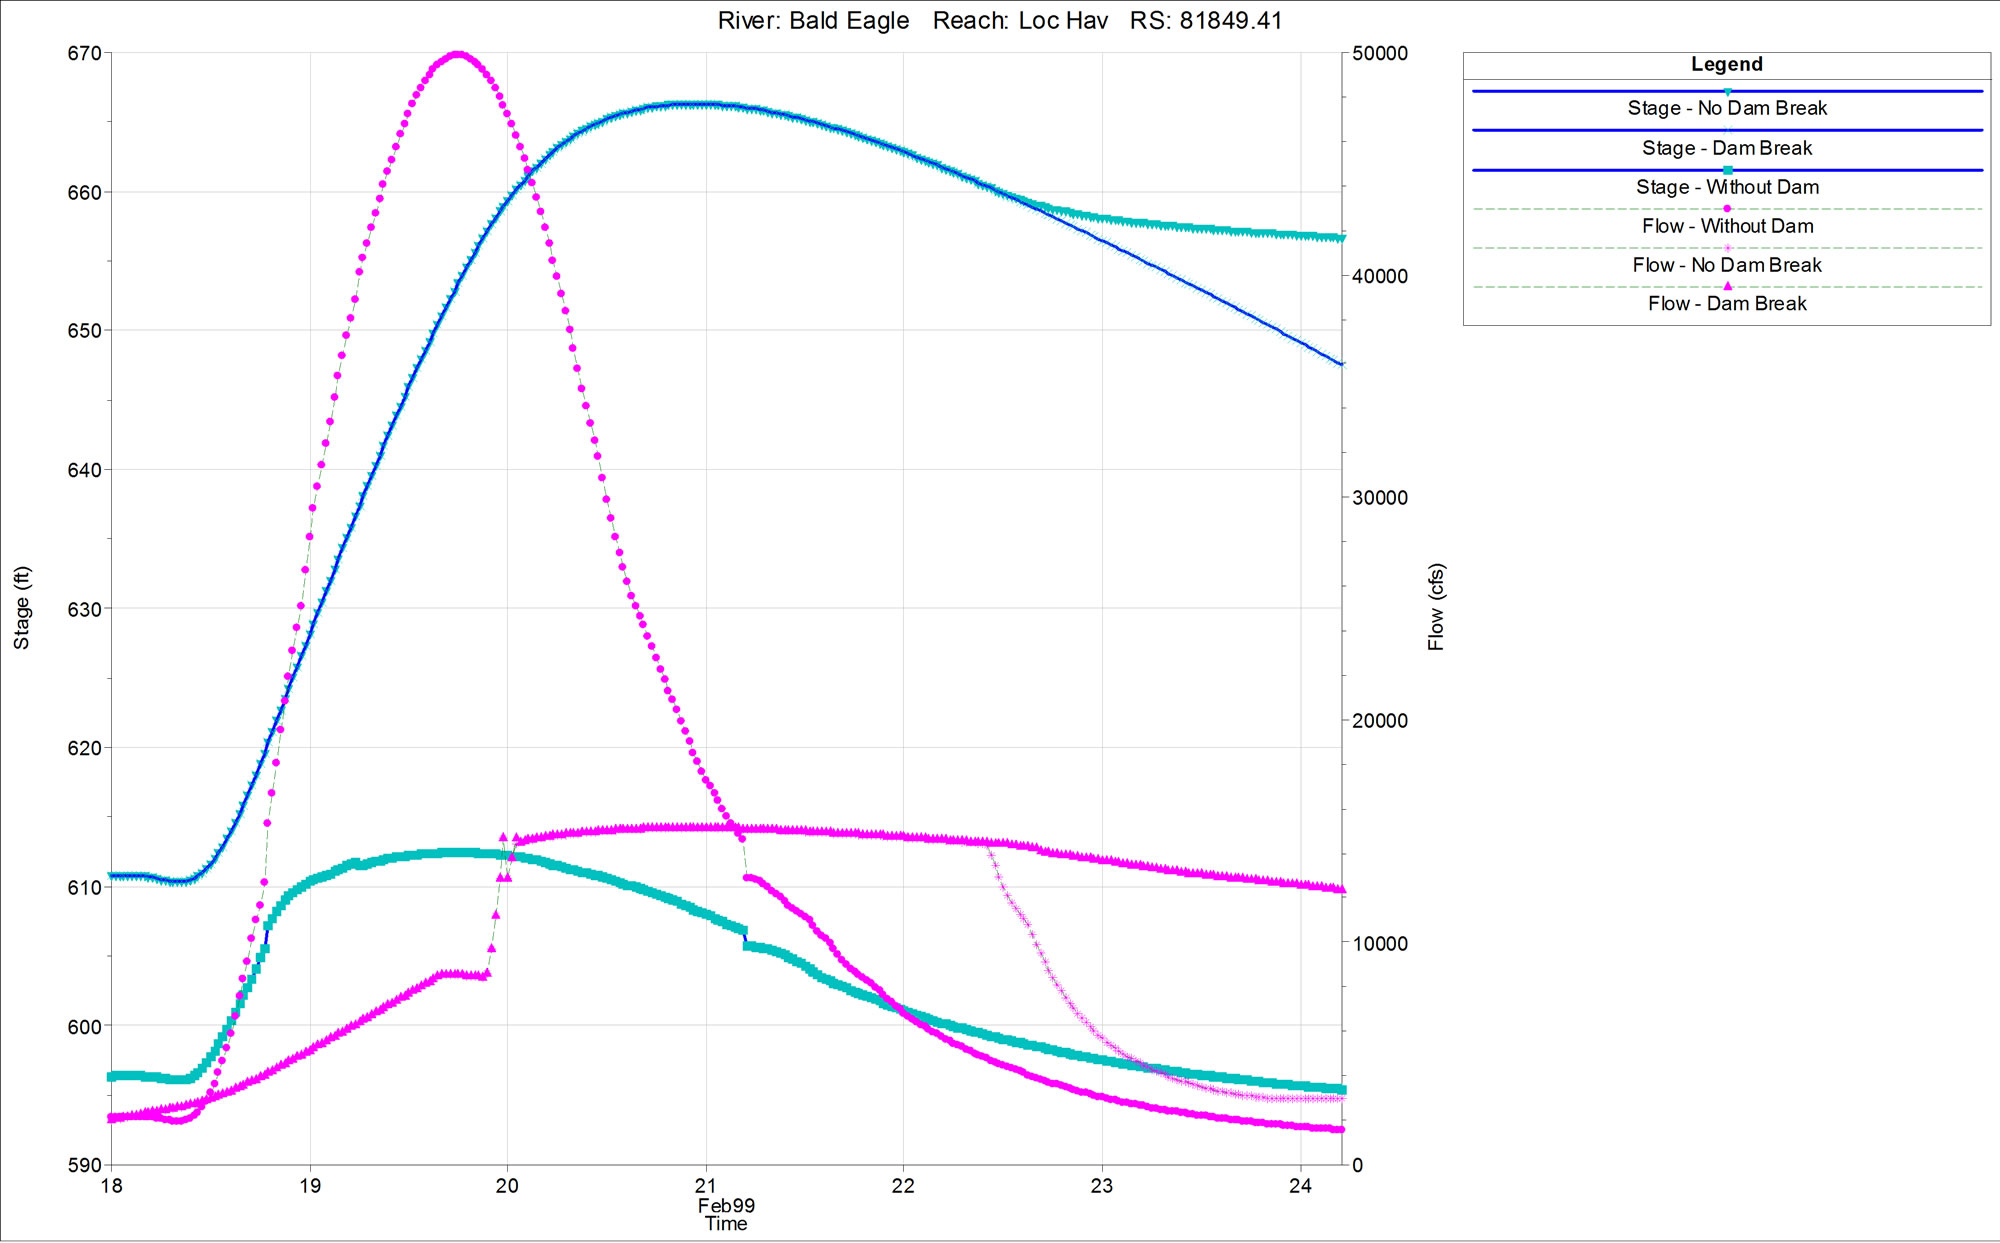
Figure 5. Stage and flow hydrographs at river station 81849.41 (Upstream of Dam).
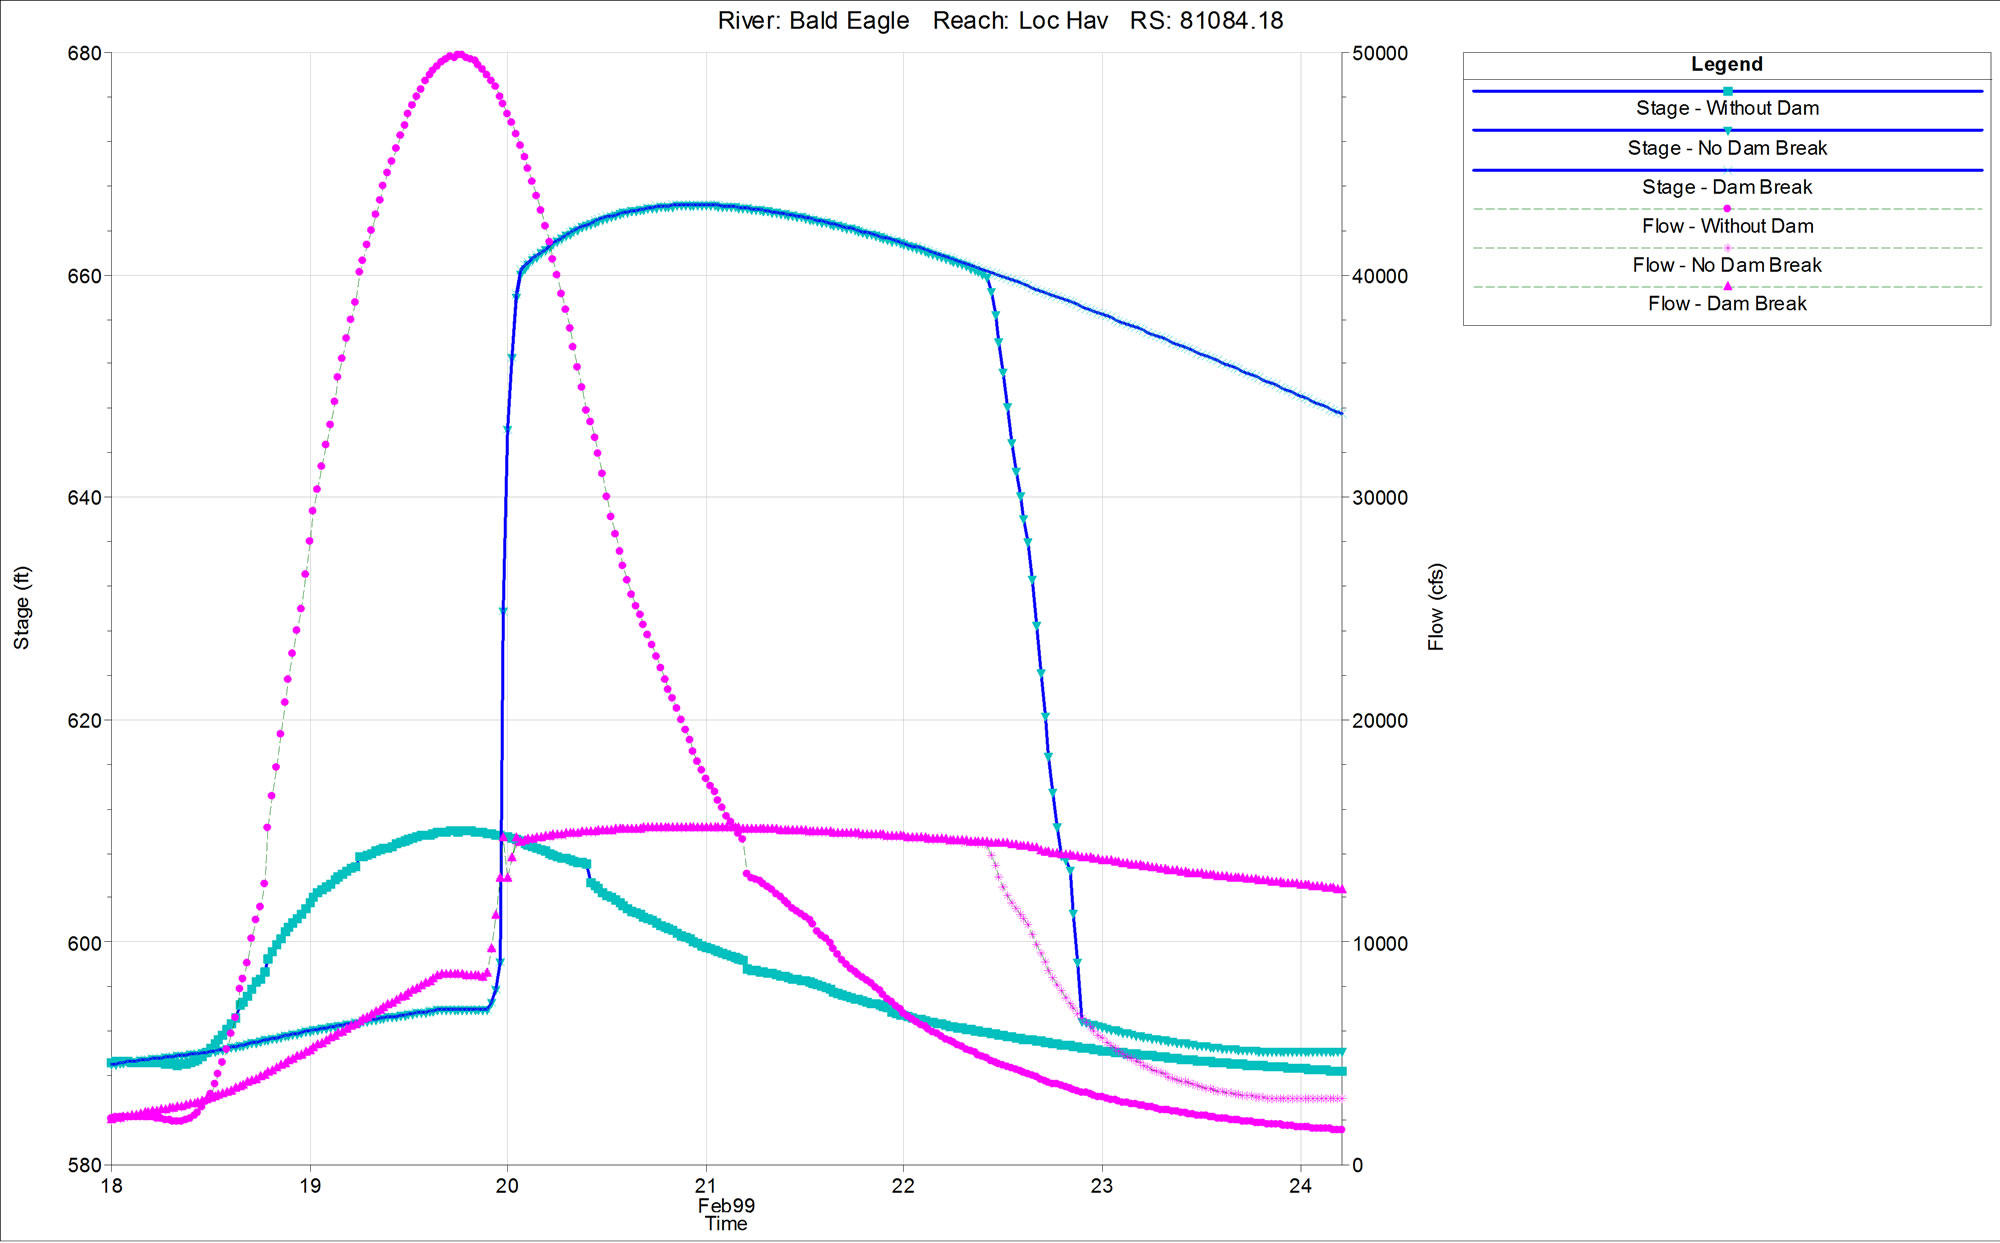
Figure 6. Stage and flow hydrographs at river station 81084.18 (Downstream of Dam).
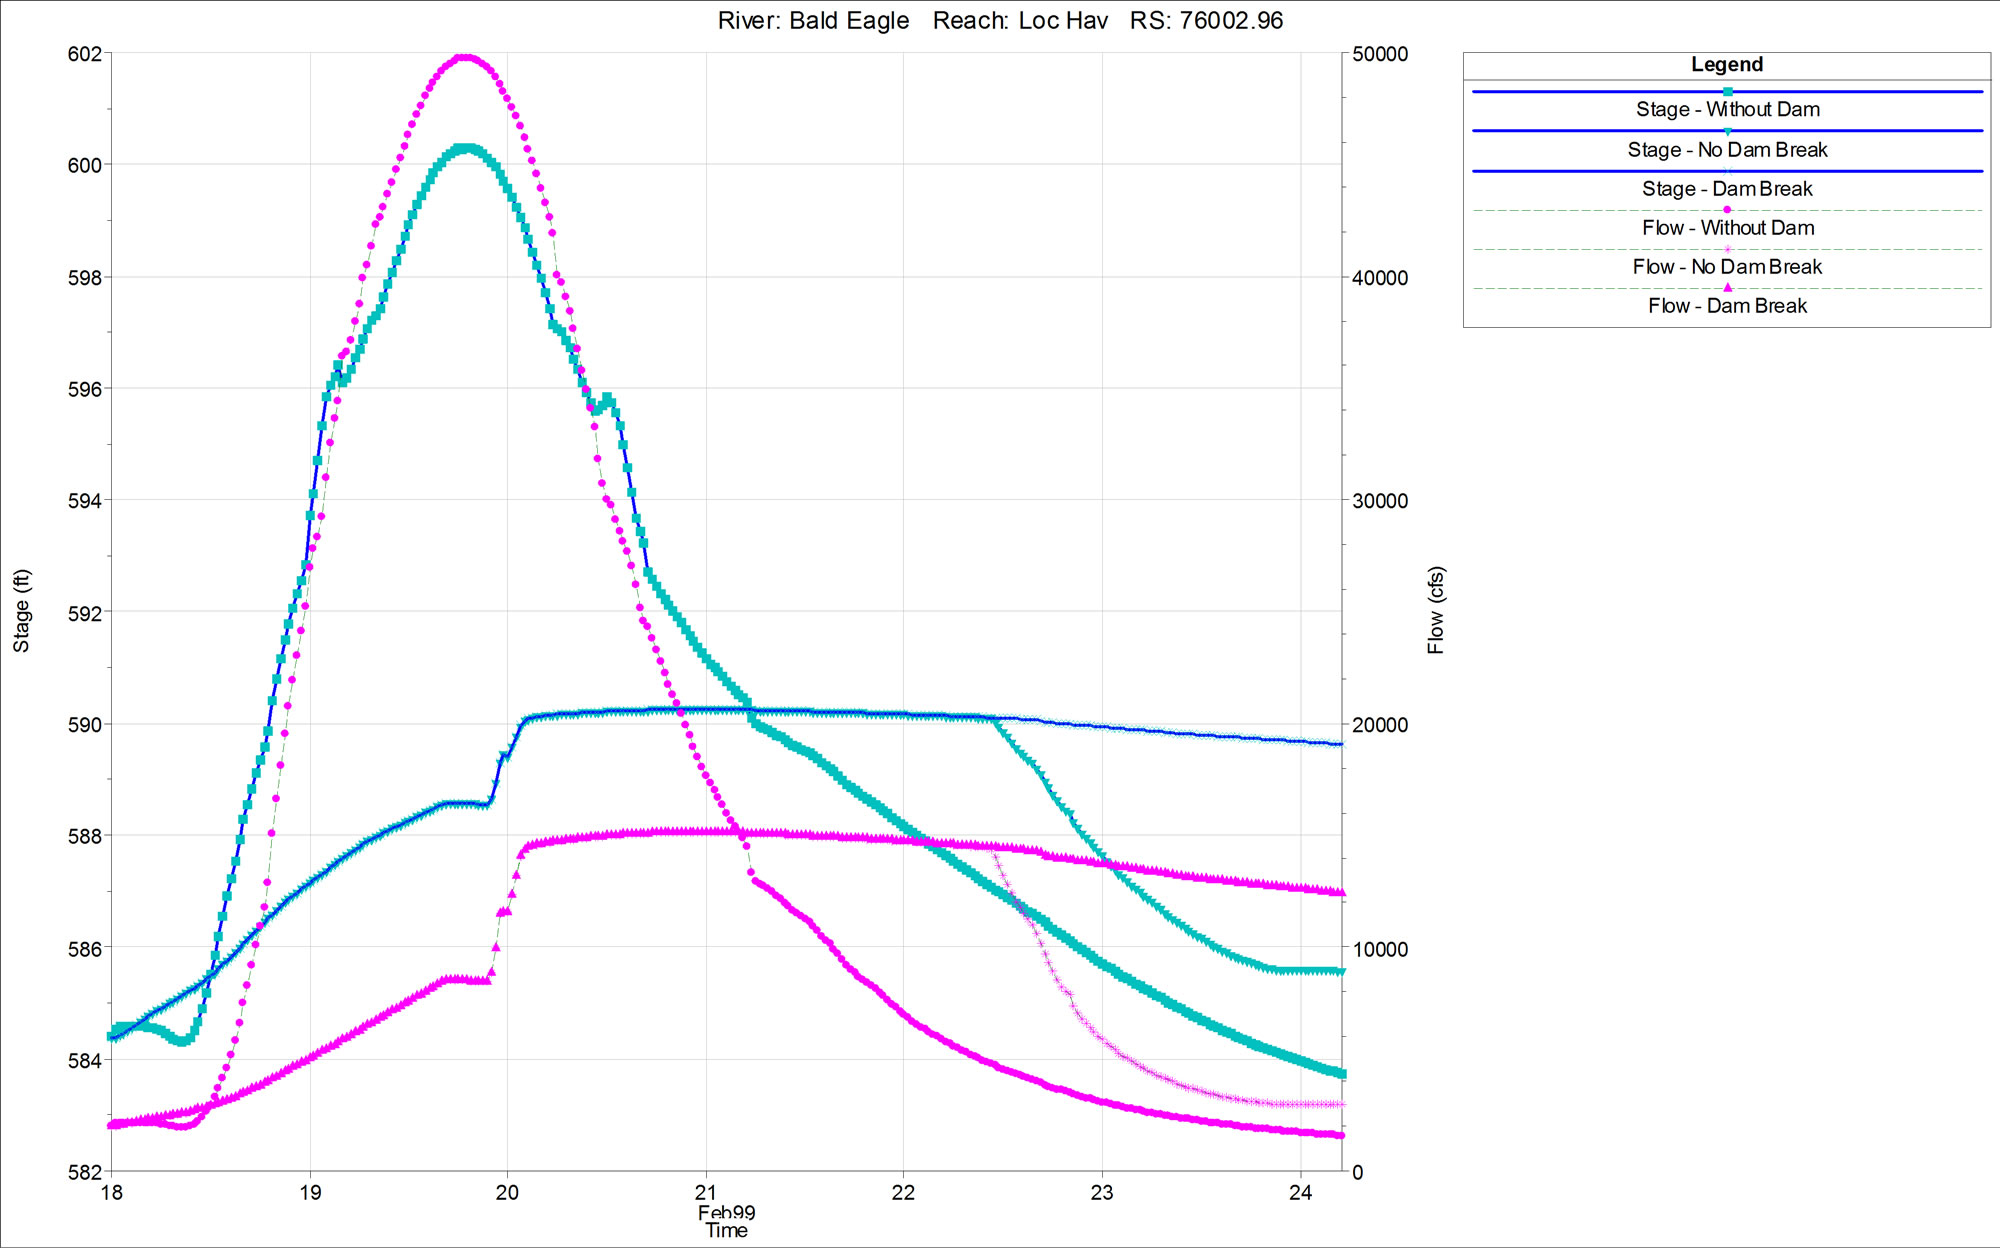
Figure 7. Stage and flow hydrographs at river station 76002.96 (Blanchard).
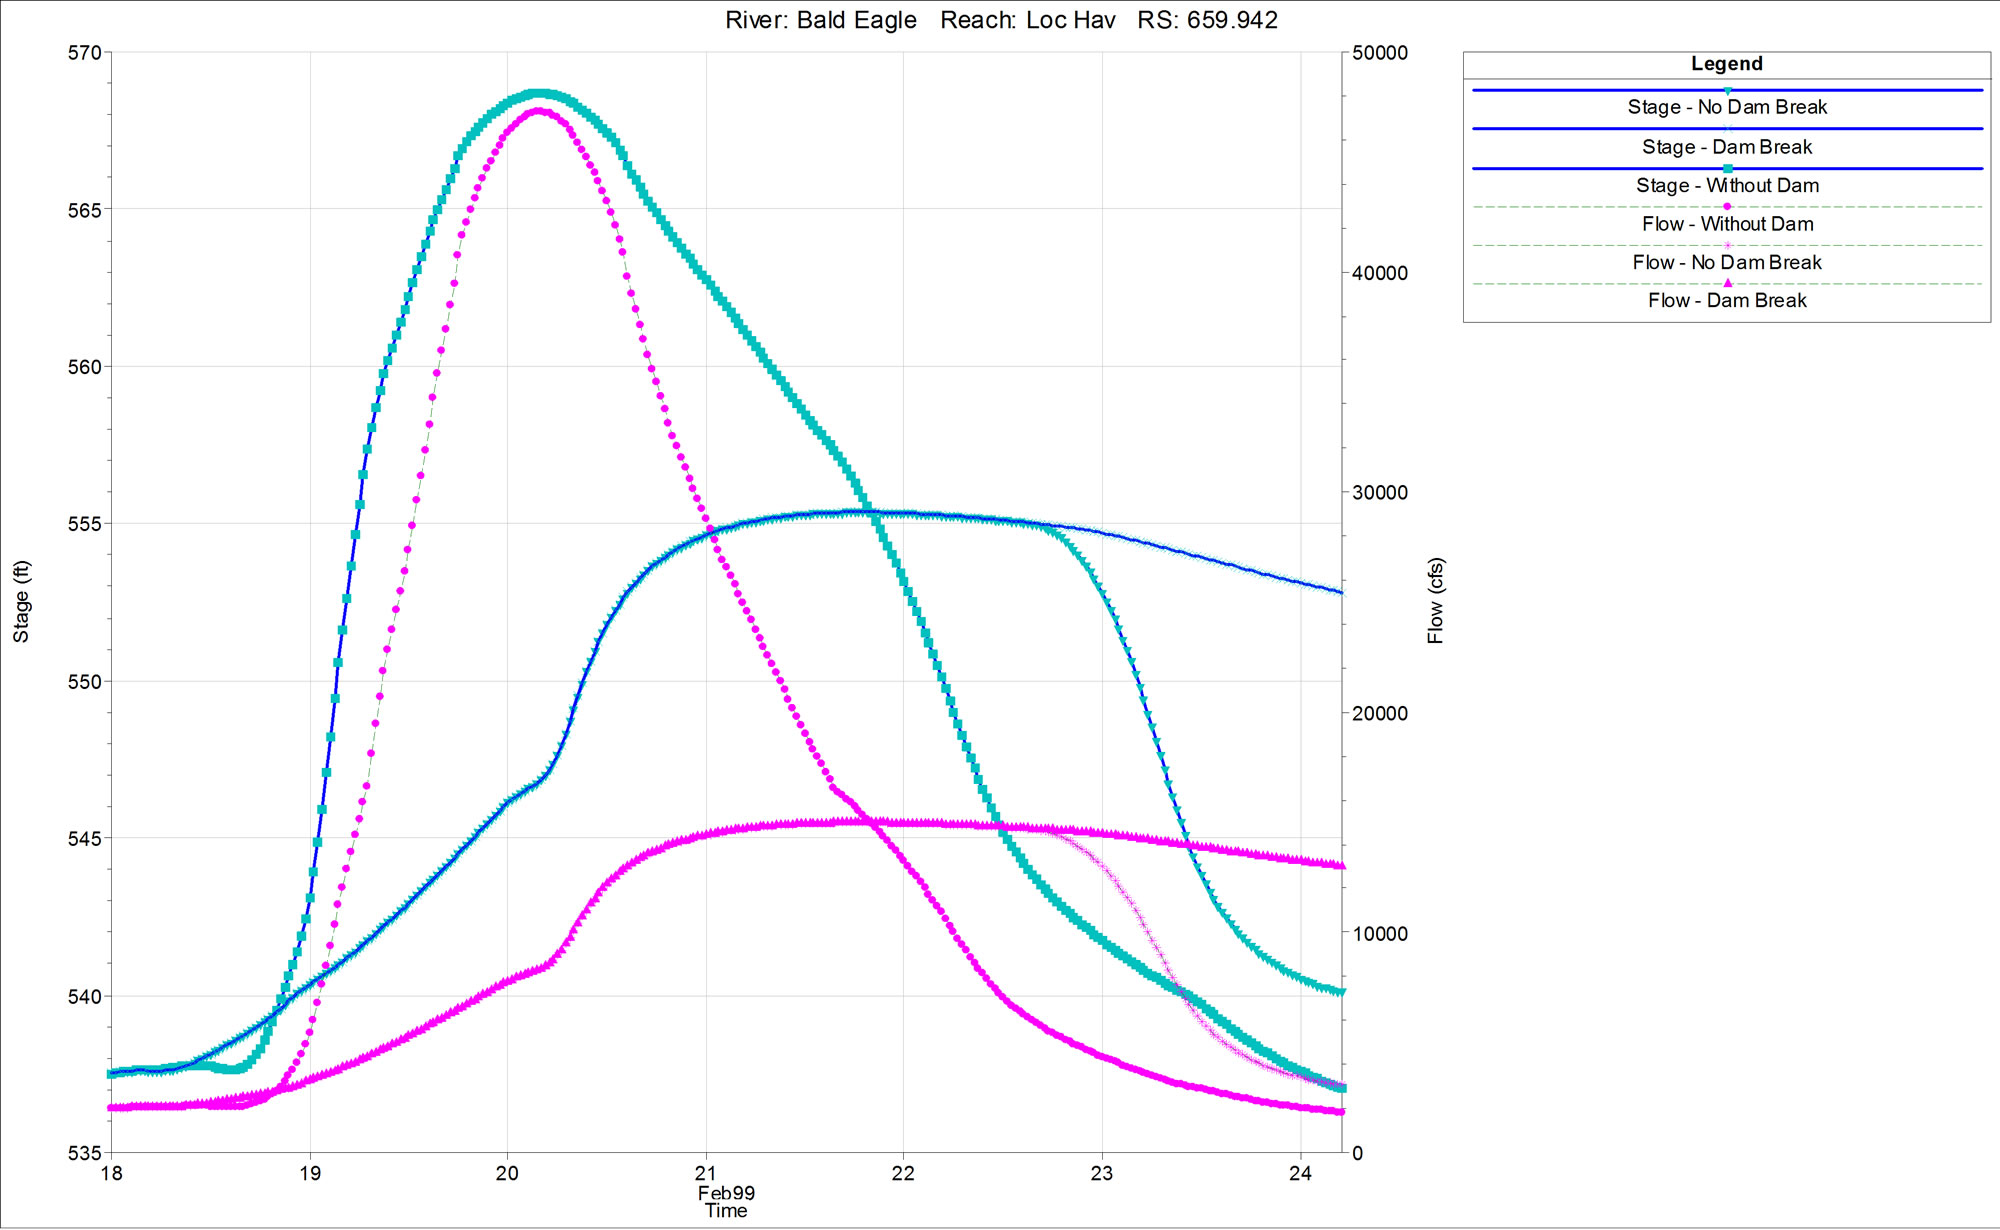
Figure 8. Stage and flow hydrographs at river station 659.942 (Lock Haven).
Table 2 also depicts that the construction of the dam changes the velocity in the Bald Eagle Creek. Dam controls the flood, but brings the problem of sediment deposition and erosion as well.
Table 3 gives the dam break sensitivity analysis 1 (±20%), and three scenarios are compared at four different locations. There is no significant difference among “break without adjustment”, “adjusted full formulation time”, “adjusted breach width”, “adjusted breach depth” and “adjusted breach side slope” in Maximum Water Surface Elevation (Max. W.S. Elev) and Velocity at each identified location.
However, Max. W.S. Elev of “break without adjustment” is a bit less than that of all other adjusted scenarios. It sounds that there exists a critical set of breach parameters corresponding to a “minimum Max. W.S. Elev”.
Table 3 also shows that Max. W.S. Elev is not so sensitive to the adjustments of given breach parameters within ±20%. Only in the case of adjusted full formulation time at the upstream of the dam (RS 81849.41), Max. W.S. Elev (666.38 feet) in +20% is 0.01 feet higher than Max. W.S. Elev (666.37 feet) in –20%. Greater full formulation time delaying the release of impounded water behind the dam might be the reason.
Table 4 shows the dam break sensitivity analysis 2 (±50%) and no significant change is observed either. However, in addition to the slight change in the scenario of “adjusted full formulation time” at the upstream of the dam, Max. W.S. Elev (666.37 feet) in +50% is 0.01 feet higher than Max. W.S. Elev (666.36 feet) in –50%.
No further new information is shown in Table 5 as compared with Table 4. For Sayers Dam break analysis, the Max. W.S. Elev is insensitive to the change of the given dam breach parameters.
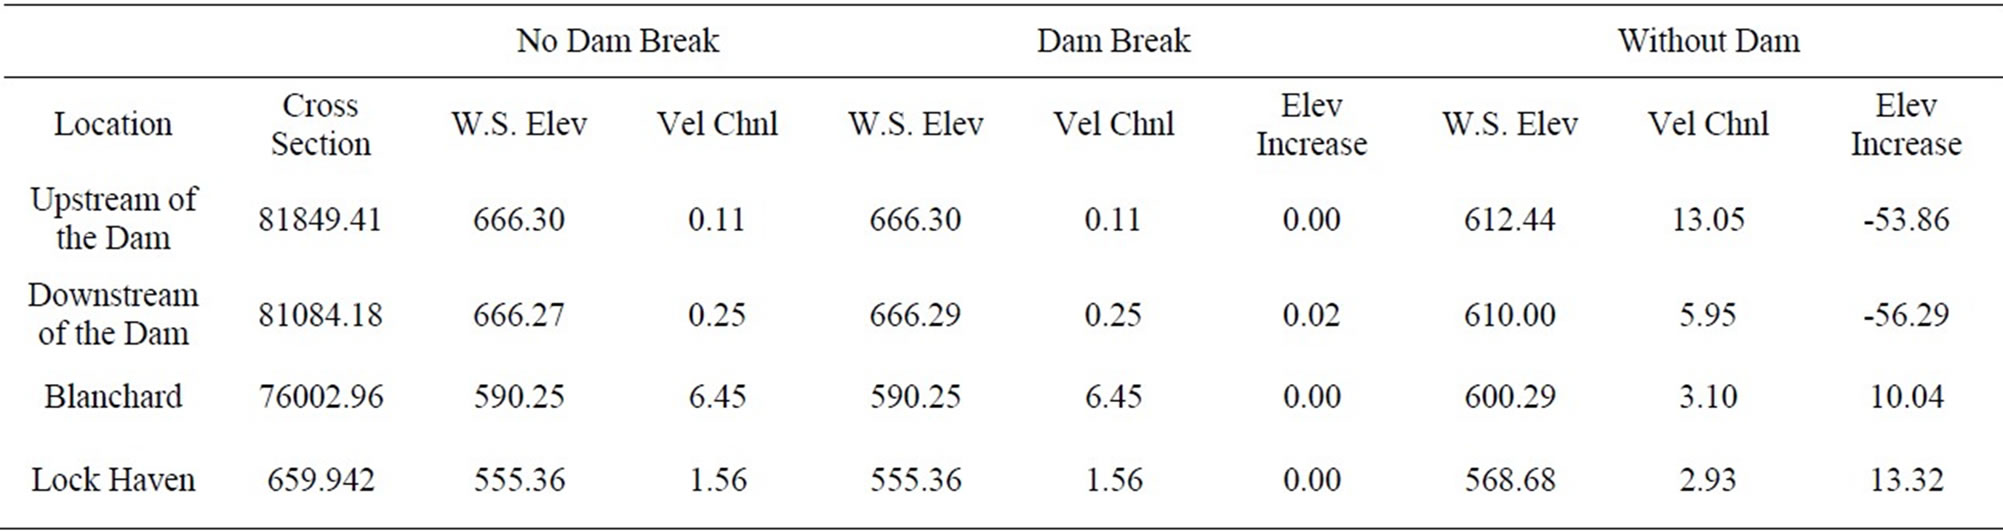
Table 2. Incremental results of dam failure analysis.
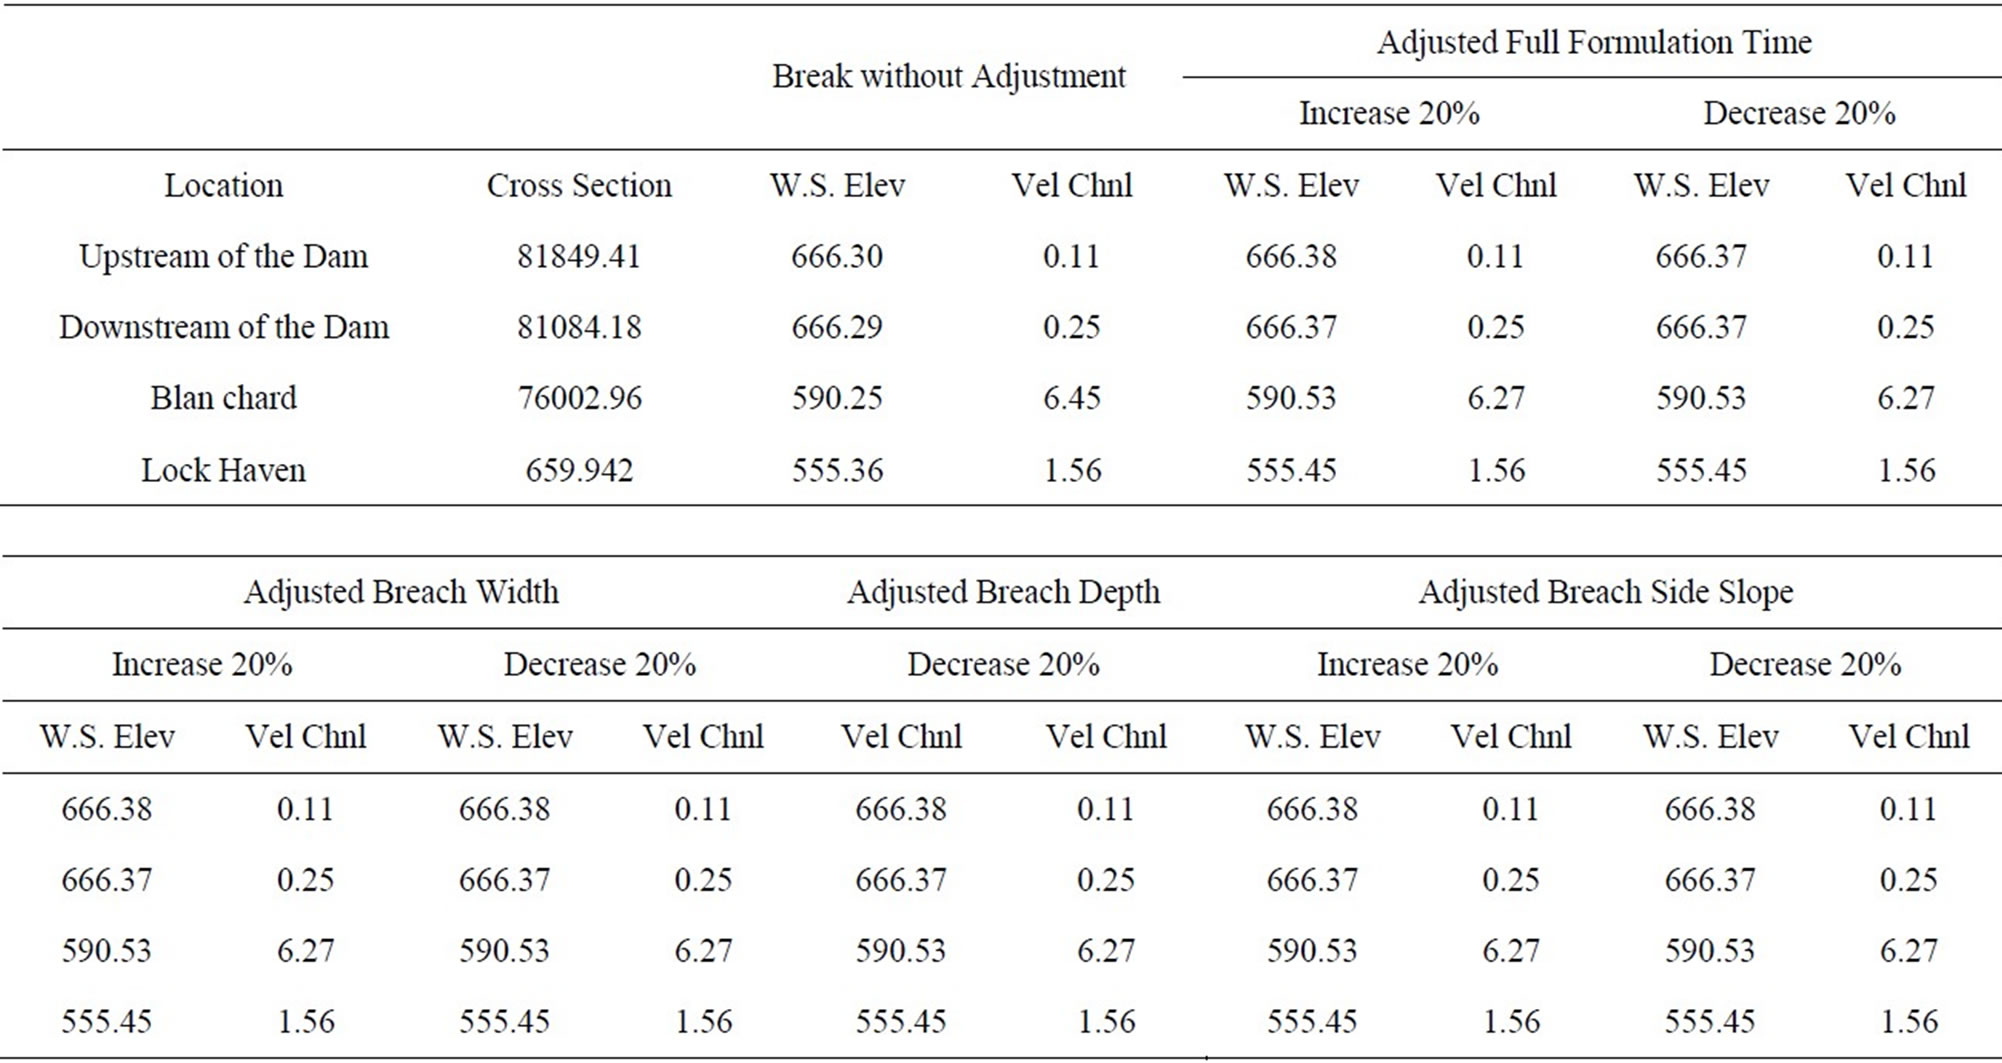
Table 3. Dam break sensitivity analysis 1 (±20%).
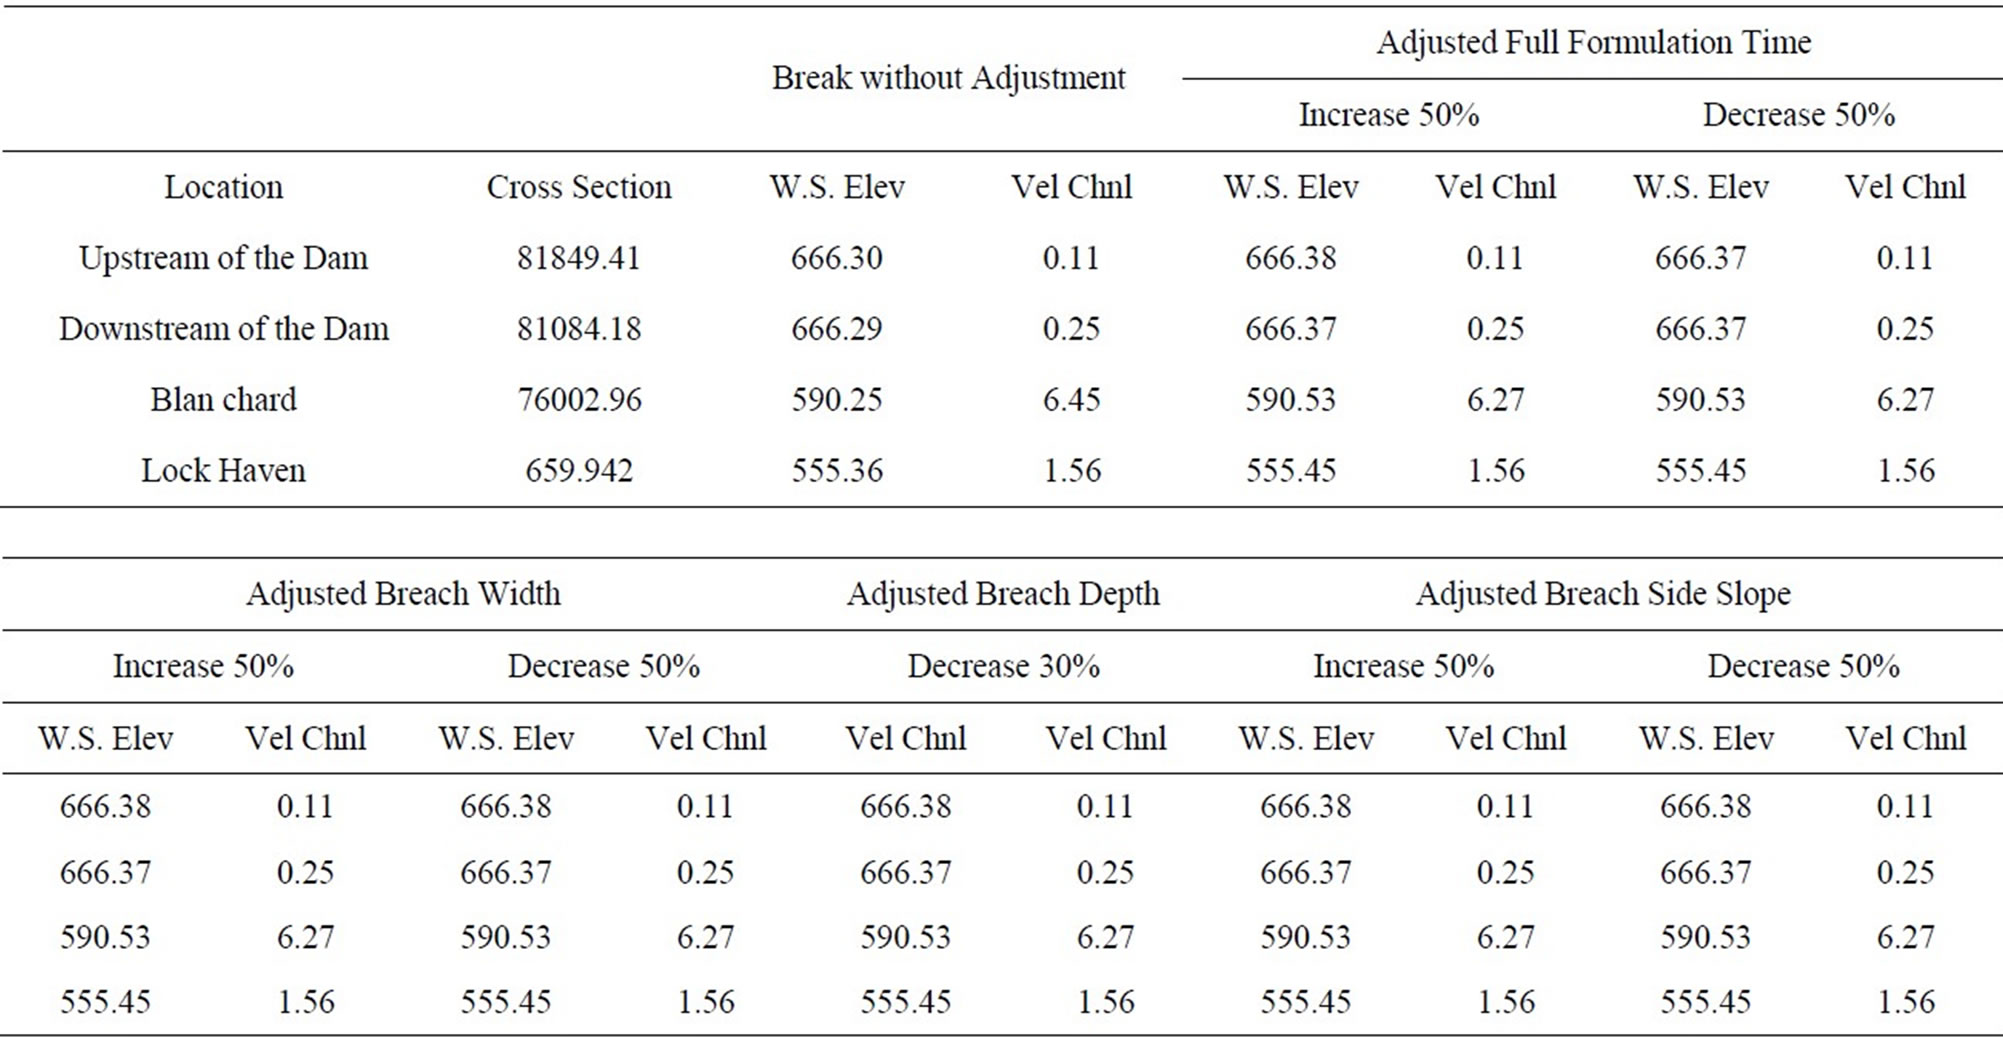
Table 4. Dam break sensitivity analysis 2 (±50%).
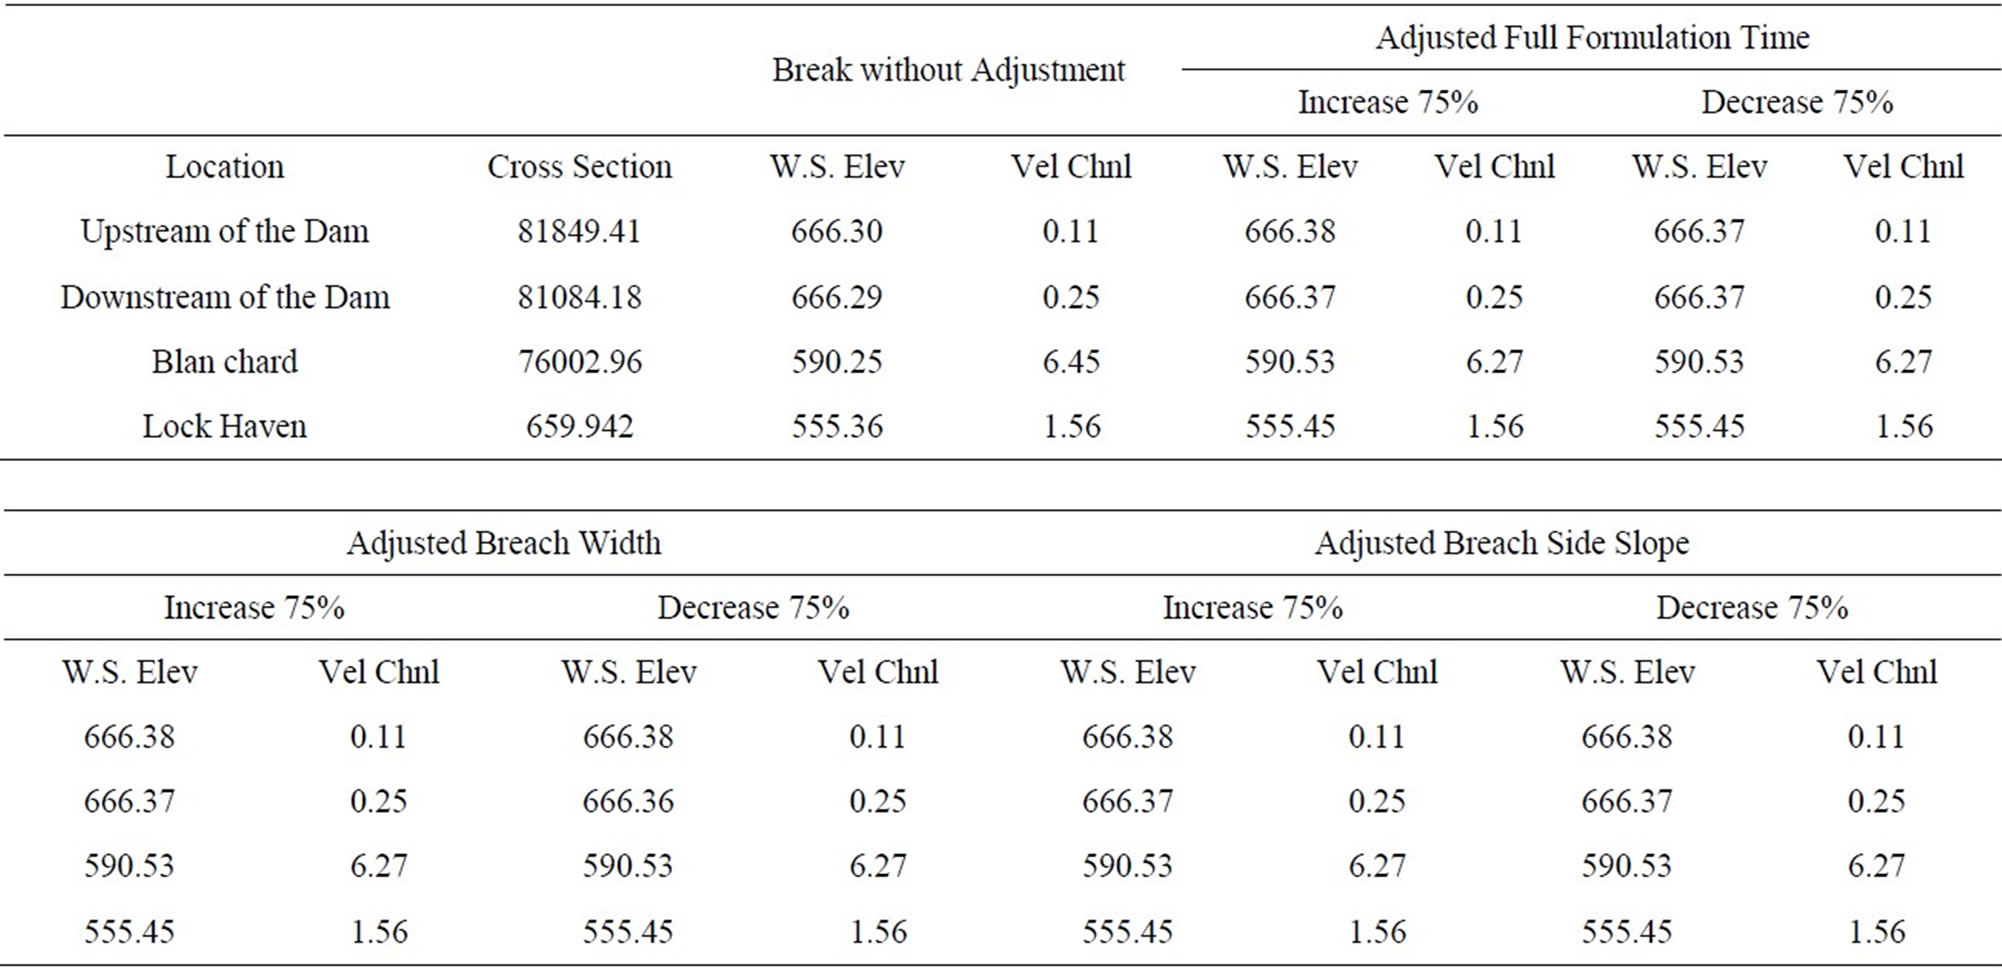
Table 5. Dam break sensitivity analysis 3 (±75%).
The comprehensive dam break analysis is a very important step in assessment and decision-making of the damage following a dam break accident. The method used in this study can be applied to other cases with similar situations.
4. Conclusions
Dam break is a complicated and comprehensive process and the actual failure mechanics are not well understood. Neither current physical based models nor empirical models could fully explain dam break mechanisms and impacts.
The dam break tool in HEC-RAS was applied to Foster Joseph Sayers Dam break simulation and analysis based on given geometry data. The dam break due to piping elongates the time period of high water surface level, which increases the duration of risk. However, the dam break does not increase the downstream maximum water surface elevation significantly at previous design PMF. Foster Joseph Sayer dam break has greater impact on the downstream location where is nearer the dam in accordance with the comparison of the hydrographs at different locations. In accordance with the sensitivity analysis, the changes of dam break parameters had no much influence on the downstream Max. W.S. Elev, which may result from starting trigger water surface elevation, boundary conditions including the inflow hydrograph and gate opening height.
REFERENCES
- Dam Safety Office, “Prediction of Embankment Dam Breach Parameters–A Literature Review and Needs Assessment,” Water Resources Research Laboratory, Denver, July 1998.
- T. Dincergok, “The Role of Dam Safety in Dam-Break Induced Flood Management,” International Conference on River Basin Management, Kos, 23-25 May 2007, pp. 683-691.
- R. A. Dodge, “Overtopping Flow on Low Embankment Dams–Summary Report of Model Tests,” U.S. Bureau of Reclamation, Denver, August 1988, pp. 27-28.
- D. M. Gee and G. W. Brunner, “Dam Break Flood Routing using HEC-RAS and NWS-FLDWAV,” Proceeding of Environmental Engineering; Water Resources Management, World Water Congress, 2005.
- US Army Corps of Engineers, “HEC-RAS River Analysis System, User’s Manual Version 4.0 Beta,” Hydrologic Engineering Center, November 2006.
- US Army Corps of Engineers, “HEC-RAS River Analysis System, Applications Guide Version 3.1,” Hydrologic Engineering Center, November 2002.
- G. R. Powledge, D. C. Ralston, P. Miller, Y. H. Chen, P. E. Clopper and T. D. M. Emple, “Mechanics of Overflow Erosion on Embankments. II: Hydraulic and Design Considerations,” Journal of Hydraulic Engineering, Vol. 115, No. 8, 1989, pp. 1056-1075. doi:10.1061/(ASCE)0733-9429(1989)115:8(1056)
- V. P. Singh and P. D. Scarlatos, “Analysis of Gradual Earth-Dam Failure,” Journal of Hydraulic Engineering, Vol. 114, No. 1, 1988, pp. 21-42. doi:10.1061/(ASCE)0733-9429(1988)114:1(21)
- D. M. Temple and G. J. Hanson, “Headcut Development in Vegetated Earth Spillways,” American Society of Agricultural and Biological Engineers, Vol. 10, No. 5, 1994, pp. 677-682.
- U.S. Army Corps of Engineers, “Engineering and Design–Hydrologic Engineering Requirements for Reservoirs,” EM 1110-2-1420, 31 October 1997.
- U.S. Bureau of Reclamation, “Downstream Hazard Classification Guidelines,” ACER Technical Memorandum NO. 11, Assistant Commissioner-Engineering and Research, Denver, December 1988.
- Dam Safety Office, “Predicting Embankment Dam Breach Parameters–A Literature Review and Needs Assessment,” Water Resources Research Laboratory, San Francisco, August 1997.
- T. L. Wahl, “Uncertainty of Predictions of Embankment Dam Breach Parameters,” Journal of Hydraulic Engineering, Vol. 130, No. 389, 2004, pp. 389-397. doi:10.1061/(ASCE)0733-9429(2004)130:5(389)
- R. A. Wurbs, “Dam-Breach Flood Wave Models,” Journal of Hydraulic Engineering, Vol. 113, No. 29, 1987, pp. 29-46. doi:10.1061/(ASCE)0733-9429(1987)113:1(29)