Journal of Water Resource and Protection
Vol.2 No.2(2010), Article ID:1295,8 pages DOI:10.4236/jwarp.2010.22014
Regulation of Brahmaputra-Jamuna River around Jamuna Bridge Site, Bangladesh: Geoenvironmental Impacts
1Graduate School of Natural Science & Technology, Okayama University, Okayama, Japan
2Department of Environmental Sciences, Jahangirnagar University, Dhaka, Bangladesh
3Department of Geological Sciences, Jahangirnagar University, Dhaka, Bangladesh
E-mail: amirhb75@yahoo.com
Received December 11, 2009; revised January 2, 2010; accepted January 10, 2010
Keywords: Brahmaputra-Jamuna River, Geoenvironment, Geohazard, GIS, Remote Sensing, River Regulation
ABSTRACT
This study is conducted to evaluate the ongoing geoenvironmental impacts of Brahmaputra-Jamuna (BJ) River around the Jamuna Bridge (JB) site which was modified prior to the construction of Jamuna Bridge in 1996. Remote sensing and GIS techniques are adopted to evaluate the temporal and spatial geohazards. This study shows that the intensity of channel shifting has been increased due to regulation of river width at Sirajganj–Bhuiyapur section from 11 km to 4.8 km. Planform analysis shows that the major channel has been stressed to migrate (315 m/year) eastwards. The phenomena of channel changes are predicted to be the consequences of interaction of water flow, sedimentation and channel corridor. The erosion and deposition have complicated variations over time and space due to the abrupt changes of flow and sedimentation around the regulated section. Due to width reduction, the bridge site in the braided system acts as sluice gate which can not accommodate the entire flow to release downstream properly. The helical flow developed with the interaction of guide bund creates local scours and helps to shift the river bank eastward.
1. Introduction
Fluvial channels usually maintain specific physical characteristics, flow regimes and capacity for sediment transportation controlled by the hydrodynamics environment of existing river basins. Any alterations in these systems perhaps change the response of some of those phenomena. The hydraulic structures developed across the flow path create a strong perturbation of fluvial dynamics, changing the natural cycle of the river and interfering in the transportation and deposition processes, together with a reduction of biodiversity by destroying the natural habitat of many species [1] and turn into hazard. Fluvial hazards involve both flooding and river bank erosion, although only the river bank erosion aspects can be considered as geomorphic hazards [2]. According to Gares et al. [2], geomorphic hazards can be defined as the group of threats to human resources resulting from the instability of the earth’s surface features. The significance of these features is intense on the response of landforms to the processes, rather than on their original source. The concept of geomorphic hazard is most widely used by [2, 3] geomorphologists which has an important task to fulfill in terms of natural hazards research. Magnitude and frequency, as well as temporal and spatial scale, are key geomorphic concepts which are strongly interlinked to natural hazards. The Brahmaputra (2900 km length), one of the largest braided rivers in the world, originates from the Himalayas and enters Bangladesh at Kurigram as Jamuna (length 200 km). Though the history of Jamuna is not more than 250 years, it shows very drastic changes in its course due to anthropogenic influences. Recently, it has been modified at its corridor by river training works (between 1994 and 1995) prior to construction of the Jamuna Bridge (JB). Before regulation, the river reach was a well-defined braided system that maintained its natural flow by adjustment within the valley floor. The natural width of the river was 11 km at the JB section before its structural modification. Later it was trained about 6 km from both sides for JB construction (Figure 1). Furthermore, the river flow was partly restricted at different points in upstream by construction of hydraulic structures like hardpoints, dykes, spur and groynes, which were especially located in the west bank (e.g., Sirajganj, Kazirpur, Kalitoli, Shuvogacha and Sariakandhi regions). Today, these training methods together with the bridge construction are the mainly responsible for the changes of hydraulic environment in the studied section. Consequently, the retained structures and the JB were developed a water slope between the upstream and downstream level of water in the bridge section which is mainly responsible for bank erosion. Besides, the loss of agricultural lands, settlements and important structures by geohazard create severe stress on the socioeconomic and environmental conditions of Bangladesh. Of late, attention has been paid to the hysterical characteristics of the river reach around the bridge section for preand postbridge construction. The use of Remote sensing (RS) data and GIS technique has been integrated into mapping and analysis of such geomorphic processes within the natural and human hazards context. However, the present study is conducted by the integration of RS and GIS along with geomorphological observation. The impacts of bank erosion in the regulated river in the world are also described in the standard literature [4,5,6].
2. Study Area
Jamuna Bridge site is located between Tangail and Sirajganj town (Figure 1). It lies within latitude 24022′50″– 24026′30″N and longitude 89055′30″–89058′45″E. The river reach is characterized by well defined braiding nature, meta-stable islands, nodes, sandbars, shifting anabranches and rigorous bank erosion. Geomorphologically, the eastern bank is bounded with the lateral extension of Madhupur Tract and the west bank is the Barind Tract, which is composed of silty clay. During monsoon, the average annual discharge of Jamuna River (JR) at Bahadurabad point is about 50000 m3/s. However, the discharge increased to 100000 m3/s during the 1988 and 1998 flood events. The average water surface slope is approximately 6.5 cm/km for the lower reach.
3. Geomorphology
The river morphology in lower Brahmaputra-Jamuna (BJ) is well-defined braided with an average channel width of about 12 km and a valley floor width of 80–90 km. The channel is also extremely unstable and itinerant. The main channel of Brahmaputra at Bhahadurabad point was switched southwards and opened as Jamuna due to the result of tectonic uplift of Madhupur Tract during the 1762 earthquake episode. Presently, a huge landmass in Brahmaputra and Tista floodplain has been lost by severe erosion, predominantly on the west (Sirajganj) and east (Tangail) banks of JR. Braiding is most well developed in this system. The major channel is marked by successive division and rejoining of secondary channels and
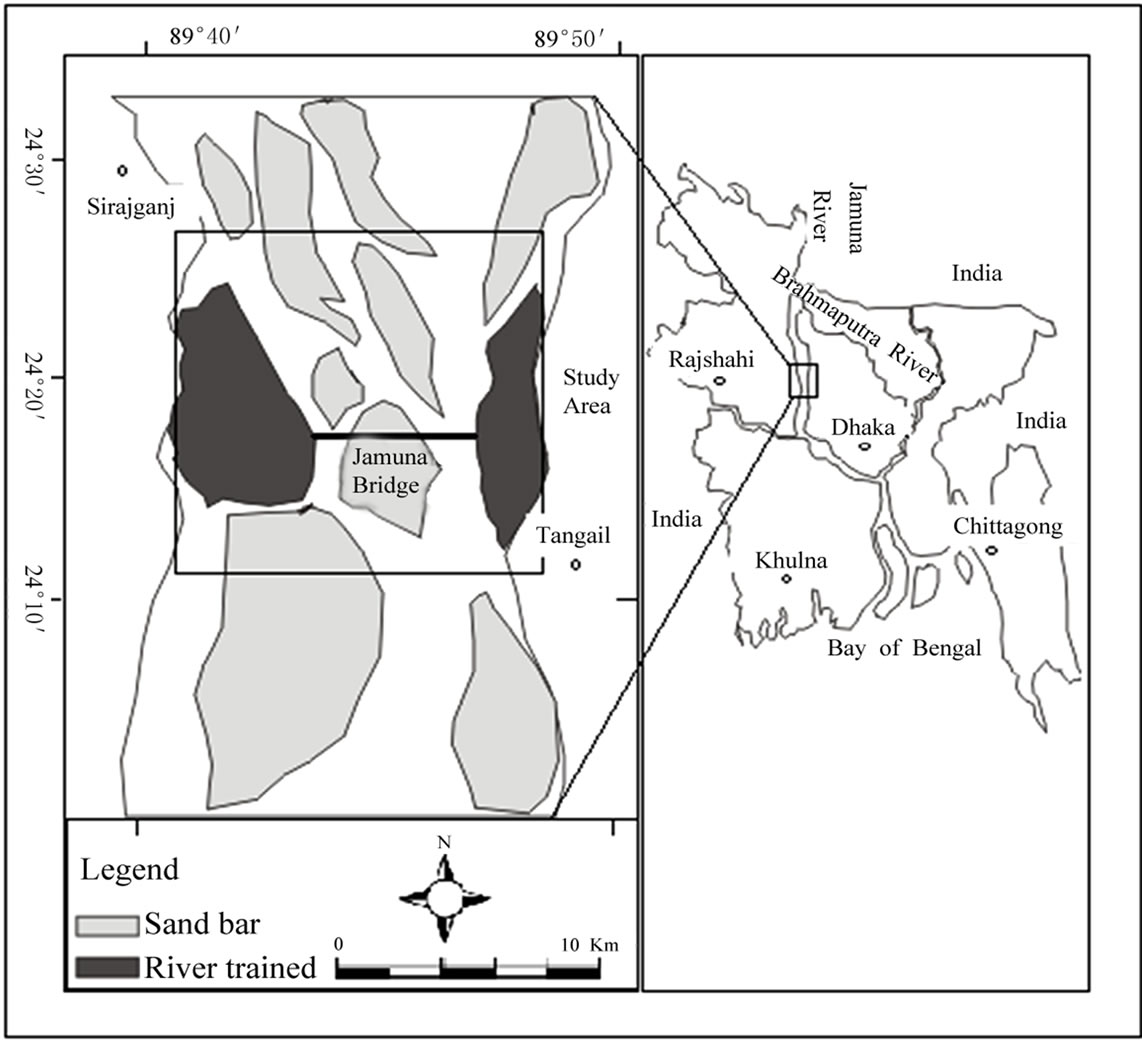
Figure 1. Location map of the study area.
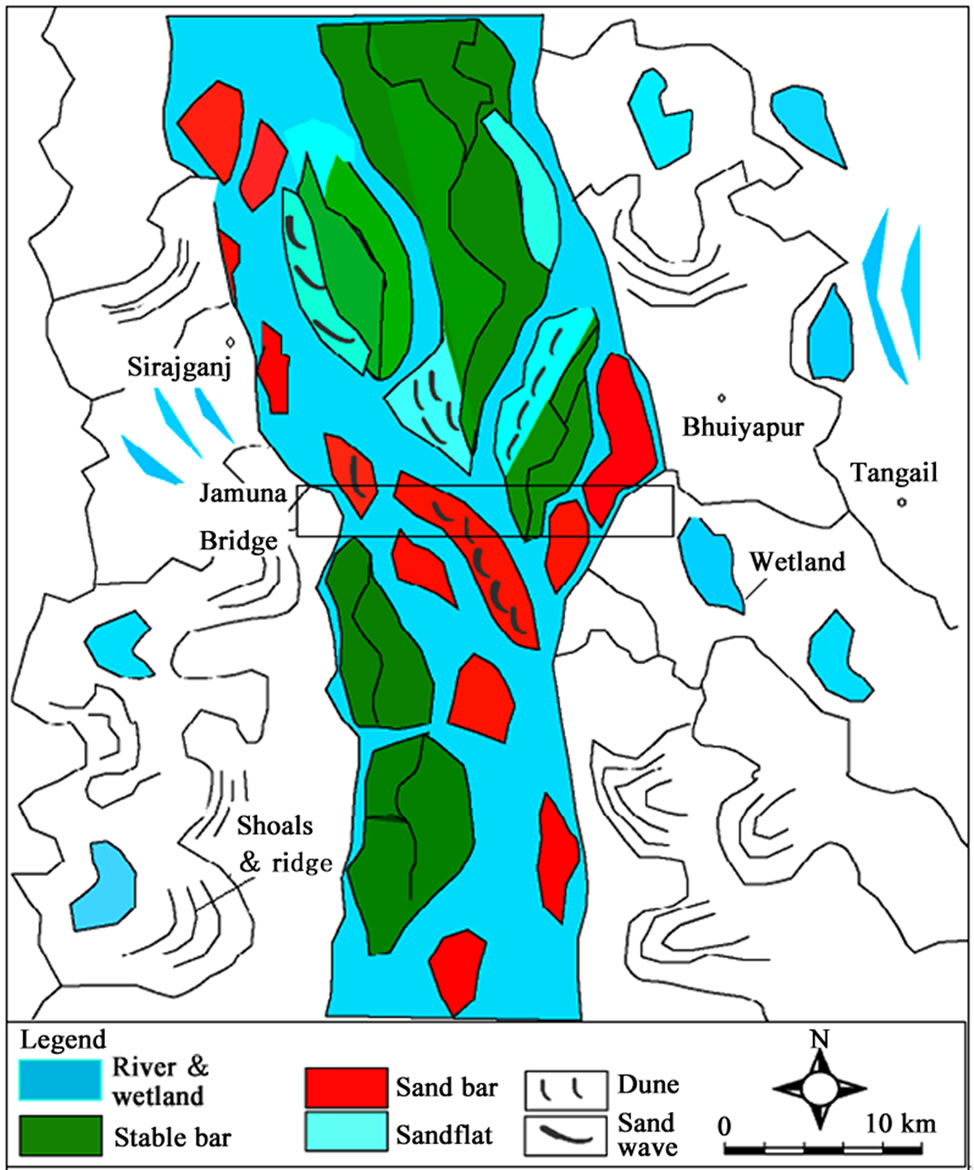
Figure 2. Geomorphic features of the study area.
crevasses around the alluvial islands. In planform view, it consists of one major channel, three secondary channels, enormous abandoned channels, bars (bar elements: mid-channel bar, vegetated island and significant sedimentary structures), chute channel and floodplains within the study reach (Figure 2).
Floodplain in the study area stands about 1–2 m above the level of sand flats, and is covered with grasses, bushes and, in some places, large trees. The meander distributaries in this section frequently change their positions due to the hydrodynamic variability of the parent river. Numerous remnants of meander loops, shoals and ridges are observed in the floodplain of BJ River (Figure 2). The length and width of each shoal and ridge are 100 m to few hundred meters. The shoals are often inundated with water in dry season (Figure 2). They are primarily composed of silt and mud and perennially inundated by flood water.
4. Methodology
4.1. Data
The principal data used in this study area are satellite remote sensing images for 8 different years, between 1992 and 2001 due to their availability in Bangladesh space research agencies. By reason of inconvenience of satellite images in 2001 onward, the GPS tracking data for the banklines was used to incorporate the latest changes of the channel planform in the geoenvironment. Only Landsat TM images of 30 m ground resolution were selected to avoid heterogeneity among the respective samples. Geometric corrections were performed to rectify the respective images into the UTM-46N projection system. As the study area is a completely flat land, the orthogonal transformation was not performed. Bank lines of 2008 were tracked by a hand GPS (Explorist, Model 200) with a precision of ± 1.0 m.
4.2. Delineation of Bank Line
ERDAS/Imagine 8.6 software was used for analysis of the remote sensing data. For developing GIS database, one continuous polygon was created to represent the channel for each time series. On-screen digitations at a scale of 1:4000 were carried out, and a methodological consistency was maintained by having one operator for bank line delineations. In this study, bank line is delineated as the sharp contrast between the vegetative and non-vegetative part of the channel, as an elongated area where stream flow occurred with sufficient frequency,
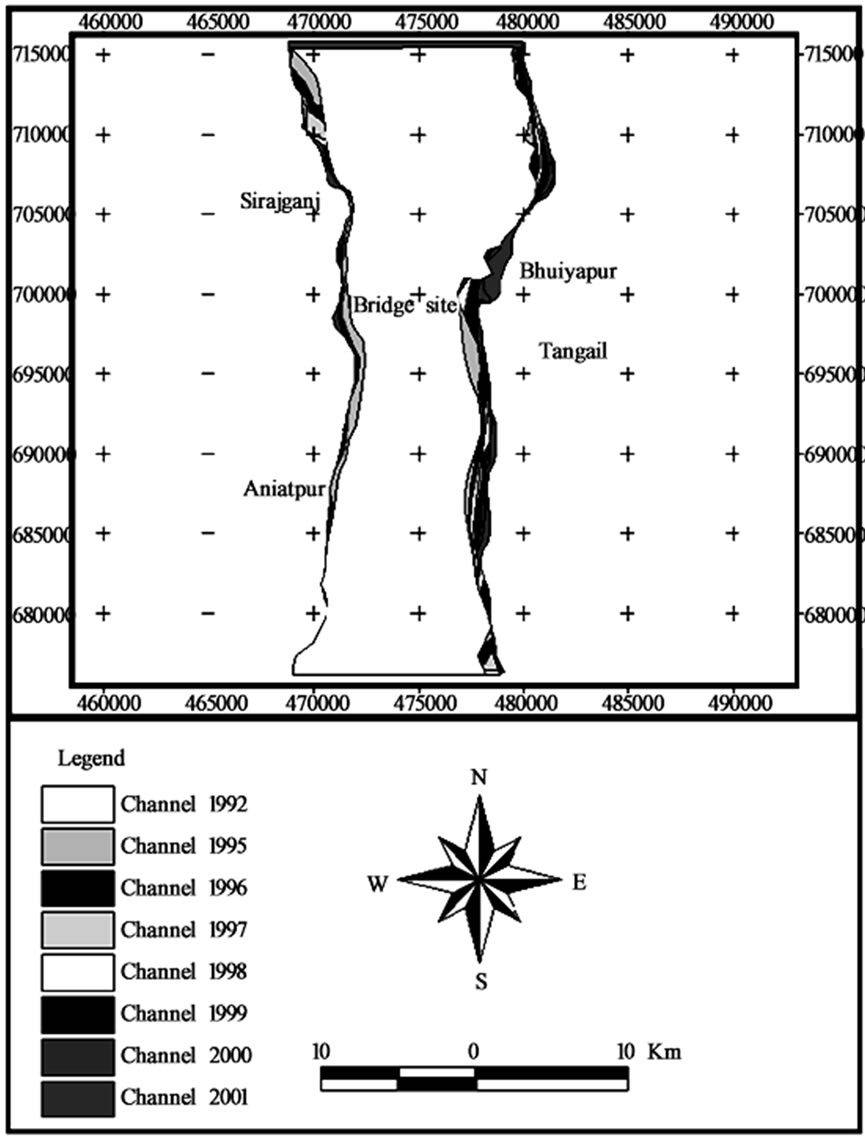
Figure 3. Trend of bank line shifting of Jamuna River around Jamuna bridge site.
force, and duration to discourage the presence of vegetation such that 90% or greater of this area is bare ground or water. In most cases, bank lines were identified based on the visual interpretation of the images, but in some places, distinguishing between active and abandoned channels was difficult. In such cases, the guidelines of EGIS [7] were followed, where the branched channels which did not return to the trunk river, and channels narrower than 100 m were located outside bank lines. Field observation was conducted for verification of remote sensing data and incorporating the sediment signature. Bank lines of 2008 tracking from GPS were superimposed with the consecutive bank line for identifying the present scenario of erosion and depositional phenomena.
Point to point measurement of river width was conducted from raster image for calculating the variation of river planform.
4.3. Accuracy Assessment of Image Classification
Accuracy assessment is an imperative marker to form a plan regarding the quality and consistency of results and the ambiguity derived from remote sensing (RS) data [8]. In the landscape classification studies by the post-classification comparison method, it is essential to give concentration towards the classification accuracy of different classes. Because, the classification error will more importantly influence the accuracy of the results. As such, Mather [9] suggested that a standard of 85% accuracy is suitable for digital image classification. Furthermore, Congalton [10] recommended that a least of 50 samples for each land cover class in the error matrix would be adequate to evaluate the classification results.
Consequently, an accuracy assessment for the classification of the study area was conducted using a minimum of 72 pixels per group from the blend image data. The location of the control points (CP) was selected using random stratified method, which corresponded to different land classes within the study area. The mean value of overall classification accuracy was determined to be 88 percent. The details of overall class accuracy and Kappa coefficients for the respective studied images are presented in Table 1. It is shown that the sand body maintains hundred percent accuracy at all samples and the water body maintains higher than 87 percent for all images. Despite this, the accuracy of wetlands is about 65 percent due to the interruption of seasonal sand sheet and human interference.
5. Results and Discussion
For identification of the river planform changes due to structural development, a comparative analysis of channel changes (Figure 3) around JB site has been conducted by GIS techniques over a period of 9 years (1992–2001). The superimposition of the channel corridor of consecutive years (Figure 3) accounts for the dramatic changes
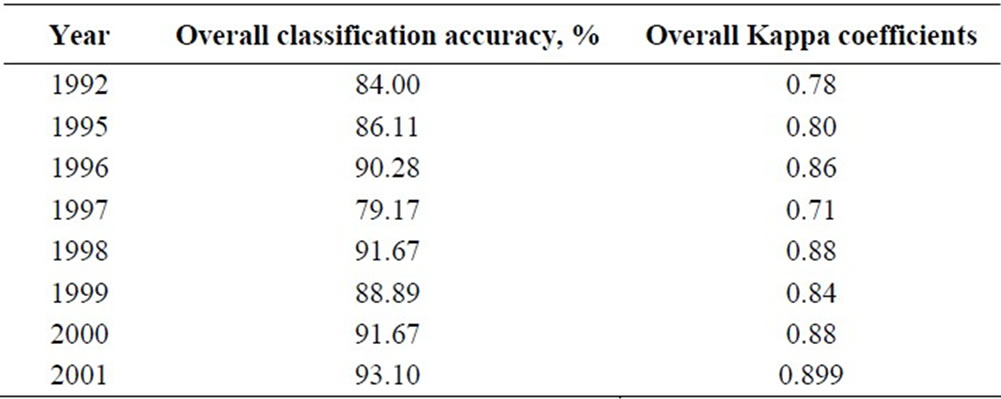
Table 1. Statistics of overall classification accuracy for the Landsat TM images.
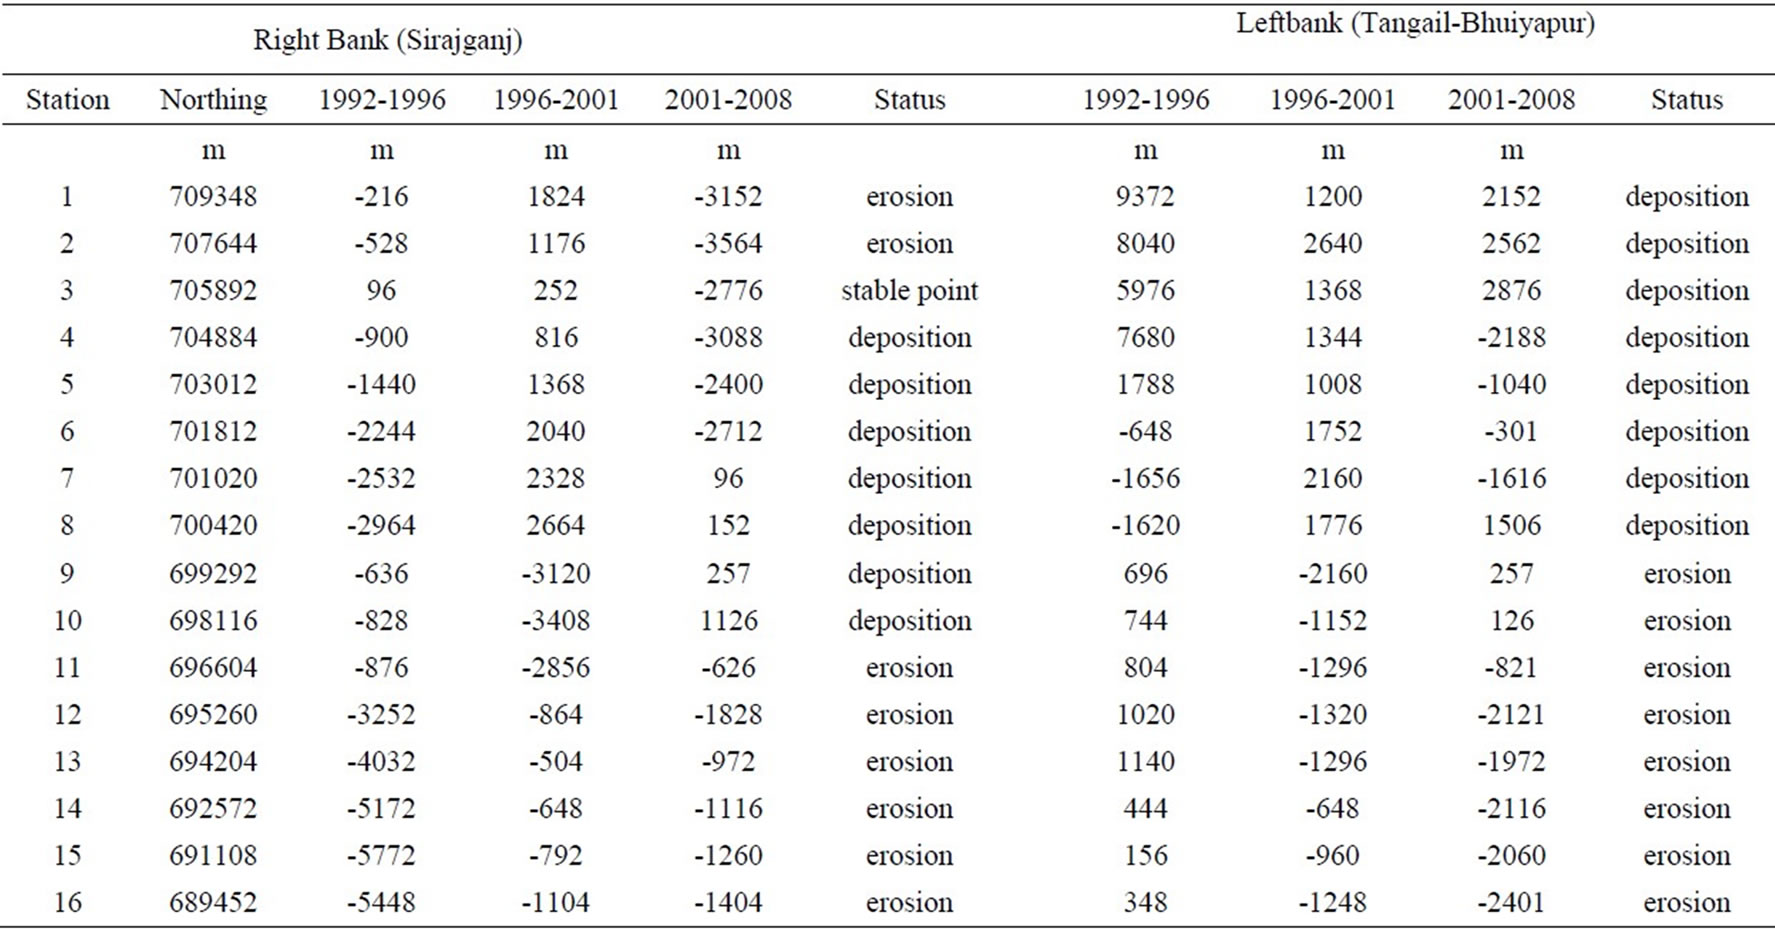
Table 2. Erosional and depositional status of Jamuna River around Jamuna Bridge site. Negative (-) and positive (+) signs indicate erosion and deposition in the numerical values respectively.
of post bridge adjustment. In Figure 3, it is shown that the erosion is predominantly eastwards (Bhuiyapur) around the bridge sites and downstream part, whereas the west bank shows deposition tendency (from bridge to Aniatpur). In fact, the temporal and spatial migration is prominent in three different points of the studied sections, though the entire river is considerably migrated eastwards (Table 2). The rate of bank line migration at Bhuiyapur site was calculated to be 315 m/year and the maximum bank line migration (2.5 km) was also observed near the bridge abutment of Bhuiyapur from 1992 to 2001 (Figure 3).
Besides, the rapid shifting and regional scouring were observed along the Sirajganj Sadar Thana. The average migration rate calculated from the GIS technique of this point was 125 m/year. The overall planform change confirms the rapid channels responses in the form of accelerated erosion and deposition near the bridge site and Sirajganj hardpoint (Figure 4). In fact, channel response in this study has been characterized by net aggradations and depositions at different locations.
The GPS tracing of bank lines of 2008 was also incorporated in the satellite imagery to evaluate the current intensity of erosional vulnerability. The total aggradations and depositions immediately following the bridge from 1992 to 2008 have been projected in Figure 5. The maximum erosion (4.0 km) was determined at Bhuiyapur site from 1992 to 2008. In contrast, the downstream part of west banks exhibited remarkable stability between 1992 and 2008. This site apparently shows the depositional phenomenon in most of the points except the upstream part of Sirajganj town and downstream part of Aniatpur, where up to 3.5 km of erosion were observed. Hence, the net erosional phenomena between 2001 and 2008 was about one and half times higher than that of the previous phase (1992–2001) in both banks of the studied river section. The point to point measurement of river width, calculated from raster data (Landsat TM image) shows that the maximum bank line shifting is observed between northing N69600 and N702000 which covers the immediate upstream and downstream parts of the bridge site (Figure 4).
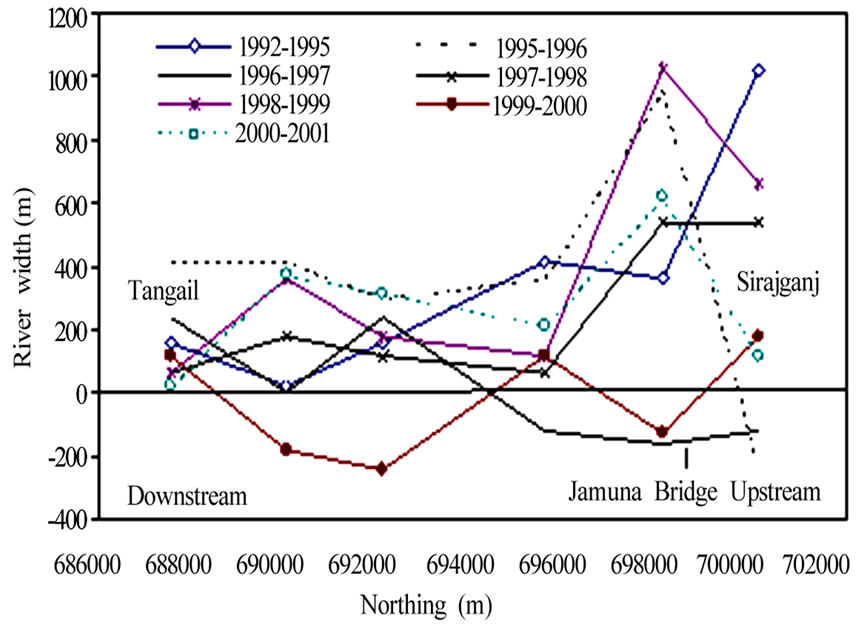
Figure 4. Changes of bank line from 1992 to 2001 around bridge site (calculated from raster images).
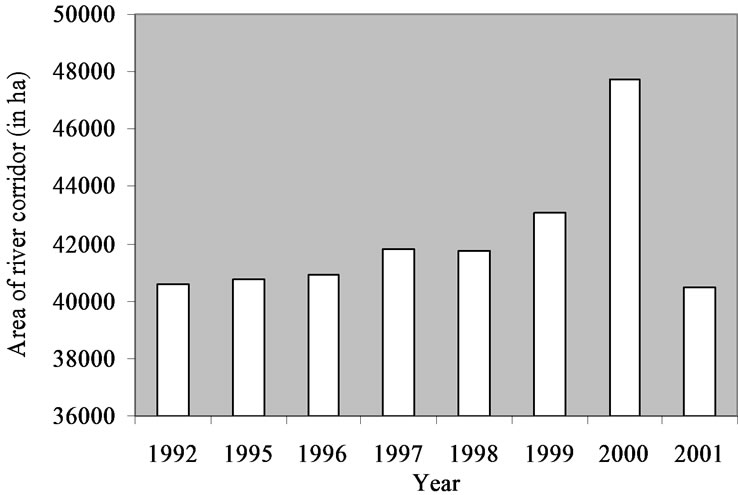
Figure 5. Changes of river corridor around the bridge site.
Though the extent of erosion may vary substantially from one year to another, the changes from 1992 to 1996 were very small and steady. Alternatively, the modifications after 1996 were extremely high, though the high value was observed in 2001. Due to artificial flow barrier (reduced bridge section), huge suspended sediments were deposited as bank-attached bars in front of the bridge site which extremely reduced the channel width in 2001. The limited responses along Sirajganj site were caused most likely due to construction of man-made hard points such as dykes, spur and groynes, and resisting clayey bank materials (about 7.0 m thick). Nevertheless, the total amount of active river bank corridor (in ha) gradually increased with time except the value in 2001. The maximum value (i.e., 4700 ha) was observed in 2000
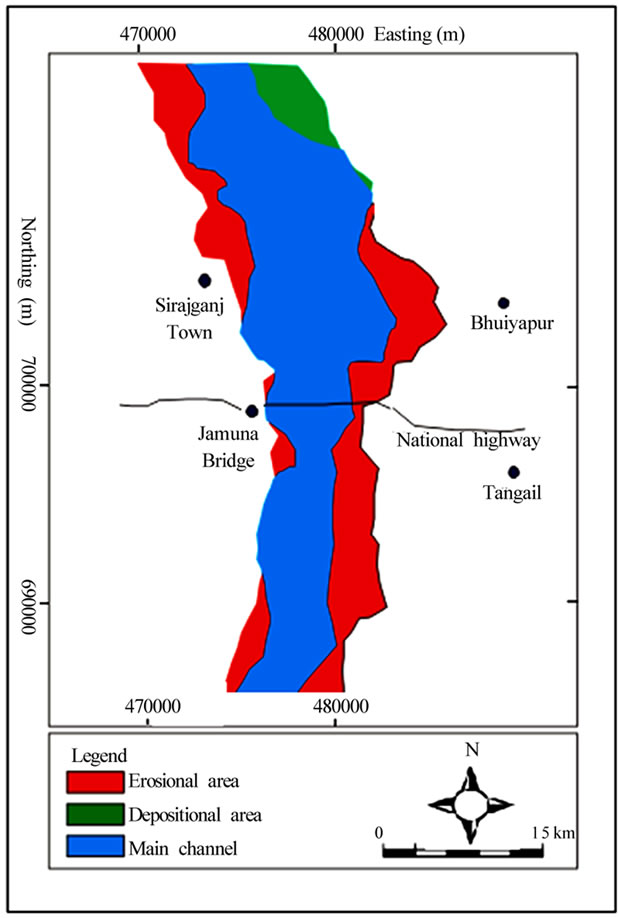
Figure 6. Total amount of erosion and depositional area from 1992 to 2008.
(Figure 5). The field observation along Sirajganj site shows that the existing bank line is now eroding the previous floodplain (Figure 6), which is mostly composed of silty clay to clayey materials (Figures 7 and 8).
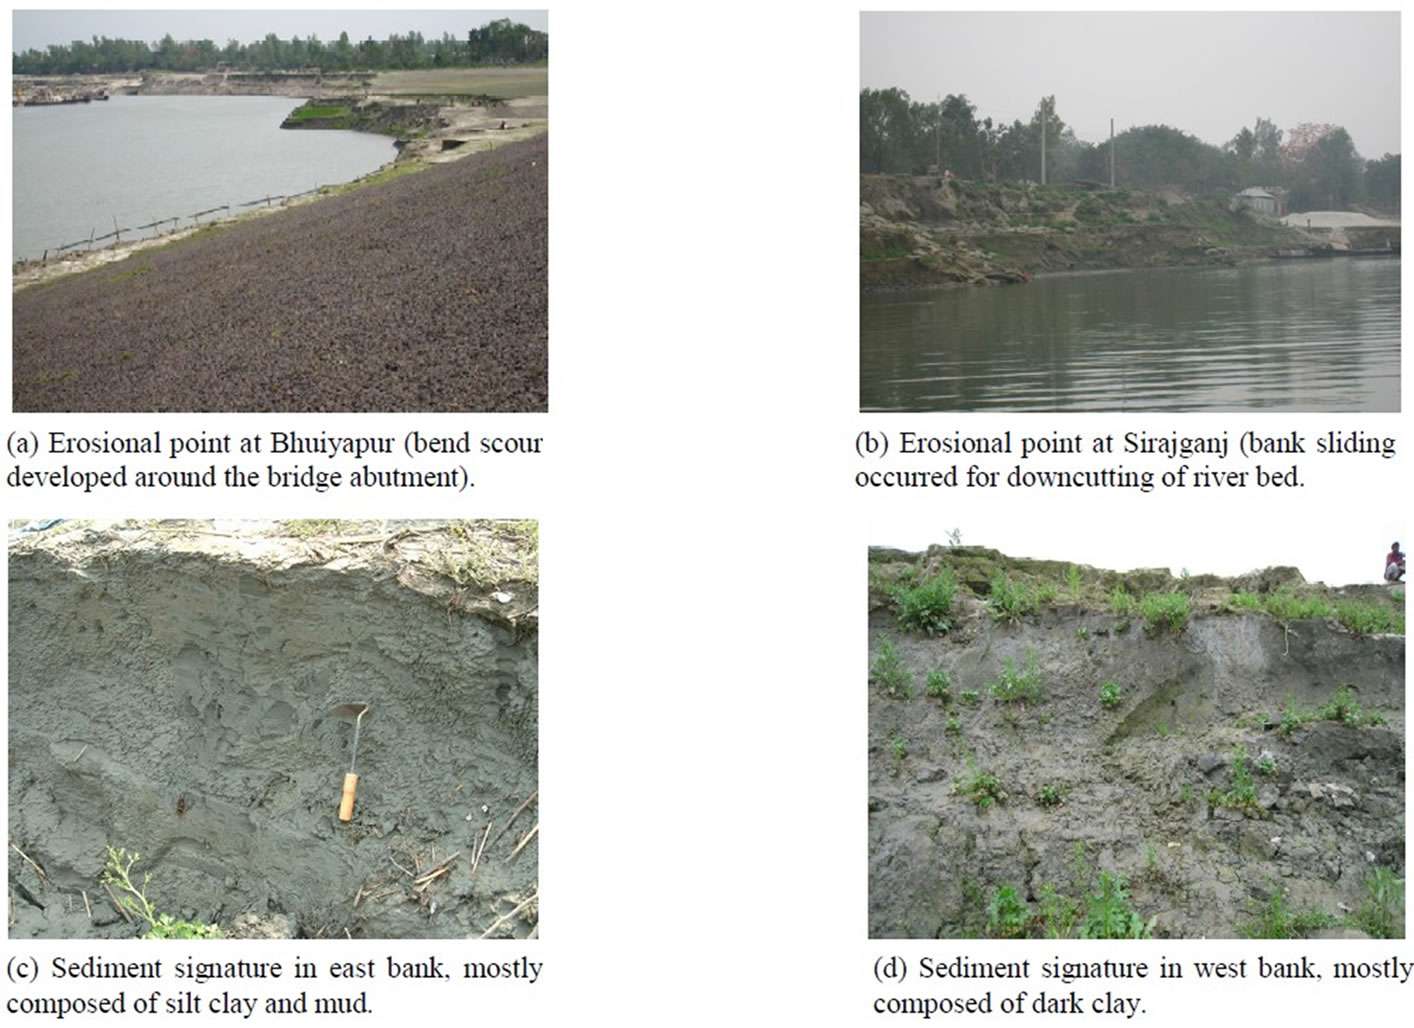
Figure 7. Erosional hazard and sediment characteristics of the bank materials.
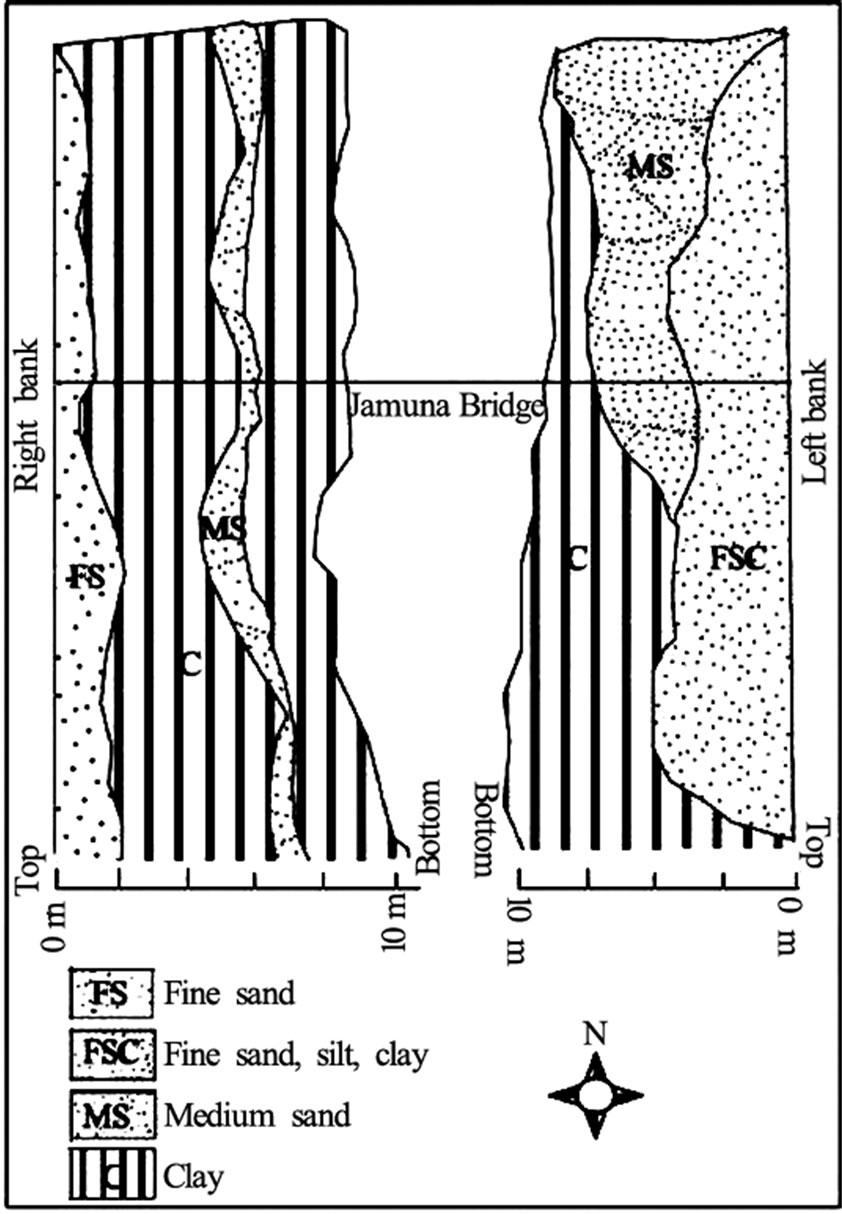
Figure 8. Sediment signature of the erosional bank of Jamuna River at Jamuna Bridge site.
Natural levee is almost absent in most of the meander bends along upstream site of Sirajganj town due to rapid erosion. In lieu of well-developed levee, there is a thick sheet of fine sand layer (around 2.0 m thick) which is underlain clayey materials (Figure 8). In contrast, channel bed scouring and concave benches are observed in the eroded bank morphology due to the presence of resisting (clayey) bank materials at bottom of eroded bank (4.0 m thick) (Figures 7(b) and 8). As a result of intensive downcutting, rapid river-bed degradation is induced, and the longitudinal training structures have gradually been destroyed. Therefore, none of the groynes constructed in one year in this channel has survived to next year. Groynes and many bank reinforcements are seriously damaged every year in this section. This aggradations and deposition phenomenon in the vector projection, show very similar fashion (Figures 2 and 4). Due to river training works, the present bridge section becomes a funnel-shape passage (sluice gate) across the river reach. Within this regulated section, it is hard to pass the entire flow regime during the flood season; accordingly, a flow gradient is developed between the upstream and downstream sites.
Consequently, the huge flow regime is restricted by the confined channel. Hence, deposition occurs at the immediate upstream of the bridge and raises the river bed level. Furthermore, the shallow channel can not accommodate the floodwater as before. Thus, the flood stage has become extremely high and the phenomenon known as the “little flood with high flooding disasters” has occurred in the river basin, thereby widening the channel corridor. The change of the channel area from 1992 to 2001 is plotted in Figure 5. Attributable to the existing pressure gradient between the upstream and downstream sites, the down-channel suffered excessive bank erosion (Tangail site) (Figures 3 and 7). The results show that the active channel corridor has been increasing with time. The maximum increment is observed in 2000, though the value is extremely reduced in 2001 (Figure 5). Due to excessive flooding in the upstream site, the agriculture land is covered by a thin sheet of fluvial sand (about 1.0 m thick) (Figure 8).
This causes reduction in soil fertility and hampers agriculture production, whose effects ultimately change the crop calendar in the surrounding floodplain. Meanwhile, it has been extensively agreed that particular river reaches are not self-governing but closely linked to each other and form a complex system that must be managed at the entire river scale [11,12]. From a practical standpoint, an alternative approach such as stream naturalization [13] may practice, which acknowledges that humans are now the dominant agents of stream-channel change and seeks to incorporate social and environmental components into this new regime of stream dynamics. These may prove to be more practicable than reflexive recovery for achieving explicit environmental objectives [14].
6. Conclusions
In this study, GIS analysis of remote sensing data has been revealed that the physical characteristics of the sandy braided Jamuna River at Jamuna Bridge section has been changed due to modification of the braided system by river training works between 1994 and 1995. The east guide bund (Bhuiyapur bridge-abutment) has been suffered by excessive erosion (315 m/year). Besides, the right bank (Sirajganj) is also threatened by lateral erosion (125 m/year). Given that, the active channel in bridge section is confined more than two-folds by river training works. It appears that the upstream section is continuously widening, which seems to act as a sluice gate. Therefore, the phenomena in this confined section disrupt the longitudinal continuity of the river system, and the idealized channel is divided into three successive zones: (1) erosion, (2) transport and (3) deposition zones, and this has been also described by Schumm [11] in regulated channel. Currently, the river reach attempts to restore an equilibrium profile which results in erosion as well as deposition upstream from the modified channel reach [15]. The main channel has become a mosaic of short channel reaches which behaved differently whether before regulation; the braided river in this section followed a natural evolutionary pattern. From the analyzed data it is also predicted that, in near future, the channel may bypass the east bridge abutment. For a better understanding of the functioning of entire channel system, it is necessary to prevent the consequences of channel training works and proper prediction of channel evolution.
7. Acknowledgements
This research article is a part of first author’s ongoing Ph.D. work, which is financed by the Japanese Government (Monbukagakusho Scholarship program 2007- 2010). Authors are indebted to Roksana Begum, Department of English, Jahangirnagar University, Dhaka, Bangladesh, for her efforts on language checking. Sincere gratitude to the anonymous reviewers whose constructive comments significantly improved the manuscript.
REFERENCES
- J. C. Stevaux, D. P. Martins and M. Meurer, “Changes in a large regulated tropical river: The Paraná River downstream from the Porto Primavera Dam, Brazil,” Geomorphology, Vol. 113, No. 3–4, pp. 230–238, December 2009.
- P. A. Gares, D. J. Sherman and K. F. Nordstrom, “Geomorphology and natural hazards,” Geomorphology, Vol. 10, pp.1–8, August 1994.
- O. Slaymaker, “Introduction,” In: Slaymaker, O. (Ed.), Geomorphic Hazards, Wiley, 1996.
- N. Chien, “Changes in river regime after the construction of upstream reservoirs,” Earth Surface Processes and Landforms, Vol. 10, No. 2, pp. 143–159, July 2006.
- S. E. E. Filho, P. C. Rocha, E. Comunello and J. C. Stevaux, “Effects of the Porto Primavera Dam on physical environment of the downstream floodplain,” In: S. M. Thomaz, A. A. Agostinho, N. S. Hahn, (Eds.), The Upper Paraná River and its Floodplain: Physical Aspects, Ecology and Conservation. Backhuys Publisher, Lieden, The Netherland, pp. 55–74, 2004.
- S. E. E. Filho and P. C. Rocha, “Erosão marginal e evolução hidrodinâmica no sistema rio-planície fluvial do alto Paraná, Centro-Sul, Brasil,” In: J. O. R. Nunes, P. C. Rocha, (Eds.), Geomorfologia. Expressão Popular, São Paulo, pp. 133–154. 2008.
- EGIS, “Morphological Dynamics of the Brahmaputra-Jamuna River,” Water Resources Planning Organisation (WARPO), Ministry of Water Resources, Government of Bangladesh, 1997.
- R. G. Congalton and K. Green, “Assessing the accuracy of remotely sensed data: Principles and practices,” Lewis Publishers, 1999.
- P. Mather, “Computer processing of remotely sensed images: An introduction, 3rd. (Ed.), Wiley, 2004.
- R. G. Congalton, “A review of assessing the accuracy of classifications of remotely sensed data,” Remote Sensing and Environment, Vol. 37, No. 1, pp. 35–46, July 1991.
- S. A. Schumm, “The Fluvial System,” Wiley, 1977.
- J. P. Bravard, N. Landon, J. L. Peiry and H. Piégay, “Principles of engineering geomorphology for managing channel erosion and bedload transport, examples from French rivers,” Geomorphology, Vol. 31, No. 1–4, pp. 291–311, December 1999.
- M. A. H. Bhuiyan and N. E. Huq, “Analysis of recent changes in physical characteristics of the Padma River between Aricha and Munshiganj: A remote sensing and GIS approach,” Bangladesh Journal of Geology, Vol. 19, pp. 13–23, March 2000.
- M. A. Urban and B. L. Rhoads, “Catastrophic humaninduced change in stream-channel planform and geometry in an agricultural watershed, Illinois, USA,” Annals of the Association of American Geographers, Vol. 93, No. 4, pp. 783–796, 2003.
- G. Parker and D. Andres, “Detrimental effects of river channelization,” In: Proceedings of Conference Rivers' 76, American Society of Civil Engineers, pp. 1248–1266, 1976.