Journal of Water Resource and Protection
Vol. 2 No. 1 (2010) , Article ID: 1186 , 13 pages DOI:10.4236/jwarp.2010.21004
Numerical Simulation of Pesticide Transport and Fate for Water Management in the Fucino Plain, Italy
1Dipartimento Scienze della Terra, Università “La Sapienza”, Roma, Italy
2Department of Land, Air and Water Resources and Department of Civil and Environmental Engineering,
University of California, Davis, CA, USA
E-mail: marco.petitta@uniroma1.it
Received September 23, 2009; revised October 23, 2009; accepted November 18, 2009
Keywords: Mathematical Models, Pesticides, Unsaturated Zone, Groundwater Pollution, Italy
ABSTRACT
A three-phase pesticide transport model is used to verify by numerical simulation, the influence of different parameters on infiltration through soil and/or surface runoff processes. Simulations are performed for a typical sandy loam potato field of Italy’s Fucino Plain, to explain the occurrence of measured concentrations of pesticides (mainly Linuron) in both surface waters and groundwater. Simulations take into account agricultural practices, climatic conditions, and soil characteristics. Results focus on the role of rainfall events and irrigation, of related infiltration amount and distribution, and of root zone thickness in influencing pesticide fate and its possible concentration increase through the years. Modeling results positively fit with the background knowledge of the Plain hydrology, showing the prevalence of surface transport and a scarce possibility for pesticides to reach groundwater in an average rainfall/irrigation scenario. Meanwhile, specific water management strategies are suggested to limit the occurrence of local groundwater pollution, related to high aquifer vulnerability zones, controlling inappropriate irrigation and pesticide application.
1. Introduction
Detection of pesticides and their breakdown products in surface water and in groundwater systems is needed due to their detrimental environmental impact. Pesticides can reach surface water by runoff or by infiltration and seepage into water courses. Infiltration of rainfall and irrigation waters can leach pesticides to the water table, causing contamination of aquifers. Prevalence of one of these processes mainly depends on the amount and distribution of recharge and on the hydraulic conductivity of the unsaturated zone.
The transport and fate of contaminants is a process that requires the knowledge of many parameters, such as soil physical, (bio)chemical and hydrogeological properties as well as climatic conditions and agricultural practices. The types of pesticide (herbicide, insecticide, fungicide) and crop also influence the process. Due to the high number of variables, a study of contamination by pesticides is not feasible by large-scale in situ experiments. A different approach is the study of entire catchment based on observation points [1–4], taking into account both hydrogeological context and hydrodynamics [5–7]. An easier way is represented by laboratory experiments [8–12], while a credible and diffused tool is the use of mathematical models to simulate the transport and fate process. Among the large number of transport models available [13–26], the integrated pesticide transport model (IPTM) developed by [27] is chosen for this study. Thus, this paper is an application of a well-tested and known pesticide transport model [27,28].
To compare simulation results with field data, use was made of field data collected from the agricultural area of the Fucino Plain, Central Italy, which has been studied in the last ten years from hydrological, hydrogeological, and agricultural points of view [29–32].
The Fucino Plain (200 km2 wide) was the largest lake in Central Italy (Figure 1), reclaimed in the 1800s for agricultural purposes. The fractured carbonate aquifers surrounding the Plain feed high-discharge springs and streambed springs, which ensure steady discharges even during the dry season [30]. The heterogeneous aquifer of the Plain, having a variable vertical permeability, is supplied by groundwater seepage and by direct infiltration from rainfall. The long-term water balance of the Plain has 700 mm/y of rainfall, 450 mm/y of evapotranspiration,

Figure 1. Hydrological setting of the Fucino Plain. Main network of artificial canals is shown by black thin lines. 1: Plain aquifer, corresponding to the agricultural area; 2: fan and detrital deposits connecting carbonate aquifers to the Plain aquifer; 3: ancient alluvial deposits (aquitard); 4: terrigenous deposits (regional aquiclude); 5: carbonate aquifers (recharge area of springs); 6: climatic stations; 7: main springs; 8: main streambed springs; 9: public irrigation wells; 10: drinking water wells; 11: main directions of groundwater flow.
and consequently 250 mm/y of water excess in the October-March period [30]. As a consequence, crop irrigation was based on a sustainable use of surface water and, increasingly, groundwater through the 1980s. However, during the past 15 years, due to the concurrence of a natural decrease in spring discharge and the increase of pumping and water requirements for irrigation, a significant water shortage in the summer has been observed. Ignoring signs of water and environmental imbalance of the water-man-agriculture system, historical farm crops, mostly wheat, potato and sugar beet, were progressively and rapidly replaced by water-intensive horticultural crops [30]. This transition to an intensive agriculture has been accompanied by high water demand and by wide use of pesticides. In addition, the decreasing discharge in the canals nullifies the effect of dilution of the pollutants entering surface waters, mainly residues of fertilizers [32] and pesticides. In this framework, surveys conducted on both surface water and groundwater have shown the presence of pesticides, mainly Linuron, Dichloran, and Carbaryl, with concentrations ranging from 0.02 to 2.8 g/L in surface water and from 0.03 to 0.5 g/L in groundwater [33]. Those concentrations are frequently higher than threshold values (0.1 g/L in groundwater and surface water for human use) allowed by Italian laws and European Union Directives [34–36].
There is a need to clarify how surface runoff and/or infiltration processes allow pesticides to reach canals and/or groundwater. Because of focus on pesticide occurrence in surface waters and groundwater, gaseous and adsorbed components of pesticide fate are not studied in detail. The IPTM-CS model [28,37] takes into account those components as functions of parameters that have been considered constant during these simulations (e.g., organic matter content for the adsorbed component). Contribution of pesticides on volatilization, adsorption, and decay has been considered as losses for water systems.
The aim of this study is to verify by numerical simulation modeling how various parameters (agricultural practices, climatic conditions, soil and vadose zone hydraulic conductivity) can affect surface runoff and infiltration, influencing pesticide transport in soil and unsaturated zone and its fate in surface water and groundwater. Identification of the role of different parameters and evaluation of their influence on the numerical simulation results represent the methodological goal of the study. In addition, the achievement of this goal is important for water management, making possible recommendations for integrated water-pesticide-crop management in the study area.
2. Materials and Methods
Derived from the physically-based analytical model of Hantush and Mariño [38], the adopted mathematical model, with a new Windows-based interface (IPTM-CS), is a hybrid time-continuous and space-discrete semidiscrete model, which takes advantage of both analytical and numerical methods [27,37]. The model is able to deal with physical and biochemical processes related to one-dimensional vertical water flow and three-phase pesticide transport (dissolved, volatilized, adsorbed) in the vadose zone (separated in a root zone and in a deep vadose zone), where complete mixing is assumed. The adoption of a semidiscrete solution allows the simulation for variably-saturated porous media with timeand space-variant parameters under conditions of heterogeneous media, unsteady flow fields, and space-time-dependent physical and biochemical processes concerning pesticide environmental fate. A complete description of the structure of the model and various solution methods are contained in [27,37]. The model has been used in previous studies with consistent results [27,39].
The model is able to simulate pesticide transport both in plant canopy and vadose zone systems, considering different methods of irrigation (overand under-canopy), surface runoff, and possibly of erosion. A one-dimensional, physically-based, compartmental model is used for simulating water flow along the soil profile, divided into surface zone, plant root zone and deep vadose zone, as schematically shown in Figure 2. The new Windowsbased interface of the IPTM-CS model [27] allows easier input and data processing. The large number of tables and figures included provides specific values/ranges of the different input parameters; the reference data are adopted for lacking data or for matching with fieldmeasured data.
In this study, several simulations on representative soil columns were conducted for different situations, starting from real data. First of all, the soil profile was discretized as follows: a) the surface layer was represented by one cell, with an assumed thickness of 0.005 m; b) the root zone was divided in 10 cells of equal thickness, considering a total thickness ranging from 30 to 70 cm for different root zones; as a result, each cell is 1/10 of the assumed total thickness (corresponding to 3 cm for cell when the total thickness is 30 cm, 4 cm for cell in a root zone of 40 cm, etc.); and c) the vadose zone was divided in 10 cells of 20 cm thickness each, for a total of 2 m.
This scheme allowed simulation of different thicknesses of the root zone (from 30 to 70 cm, as field data show), fixing the same structure of the model (10 cells for the root zone), simplifying data input and output. The vadose zone was chosen to have initially a thickness of 2 m, which can be modified taking into account a water table depth ranging from 0.5 to 2.5 m below ground surface. Considering the value which corresponds to the water table depth in the simulated vadose zone, the evaluation of concentration at every possible water table depth can be obtained within the same simulation.
The studied area is 10000 m2, which corresponds to an agricultural unit in the Fucino Plain; the watershed area is about 131 km2, including the entire ancient lake area. The time step adopted was one day for one entire year. Spatial discretization has been assumed appropriate with respect to the time step, considering that the IPTM-CS model does not take into account the process of molecular diffusion and thus evaluation of Peclet number is not necessary. Otherwise, the mechanical dispersion is considered in the simulation.
All performed simulations started on April 1, when agricultural practices including pesticide application at the start of the cropping season occurred. Daily data required for simulation referred to 1989-2004, for the Fucino Ottomila station, located at the center of the Fucino Plain. By taking into account similar trends observed on monthly long-term data (1921-2004), the 1990-93 threeyear sequence, representative of different climate regimen, was used in all simulations. In fact, rainfall in season 1990-91 was higher than the average (+29%), season 1991-92 can represent the average (-2%), and season 1992-93 the low estimate of rainfall (-33%). Temperature daily data were used to calculate daily potential evapotranspiration, using the method proposed by [40].
Simulations were conducted on potato, which is the most common crop in the Plain, representing 23% of the agricultural surface in the last 15 years. Parameter ranges related to potato crops, obtained by databases and tables included in the IPTM-CS program [41–44] are shown in Table 1. Other crops, less represented in the Plain, were not considered in this paper. The crop cycle of potatoes in the Plain helped to determine the values of related parameters. In detail, because potato is cultivated from May to August, both crop coefficient and canopy interception are relevant in this period, while the plant leaf
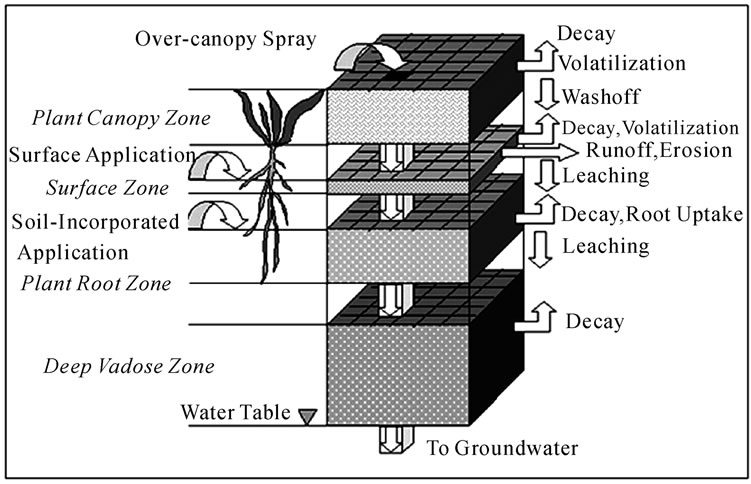
Figure 2. Scheme of the IPTM-CS model, showing processes taken into account by the model (after Chu and Mariño, 2004).
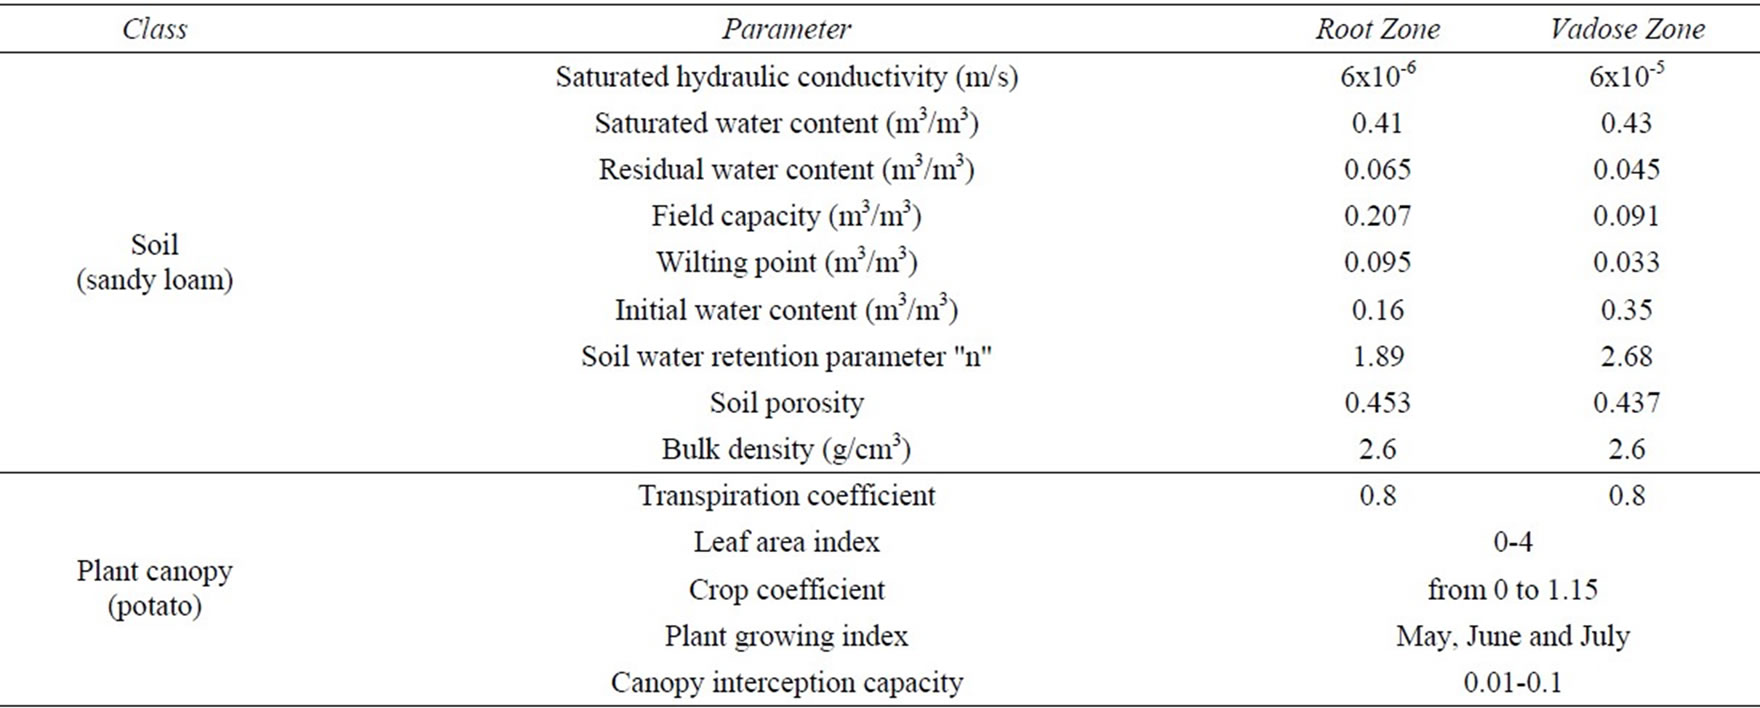
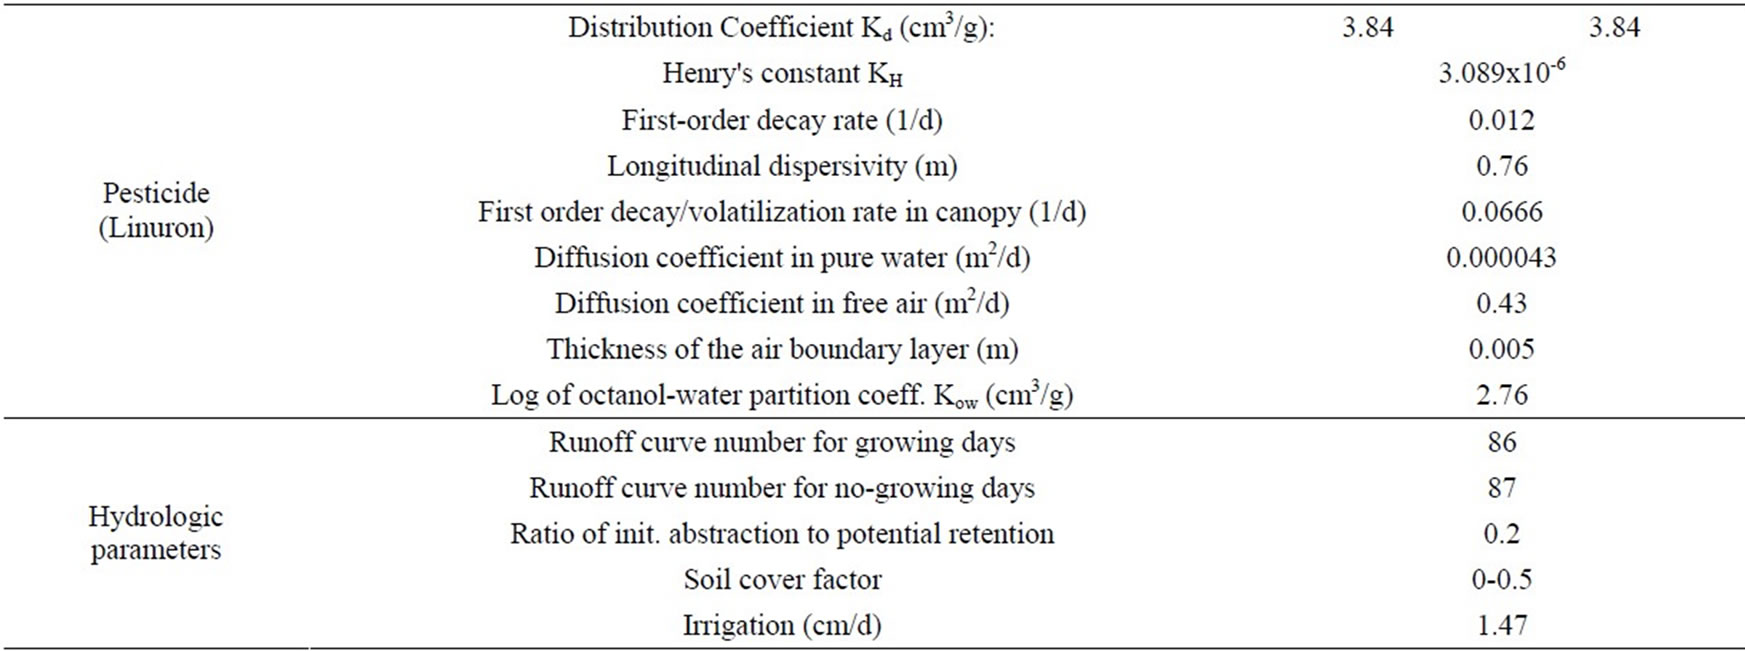
Table 1. Parameters used for sandy loam potato crop and Linuron pesticide.
area index is active during plant growth (May, June and July).
Characteristics of soils were determined by sampling of root zone soil and further laboratory analyses. The three more representative soils are sandy loam, clay loam, and silty-clay loam by the ASTM classification [45]. The granulometry, the initial water content and the bulk density were laboratory-determined, whereas the saturated hydraulic conductivity was calculated by constant-head, field permeameter tests. From the analysis of soil sections, it was evident that under the root zone there is a more permeable vadose zone, characterized in the sandy loam root zone by the presence of gravels and by a low percentage of silt. Direct surveys did not show fractures or preferential flowpaths in the root zone. This could have resulted in a lower hydraulic conductivity for the root zone (e.g., for sandy loam 6 x 10⁻⁶ m/s) and a higher one for the vadose zone (up to 6 x 10⁻⁴ m/s). The vertical distribution of the saturated hydraulic conductivity, from the root zone to the lower limit of the vadose zone, matched the average value obtained by in-situ permeameter tests for the entire soil thickness (2 x 10⁻⁴ m/s). Different values were also used for other soil parameters, resulting in different characteristics for the root zone and the deep vadose zone in these simulations. Figures and tables included by the IPTM-CS program provided values for parameters which have been not measured and provide methods for the determining these parameters [23,46,47]. The soil parameterization was based on Van Genuchten’s relationships [48]. Soil parameters adopted for simulation in a sandy loam soil are shown in Table 1.
Pesticide parameters for Linuron, Dichloran, and Carbaryl were obtained from public and web databases [49] and tables attached to the IPTM-CS program [14,50,51]. Linuron is a preand post-emergence herbicide used to control annual and perennial broadleaf and grassy weeds on both crop and non-crop sites; it is used frequently for potatoes and carrots. Dichloran is a fungicide widely used for the pre-harvest treatment of several fruit and vegetables crops, including potatoes. Carbaryl is a commonly used wide-spectrum carbamate insecticide of large use, which controls over 100 species of insects on several fruits and vegetables [49].
Table 1 shows values of parameters used for Linuron’s simulation. Use was made of results of previous surveys as targets for the simulated concentrations. In other words, measured pesticide concentrations in 2004 and 2006 in surface water and groundwater were used to determine if the simulated concentrations in soil and in groundwater give similar values. Data of pesticide concentrations obtained by HPLC analysis [33] showed absence of pesticides in detectable amounts in waters during winter (December 2003) and spring (early April 2004). This is in agreement with the agricultural schedule in which the first application of pesticides occurs approximately in mid-April. In summer 2004, Linuron was found in 30 of 35 samples, Dichloran in 6 of 35, and only one case of Carbaryl presence; in Fall 2004, Linuron was detected only in 7 of 35 samples, while Dichloran was largely present in 12 of 35 samples, and Carbaryl was measured in 4 samples [52]. At the end of April 2006, a new survey was conducted in 20 sites selected from the previous 35 sites, where higher concentrations were found in 2004. Linuron was found in 17 of 20 water samples and Dichloran in 7 of 20. Concentrations ranged from 0.03 g/L to 2.8 g/L, with relative abundance in surface waters and lower concentration in groundwater (between 0.03 and 0.5 g/L). June and September 2006 surveys confirmed previous results, having 100% of Linuron occurrence in June (average: 1.72 g/L), while in September less than half off samples have Linuron, with a lower average of 0.1 g/L. Dichloran was found in only one sample in June, having major occurrence in September 2006. In groundwater, mainly Linuron has been found, having the occurrence of 80% in June 2004 and 2006. Occasionally, Dichloran was found in traces (< 0.1 g/L). Samples without trace of Linuron corresponded to groundwater related to deep circulation (deep wells), while in shallow groundwater (shallow wells and springs) Linuron normally was detected, in September 2006 too. Table 2 gives concentration values measured in 2004-06 surveys for pesticides in surface waters and groundwater.
Given that the watershed under consideration is flat, simulations did not take erosion into account. Curve numbers, potential retention, and soil cover factor were evaluated by tables attached to the IPTM-CS program for potato crops and above-mentioned soils [53].
Irrigation practice information was obtained directly by farmers’ interviews and by the agricultural schedule of the Plain. For potato, under-canopy irrigation was performed four times between June and July with an interval of 10 days. The irrigation rate was 0.367 cm/hour, with each irrigation occurring for 4 hours resulting in an application of 1.47 cm.
Finally, pesticide applications, determined by the previously mentioned farmer interviews and by the total amount of pesticides sold in the studied area, were considered as follows: for Linuron, one application at the beginning of April with a rate of 0.117 g/m2; for Dichloran, two applications every 10 days after June 1, with a rate of 0.1 g/m2; and for Carbaryl, three applications every 10 days starting from June 20, with an increasing rate ranging from 0.05 to 0.07 g/cm2. The pesticide application was considered instantaneous and under-canopy because it was spread mainly in non-growing periods. The initial pesticide concentration entered in the simulation files was zero for the first year; for the following years, the value of initial concentration corresponded to the amount obtained by simulation in the last day of the previous year, to consider possible accumulation processes into the soil.
3. Results
Main parameters influencing dissolved pesticide fate and its concentration in waters have been identified as pesticide characteristics, including amount, rate, and single properties of each compound used, recharge (amount and distribution, due to both rainfall and irrigation practice), and physical soil characteristics (e.g. size, saturated hy-
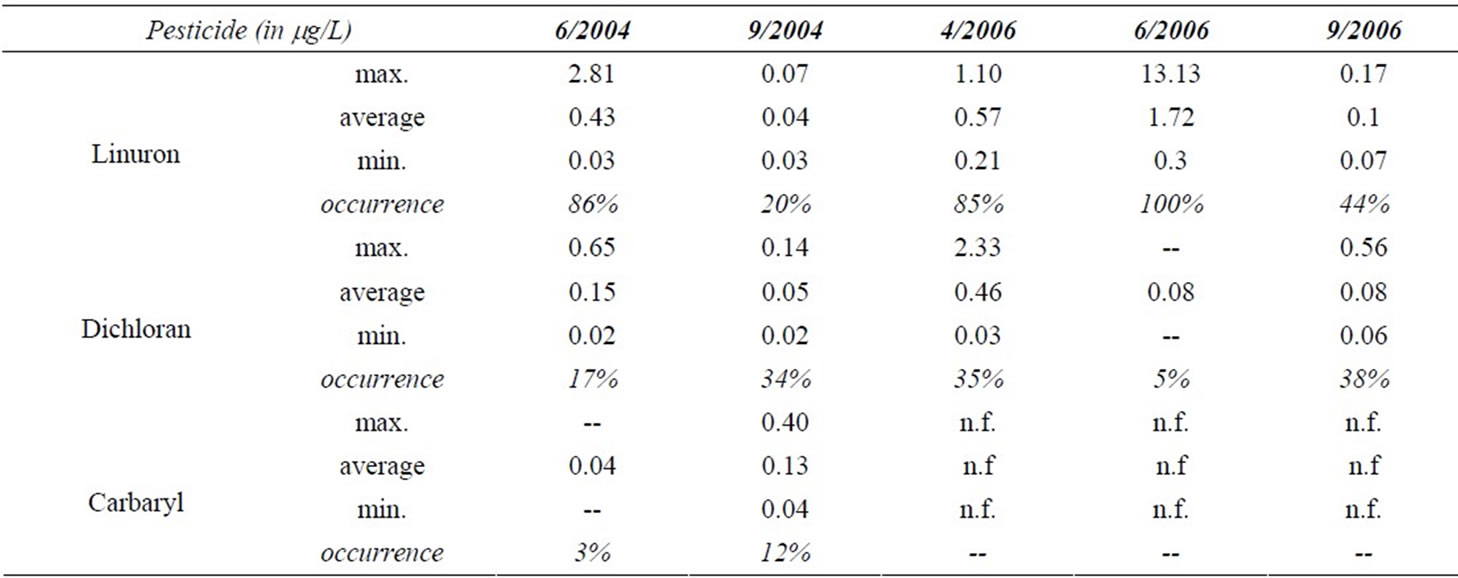
Table 2. Measured pesticide concentrations in water samples (35 samples in 2004; 20 samples in 2006; n.f.= not found).
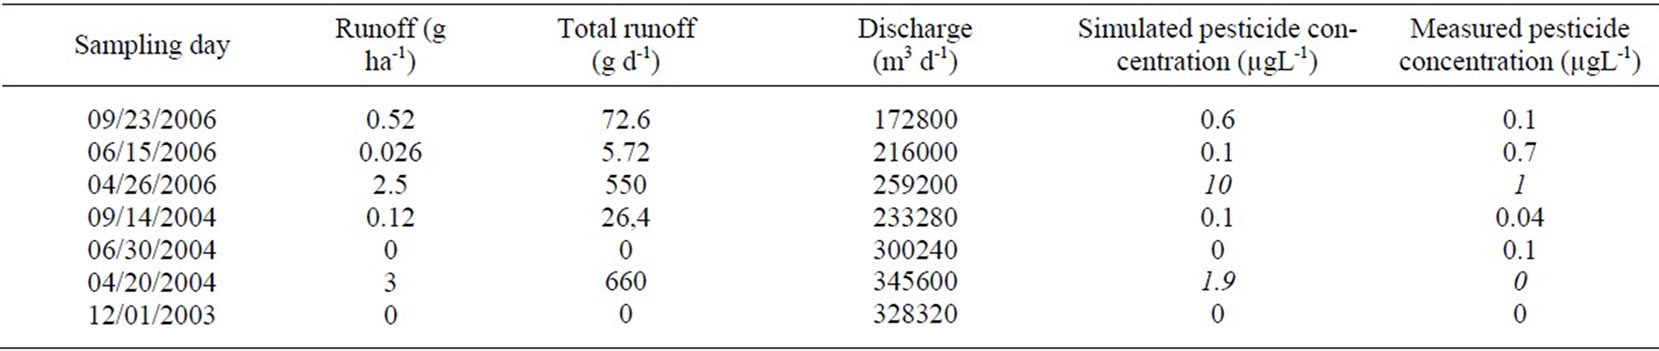
Table 3. Comparison between simulated and measured Linuron concentrations in surface waters. Simulated values have been obtained considering the average runoff in 15 days (one week before and one week after sampling) (modified from Pacioni et al., 2007). Data in italics highlight periods showing significant discrepancies (April samplings).
draulic conductivity, thickness of root and vadose zones).
To calibrate and validate the model, preliminary simulations of Linuron contribution to the runoff were compared with its pesticide concentrations found in surface waters during all 2004 and 2006 surveys (Table 3). Limited occurrence of pesticide in groundwater did not allow a similar comparison for groundwater. Contaminant dilution in the canal discharge, variability of the applied pesticide amount, and interference of more than one rainfall event have been considered [54]. To take into account possible shifts in the real pesticide application by farmers and the time transit of runoff waters into the Plain, an average of 15 days of the pesticide runoff obtained by simulation has been adopted, considering 7 days before and after sampling. Pesticide amount really used by farmers can not be exactly evaluated in detail for each agricultural unit. These uncertainties certainly affect the comparison between real and simulated concentration, but at the entire basin scale (130 km2) application and runoff processes can be compared, looking for the presence of pesticides in surface waters in a week after the presumed date of pesticide application. Results of this comparison were oriented to highlight the role of runoff, while the specific aim of the research was to simulate pesticide fate in soil and groundwater.
Simulation results showed a significant agreement between simulated pesticide concentration due to runoff and measured concentration found in surface waters. Taking into account the difficulty to verify days and amount of pesticide application, which can locally change with respect to the assumed standard, simulation results were relatively consistent with the monitored ones. Exceptions were noted in April surveys, when the local effect of pesticide application can highly affect pesticide content in surface waters, causing outlier peaks in monitored surface waters (Table 3). Discrepancies between simulated and real runoff data did not affect the reliability of simulations of infiltration to groundwater, as confirmed by specific column experiments [55-56].
The model calibration using runoff data can be accepted for further simulations, taking into account the aim of this research which is to provide a preliminary evaluation of groundwater vulnerability to pollution by pesticide at the basin scale. Considering the adopted methodology as suitable for the study area, several simulations were conducted to determine the effects of hydrological processes on pesticide fate. Firstly, simulations using three different soils (sandy loam, silty-clay loam, and clay loam) and for three detected pesticides were performed, to identify situations that can favor groundwater pollution. In soils with low hydraulic conductivity, like silty-clay and clay loams, pesticides reached the vadose zone only in undetectable concentrations, lower than 0.001 g/L at 0.5 m below ground surface. In contrast, results for pesticide applications in different soils indicated that the runoff process is relevant during irrigation practice and natural decay is largely prevalent for pesticides having low persistence such as Dichloran and Carbaryl (half-life of few days for horticultural crops). For both of those pesticides, simulated concentrations at the base of the root zone were of the same order of magnitude (less than 0.001 g/L at 0.5 m below ground surface) and several orders of magnitude smaller at lower depths. Conversely, application of Linuron, which showed longer persistence in the system, caused highest concentration values in soil pore water. Simulation results (Figure 3) showed the variation of pesticide content with depth in the unsaturated zone. In
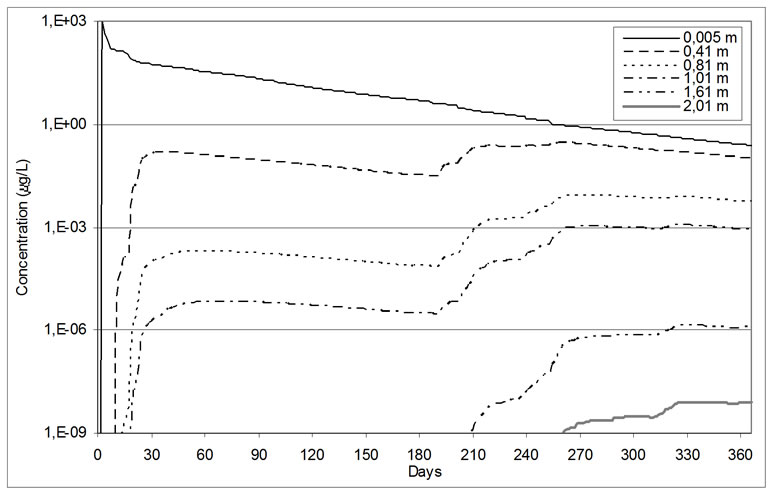
Figure 3. Effect of depth on dissolved Linuron concentration with time in a sandy loam soil (year 1990-91). The concentrations shown are those at various depths below ground for a root zone thickness of 30 cm. Simulation period starts on April 1.
the case of high groundwater vulnerability, as for a thin root zone (30 cm) in a sandy loam soil, dissolved Linuron reached 0.1 g/L at 0.5 m below ground and about 0.01 g/L at 1 m below ground (days 260-365 in Figure 3).
Considering this vulnerable scenario, additional simulations were performed using different values and distribution of the abovementioned parameters, starting from a standard scheme that simulates on a potato field the fate of Linuron, the largest occurring pesticide, in a sandy loam soil with 70 cm of root zone and 200 cm of vadose zone.
To evaluate the influence of recharge, different distributions of effective rainfall (rainfall minus evapotranspiration) and irrigation were considered. When it rains in the days following the pesticide application on the ground surface, runoff can easily remove pesticide from the surface and transport it in surface waters. Simulations were conducted assuming non-rainy periods in the following 7, 15, and 30 days since the application of the pesticide (Figure 4). Results indicated that if there is no rainfall after pesticide application, no substantial changes occur in the pesticide concentration in the soil pore water, throughout the year. In fact, the pesticide concentration trend significantly changed only in the spring and summer (days 30-180 in Figure 4), when lower concentration values were registered in case of scarce rainfall. Similar results were obtained considering different years and pesticides. However, this situation which is typical of dry seasons is usually compensated by a major amount of irrigation.
Figure 5 shows a different trend in pesticide concentration obtained from application of higher irrigation amounts. Using as input a double irrigation time, the mobilization of the pesticide into the soil pore water occurred before the autumn infiltration recharge (day 200 in Figure 5), starting in the summer (day 130 in Figure 5).
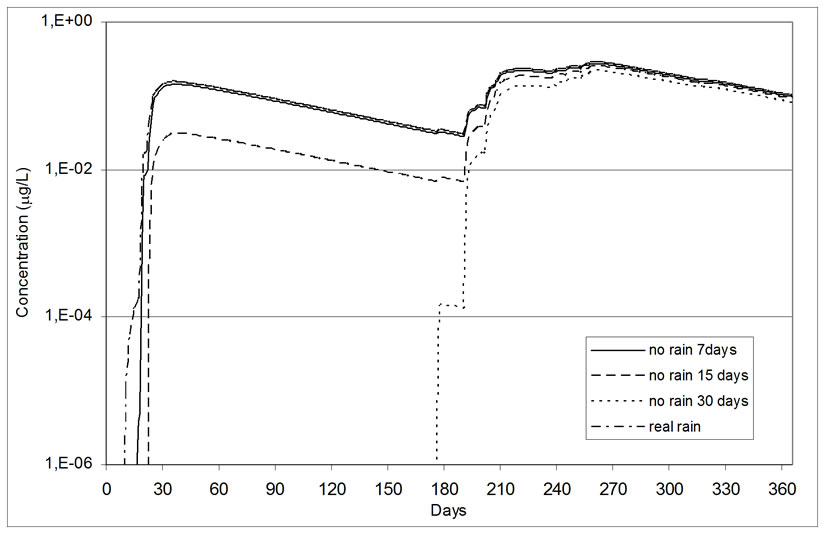
Figure 4. Effects of no-rainy periods following the application (7, 15, and 30 days of no rain) on dissolved Linuron concentration with time in a sandy loam soil (year 1990-91). The concentrations shown are those at the top of the vadose zone (10 cm below a root zone thickness of 30 cm) hence different no-rainy periods. Simulation period starts on April 1.
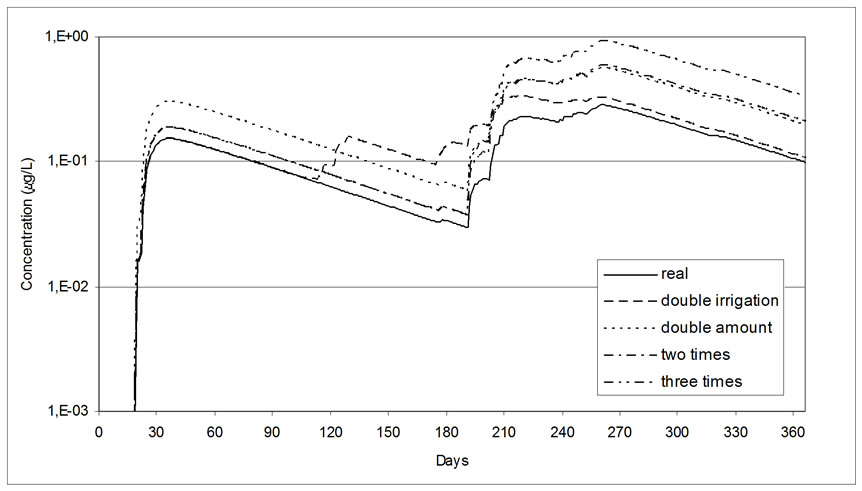
Figure 5. Effects of different irrigation practices on dissolved Linuron concentration with time in a sandy loam soil (year 1990-91). Double irrigation refers to a double irrigation rate (intensity of irrigation); double pesticide amount refers to a double mass of pesticide use during standard irrigation times; two-times and three-times refer to 8-hours and 12-hours of irrigation instead of 4 hours as standard. The concentrations shown are those at the top of the vadose zone (10 cm below a root zone thickness of 30 cm). Simulation period starts on April 1.
Modification in irrigation amount and time increased the pesticide concentration during the summer, according with the registered Linuron occurrence in groundwater.
By modifying the modality and quantity of pesticide application, significant changes occurred in the simulation results (Figure 5). Pesticide in the soil pore water showed the same trend in spring and summer, except for the concentration that is higher if a double amount of pesticide is used. Major changes were observed during autumn (days 190-220 in Figure 5), when the infiltration process begins: the larger the amount of pesticide used, the higher the pesticide concentration in the soil pore water, for doubling the pesticide for one, two, or three application times.
Several simulations indicated that infiltration from rainfall has a major influence on pesticide concentration through and at the end of the year. Because infiltration highly depends on effective rainfall, it is interesting to verify influences of real rainfall data for more than one year. The selected seasons 1990-91, 1991-92 and 1992- 93, were simulated for different root zone thicknesses of 30, 40, and 70 cm. Effective precipitation and pesticide runoff are shown in Figure 6. Spring and summer rainfall mobilized large amounts of pesticide remaining on the surface after application. Conversely, higher autumn rainfalls were not able to start a substantial Linuron runoff, because it is not largely present on the surface.
Simulation results of soil pore water for the abovementioned three years of rainfall, at a depth of 41 cm below ground surface, below a root zone of 30 cm, are shown in Figure 7. First season with higher rainfall indicated a Linuron concentration above 0.1 g/L since autumn (day 200 in Figure 7). However, during the following

Figure 6. Daily effective rainfall and simulated Linuron runoff from April 1990 to March 1993.
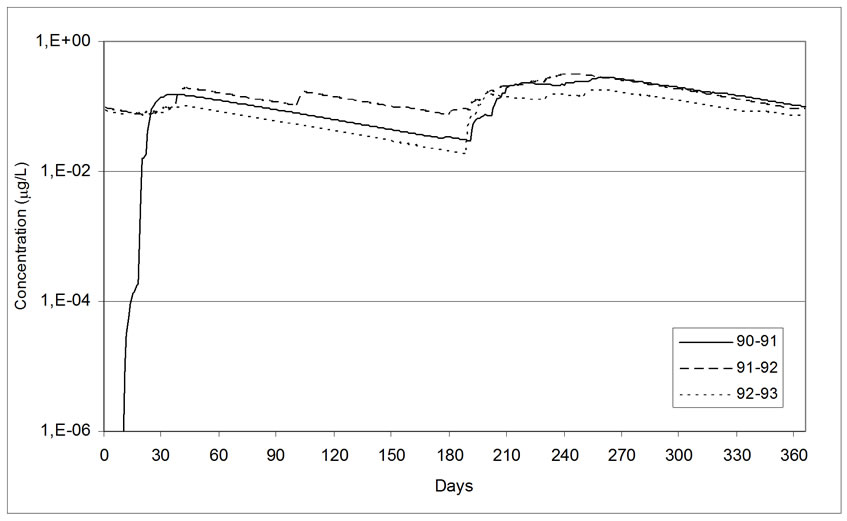
Figure 7. Effects of different rainfall years (1990-91, 1991-92 and 1992-93) on dissolved Linuron concentration with time in a sandy loam soil. The concentrations shown are those at the top of the vadose zone (10 cm below a root zone thickness of 30 cm). Simulation period starts on April 1.
season, considering the same initial pesticide application, higher concentration values were noted, not influenced by the lower total rainfall of this year. Meanwhile, secondary but significant peaks were present (days 45 and 110 in Figure 7), due to high rainfall events (Figure 6). These results indicated that rainfall distribution and events affect pesticide concentration more than the total amount of rainfall. As shown for the least rainy third year, concentration values were in general lower, while the maximum value was reached in winter (day 240 in Figure 7), correlated to the rainfall observed at the end of December 2002 (Figure 6).
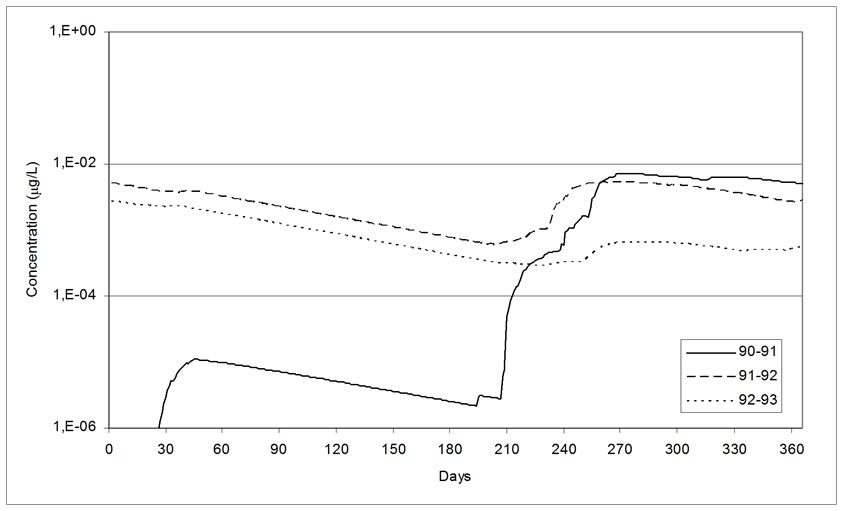
Figure 8. Effects of different rainfall years (1990-91, 1991-92 and 1992-93) on dissolved Linuron concentration with time in a sandy loam soil. The concentrations shown are those at the top of the vadose zone (10 cm below a root zone thickness of 70 cm). Simulation period starts on April 1.
The influence of singular rainfall events was less evident for soils having thicker root zones. Considering a 70 cm root zone (Figure 8), there were no influences of summer rainfall (as in July 1991) and the autumn peaks were less evident (day 230 in Figure 8), remaining under the limit of 0.01 g/L. During the least rainy third year, a decrease in pesticide concentration was observed at the end of the simulation (days 330-365 in Figure 8). In fact, autumn infiltration was negligible and the pesticide can not reach the vadose zone under 70 cm of root zone.
A sensitivity analysis of the results was conducted by taking into account these preliminary results, to understand the influence of several parameters known with some uncertainty, which can locally change in the Plain, such as hydraulic conductivity and root thickness. Simulations were conducted by varying root zone thickness from 30 to 70 cm, and using different hydraulic conductivity values for root zone and vadose zone (ranging from 6 x 10⁻⁴ to 6 x 10⁻⁶ m/s). For root zone thickness of 30, 40, and 70 cm, simulations were performed for the selected three years (1990-93) to verify the possible increase of pesticide amount in soil pore water as a function of time.
The process of migration of the pesticide through the soil was scarcely affected by soil saturated hydraulic conductivity (K), as it was shown by simulations performed changing the K value of both root and vadose zones (Figure 9), with the aim to replicate different field situations. Results using K values ranging from 6 x 10⁻⁴ to 6 x 10⁻⁶ m/s, in different combinations for root and vadose zones, indicated that pesticide concentration remains low, depending on the specific K value used. Different results are observed by adopting a higher K for the root zone (10-4 m/s); in this case, the fast flow through the root zone allowed the pesticide to arrive at the vadose zone in high concentration. This situation, however, did not occur in the studied area, where the root zone was represented by a low K layer (< 10-5 m/s).
Simulation results showed that root zone thickness influences time travel of pesticide after application (Figure 10), from 1-2 weeks for a thin root zone to 3-4 weeks for a thick root zone. When pesticide arrived at a fixed depth, there was a constant decrease in concentration with time. Only in October (days 190-210 in Figure 10), when effective rainfall occurs, the pesticide concentration increased, reaching maximum values in approximately 30 days. This pattern was observed at every depth for every
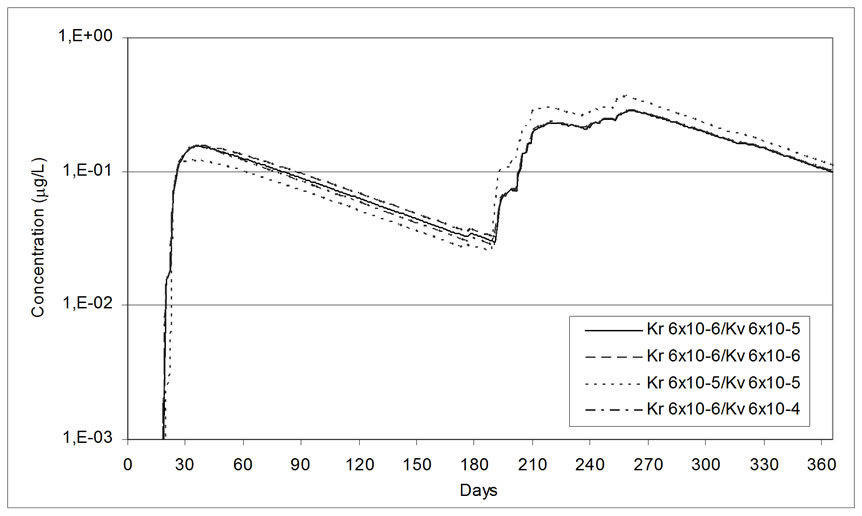
Figure 9. Effects of saturated hydraulic conductivity, for root (Kr) and vadose (Kv) zones, on dissolved Linuron concentration with time in a sandy loam soil (year 1990-91). The concentrations shown are those at the top of the vadose zone (10 cm below a root zone thickness of 30 cm) hence different saturated hydraulic conductivities values (in m/s). Simulation period starts on April 1.
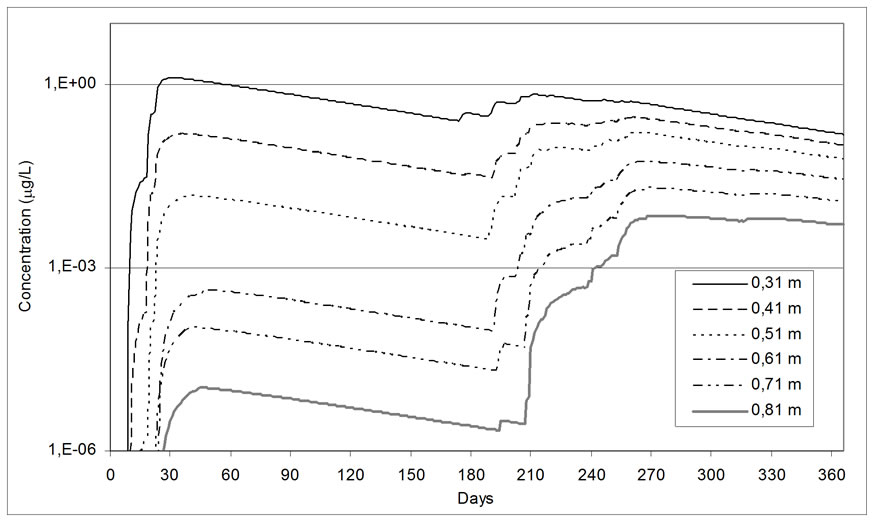
Figure 10. Effects of root zone thicknesses (from 20 to 70 cm) on dissolved Linuron concentration with time in a sandy loam soil (year 1990-91). The concentrations shown are those at the top of the vadose zone (10 cm below the root zone thickness) hence different root zone thicknesses. Simulation period starts on April 1.
root zone thickness. Highest autumn concentrations, ranging from 0.5 to 0.01 g/L at the base of the root zone, decreased slightly for the rest of the year, approximately one order of magnitude less than maximum values (day 365 in Figure 10).
4. Discussion
Simulated effects of different parameters on pesticide transport and fate agreed with observed data, confirming that the adopted methodology is representative for the study area. Type of pesticide was the first factor influencing the fate of the pesticide in the unsaturated zone. The negligible exposure levels obtained in the vadose zone for Dichloran and Carbaryl were consistent with their presence in surface waters during summer and autumn. Simulations suggested that runoff was responsible of their transport in surface water, by irrigation in summer and by rainfall in autumn. Those pesticides quickly decayed in the root zone and when infiltration occurred in the autumn, they showed a peak in concentration, followed by a marked decrease for the natural decay. Exposure levels of the above-mentioned pesticides were very low in soil pore water (< 0.001 mg/L) and there was scant chance to reach the water table. This hypothesis is enforced by the low hydraulic conductivity of silt and clay soils, in which infiltration is at a low rate; consequently, movement of water and pesticide through the vadose zone is slow.
Simulation results indicated that Linuron could reach the water in the vadose zone and the water table in concentrations near to and over the Italian law limits, as registered during surveys. Higher persistence makes this pesticide sensitive to the infiltration process in the autumn (days 190-200 in Figure 3), showing the highest concentration irrespective of the root zone thickness, followed by steady values for the rest of the year. As a consequence, in the following year the initial concentration in the soil pore water was significant, possibly higher than in previous periods. Its increase over time in groundwater occurred only after high infiltration years and in soils with limited thickness of the root zone (Table 4).
Hydraulic conductivity of the vadose zone and water table depth determine the groundwater vulnerability and consequently the possibility of contamination by pesticides. Soil hydraulic conductivity, both for root and vadose zones, scarcely affected pesticide concentration, in a range of two orders of magnitude (10-4-10-6 m/s), which corresponded to the field range of saturated hydraulic conductivity of the soils. Where the water table is located no more than 1 m below ground surface, simulations showed pesticide concentrations coincident with the measured ones. This means that only shallow groundwater can be contaminated by Linuron for the considered physical, chemical, and climatic conditions. Detectable concentrations are obtained only in vadose zones of high hydraulic conductivity (e.g. sandy-loam soil) (Figure 3), confirming the possibility of groundwater contamination by this pesticide.
Rainfall amount, but especially rainfall distribution and single events, largely affected the infiltration and runoff processes and, consequently, the fate of pesticides. Simulations of three real rainfall seasons (1990-93) suggested that high spring and summer rainfall can mobilize pesticide to surface waters. Autumn rainfall infiltrates, causing pesticide mobilization and concentration peaks in the vadose zone and in groundwater. Single events and high irrigation rate can have the same effect in summer, especially in soils with thin root zones. Increase of pesticide amount in soil pore water through the years is possible, but not common, following high rainfall years.
Root zone thickness influenced pesticide concentration in the soil pore water. Thin root zones favored short transit time and high concentration during spring, but they have limited influence on autumn and winter concentrations. For root zone thicknesses greater than 30 cm, pesticide concentration was found higher during autumn-winter than after application. It can be asserted that where the thickness of root zone is high (> 50 cm) there is no increase of pesticides in soil pore water during low rainfall seasons.
Agricultural activities represent an additional parameter able to significantly influence pesticide transport and fate. If farmers apply irrigation amounts higher than crops require, as often happens in the Plain, this additional water induced infiltration and subsequent mobilization of the pesticide to shallow groundwater. In detail, during dry seasons, farmers increased irrigation amount in spring and additional infiltration mobilized the pesticide into the soil pore water driving it to shallow groundwater, explaining summer occurrence of Linuron in 2004 and 2006 field surveys. Otherwise, the declared amount of irrigation did not affect pesticide concentration because it did not cause infiltration and all irrigation water was consumed by plant and evapotranspiration. Application by farmers of larger amounts of pesticide than they declare (by higher quantity or additional treatments) caused higher concentration in the soil and groundwater in the following year, showing pesticide increase over time in the unsaturated zone and, possibly, in groundwater.
From these findings, it is possible to build a conceptual model of pesticide fate in the Fucino Plain, related to Linuron occurrence. After April pre-treatment, a modest percentage (<15%) of the pesticide was washed off and transported into neighboring canals. Irrigation practices in early summer during drought seasons contributed to runoff and washoff to the canals too, causing peaks of pesticide in surface waters. At the same time irrigation accelerated infiltration through the soil, allowing pestcide to reach shallow groundwater, as observed by Liuron occurrence in summer in springs and wells. Singlerainfall events and large autumn rainfall contributed to the infiltration and enriched the soil pore water of contaminants. In soils with a medium hydraulic conductivity (>10-5 m/s) and a thin root zone (< 50 cm), Linuron
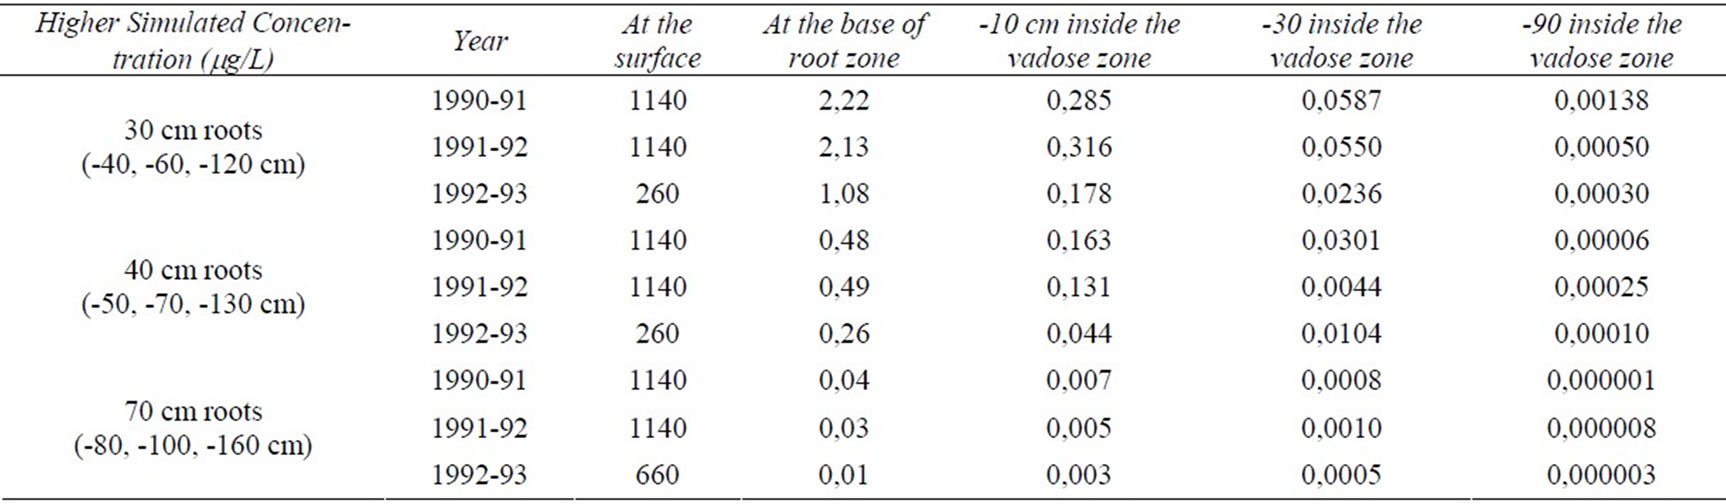
Table 4. Linuron maximum content in the three simulated years at the surface, at the interface of the root/vadose zone, and at fixed depths (-10, -30 and -90 cm below the interface root/vadose zone), for different root zone thicknesses (30, 40 and 70 cm).
reached groundwater in detectable concentrations (0.5- 0.01 g/L), locally over the legal limit of Italian law. During rainy seasons, Linuron concentration showed significant peaks in the soil pore water and could be driven to the water table in the following year, leading to groundwater contamination.
5. Conclusions
The IPTM-CS model was used with a daily time step to simulate fate and transport of pesticides found in surface waters and groundwater of the agricultural region of the Fucino Plain in Central Italy, through a representative soil column. Obtained results provided a better understanding of processes of transport through soil of pesticides found dissolved in water. Calibration was based on comparison of simulated and measured pesticide concentrations in surface waters during 2004 and 2006 surveys.
Conducted simulations allowed to quantify the influence of each parameter on infiltration and on runoff and thus to evaluate the groundwater pollution vulnerability in different conditions in the Fucino Plain. Rainfall occurring immediately after pesticide spreading triggered runoff transport, explaining high concentrations of different pesticides in surface waters at different times. Infiltration process started in fall at the end of irrigation season, due to effective rainfall; only persistent pesticides like Linuron were available in the vadose zone and reached the water table, causing contamination. This situation is subjected to additional constrains, like thin root zone (less than 50 cm) and high hydraulic conductivity (K>10-5 m/s), related to high vulnerability zones.
This general scenario can be locally influenced by human activities, if irrigation time and/or pesticide application are increasing, enhancing the infiltration process, in agreement with the observed presence of pesticides at time and locations unexpected by standard simulations.
From a methodological point of view, obtained results confirm the usefulness of the IPTM-CS model in simulating pesticide fate in an agricultural area. This approach, which considered a limited but representative range of parameters (soil type, pesticide, crop, water table, etc.) can reduce time-expensive field surveys and lab analyses, which in a wide area can not be performed in detail for each location.
6. Acknowledgements
We thank Dr. Xuefeng Chu (North Dakota State University) for providing the IPTM-CS software and for his support with the model. We also thank: Ezio Burri (Dipartimento Scienze Ambientali, Università dell’Aquila) coordinator of research project “Water and agriculture in the Fucino Plain”; A.R.S.S.A. local authority for agricultural development; PhD students Eva Pacioni and Andrea Marchetti for field data; graduate student Maria Fanelli and Dr. Fabrizio Ruggieri for pesticide laboratory analyses; and GTA private company for pesticide and potato parameters.
REFERENCES
- R. D. Rowden, H. Liu, and R. D. Libra, “Results from the Big Spring basin water quality monitoring and demonstration projects, Iowa, USA,” Hydrogeology Journal, Vol. 9, pp. 487–497, 2001.
- N. P. De Guzman, P. Hendley, D. I. Gustafson, I. van Wesenbeeck, A. J. Klein, J. D. Fuhrman, K. Travis, N. D. Simmons, W. E. Teskey, and R.B. Durham, “The acetochlor registration partnership state ground water monitoring program,” Journal of Environmental Quality, Vol. 34, pp. 793–803, 2005.
- D. J. Lapworth, D. C. Gooddy, M. E. Stuart, P. J. Chilton, G. Cachandt, M. Knapp, and S. Bishop, “Pesticides in groundwater: Some observations on temporal and spatial trends,” Water and Environment Journal, Vol. 20, pp. 55–64, 2003.
- X. Morvan, C. Mouvet, N. Baran, and A. Gutierrez, “Pesticides in the groundwater of a spring draining a sandy aquifer: Temporal variability of concentrations and fluxes,” Journal of Contaminant Hydrology, Vol. 87, pp. 176–190, 2006.
- D. J. Lapworth and D. C. Gooddy, “Source and persistence of pesticides in a semi-confined chalk aquifer of southeast England,” Environmental Pollution, Vol. 144, pp. 1031–1044, 2006.
- N. Baran, C. Mouvet, and P. Négrel, “Hydrodynamic and geochemical constraints on pesticide concentrations in the groundwater of an agricultural catchment (Brévilles, France),” Environmental Pollution, Vol. 148, pp. 729– 738, 2007.
- N. Baran, M. Lepiller, and C. Mouvet, “Agricultural diffuse pollution in a chalk aquifer (Trois Fontaines, France): Influence of pesticide properties and hydrodynamic constraints,” Journal of Hydrology, Vol. 358, pp. 56–69, 2008.
- I. S. Fomsgaard, G. Felding, and P. Schjønning, “Sampling and substrate application methods for pesticide mineralization experiments in undisturbed soil samples,” International Journal of Environmental Analytical Chemistry, Vol. 70, pp. 121–132, 1997.
- P. R. Jørgensen, L. D. McKay, and N. H. Spliid, “Evaluation of chloride and pesticide transport in a fractured clayey till using large undisturbed columns and numerical modelling,” Water Resources Research, Vol. 34, pp. 539– 554, 1998.
- W. Mersie, C. Seybold, D. Tierney, and C. McNamee, “Effect of temperature, disturbance and incubation time on release and degradation of atrazine in water columns over two types of sediments,” Chemosphere, Vol. 36, pp. 1867–1881, 1998.
- B. L. Hoyle and E. L. Arthur, “Biotransformation of pesticides in saturated-zone materials,” Hydrogeology Journal, Vol. 8, pp. 89–103, 2000.
- N. Tuxen, P. L. Tüchsen, K. Rügge, H. J. Albrechtsen, and P. L. Bjerg, ”The fate of seven pesticides in an aerobic aquifer studied in column experiments,” Chemosphere, Vol. 41, pp. 1485–1494, 2000.
- W. G. Knisel, “CREAMS: A field-scale model for chemicals, runoff, and erosion from agricultural management systems,” US Department of Agriculture, Science and Education Administration, Conservation Research Report, USDA, Washington, Vol. 26, 1980.
- W. A. Jury, W. F. Spencer, and W. J. Farmer, “Behavior assessment model for trace organics in soil. I. model description,” Journal of Environmental Quality, Vol. 12., pp. 558–564, 1983.
- J. D. Dean, P. S. Huyakorn, A. S. Donigian, K. A. Voss, R. W. Schanz, Y. T. Meeks, and R. F. Carsel, “Risk of unsaturated/saturated transport and transformation of chemical concentrations (RUSTIC), theory and code verification,” 1, EPA-600/3–89/048a, USEPA, Athens, GA, 1989.
- R. J. Wagenet and J. L. Hutson, “LEACHM: Leaching estimation and chemistry model,” Continuum Water Resources Institute, Cornell University, Ithaca, NY, Vol. 2. Version 2, 1989.
- W. H. J. Beltman, J. J. T. I. Boesten, and S. E. A. T. M. van der Zee, “Analytical modeling of pesticide transport from the soil surface to a drinking water well2,” Journal of Hydrology, Vol. 169, pp. 209–228, 1995.
- M. Klein, “PELMO pesticide leaching model, version 2.01, user’s manual,” Fraunhofer-Institut fur Umweltchemie und Okotoxikolgie, D-57392 Schmallenberg (Germany), 1995.
- L. R. Ahuja, K. W. Rojas, J. D. Hanson, M. J. Shaffer, and L. Ma, Eds., “The root zone water quality model,” Water Resources Publications LLC, Highland Ranch, CO, 2000.
- W. G. Knisel and F. M. Davis, “GLEAMS: Groundwater loading effects of agricultural management systems, version 3.0,” USDA-ARS, Southeast Watershed Research Laboratory, Publication n SEWRL-WGK/FMD-0650199, revised 081500, Tifton, Georgia, 2000.
- A. Tiktak, F. van den Berg, J. J. T. I. Boesten, M. Leistra, A. M. A. van der Linden, and D. van Kraalingen, “Pesticide emission assessment at regional and local scales: User manual of pearl version 1.1,” RIVM Report 711401008, Alterra Report 28, RIVM Bilthoven, 2000.
- R. F. Carsel, J. C. Imhoff, P. R. Hummel, J. M. Cheplick, and A. S. Jr. Donigian, “PRZM-3, a model for predicting pesticide and nitrogen fate in the crop root and unsaturated soil zones: Users manual for release 3.12,” National Exposure Research Laboratory, USEPA, Athens, GA, 2003.
- R. F. Carsel and R. S. Parrish, “Developing joint probability distributions of soil water retention characteristics,” Water Resources Research, Vol. 24, pp. 755–769, 1988.
- M. Larsbo and N. Jarvis, “MACRO 5.0: A model of water flow and solute transport in macroporous soil,” Technical Description, Emergo 2003:6 Report, ISSN 1651-7210, ISBN 91-756-6592-3. Swedish University of Agricultural Science, 2003.
- R. Denzer, C. Riparbelli, M. Villa, and R. Guttler, “GIMMI: Geographic information and mathematical models inter-operability,” Environmental Modelling & Software, Vol. 20, No. 12, pp. 1478–1485, 2005.
- H. J. Henriksen, P. Rasmussen, G. Brandt, D. von Bulow, and F. V. Jensen, “Public partecipation modeling using Bayesian networks in management of groundwater contamination,” Environmental Modelling & Software, Vol. 22, pp. 1101–1113, 2007.
- X. Chu and M. A. Mariño, “Semidiscrete pesticide transport modeling and application,” Journal of Hydrology, Vol. 285, pp. 19–40, 2004.
- X. Chu and M. A. Mariño, “IPTM-CS: A windows-based integrated pesticide transport model for a canopy-soil system,” Environmental Modelling and Software, Vol. 22, pp. 1316–1327, 2007.
- E. Burri and M. Petitta, “Groundwater lowering in karstic aquifers due to agricultural activity in the Fucino Plain (Abruzzi, central Italy),” Acta Carsologica, Vol. 27, No. 1–2, pp. 27–45, 1998.
- E. Burri and M. Petitta, “Agricultural changes affecting water availability: From abundance to scarcity (Fucino Plain, central Italy),” Irrigation and Drainage, Vol. 53, pp. 287–299, 2004.
- M. Petitta, E. Burri, A. Del Bon, and A. Marchetti, “Hydrogeological map of Fucino Basin, scale 1/50.000,” Atlante Tematico del Fucino, Selca, Italy, Vol. 1.
- M. Petitta, E. Burri, A. Del Bon, and G. Pannunzio, “Water and agriculture management: Environmental problems in the Fucino Plain (Central Italy),” In: Nitrates in groundwater, IAH Selected Papers, Taylor & Francis, Vol. 5, pp. 269–277, 2005.
- F. Ruggieri, M. Fanelli, D. Di Pasquale, E. Burri, and M. Petitta, “Evaluation by chemical parameters of the pollution state of the agricultural-industrial settlement of the Fucino Plain,” Annali di Chimica, Vol. 95, pp. 607–616, 2005.
- European Union, Council Directive 91/414/EEC, “Plant protection products,” Bruxelles, 1991.
- European Union, “Water framework directive,” Official Journal L 327, Bruxelles, 2000.
- Gazzetta Ufficiale, “Decreto legislativo 152/99,” Repubblica Italiana, Rome, Italy, 1999.
- X. Chu and M. A. Mariño, “Improved compartmental modelling and application to three-phase contaminant transport in unsaturated porous media,” Journal of Environmental Engineering, Vol. 132, pp. 211–219, 2006.
- M. M. Hantush and M. A. Mariño, “An analytical model for the assessment for pesticide exposure levels in soils and groundwater,” Environmental Modeling & Assessment, Vol. 1, pp. 263–276, 1996.
- L. Candela and M. A. Mariño, “Simulation of 2,4-D herbicide transport through the unsaturated zone using an analytical model,” International Journal of Environmental Analytical Chemistry, Vol. 84, pp. 123–131, 2004.
- Y. Mintz and G.K.Walker, “Global fields of soil moisture and land surface evapotranspiration derived from observed precipitation and surface air temperature,” Journal of Applied Meteorology, Vol. 32, pp. 1305–1334, 1993.
- R. G. Allen, L. S. Pereira, D. Raes, and M. Smith, “Crop evapotranspiration: Guidelines for computing crop water requirements,” FAO Irrigation and Drainage Paper, Vol. 56, 1998.
- J. J. T. I. Boesten and A. M. A. van der Linden, “Modeling the influence of sorption and transformation on pesticide leaching and persistence,” Journal of Environmental Quality, Vol. 20, pp. 425–435, 1991.
- J. A. Mullins, R. F. Carsel, J. E. Scarbrough, and A.M. Ivery, “PRZM-2: A model for predicting pesticide fate in the crop root and unsaturated soil zones: Users manual for release 2.0,” USEPA, Athens, PA, 1993.
- V. P. Singh, “Elementary hydrology,” Prentice Hall, Englewood Cliffs, 1992.
- ASTM, “Standard test method for classification of soils for engineering purposes,” ASTM D 2487–85, ASTM, Philadelphia, PA, 1985.
- W. J. Rawls, D. L. Brakensiek, and K. E. Saxton, “Estimation of soil water properties,” Transactions of the ASAE, Vol. 25, No. 5, pp. 1316–1320, 1982.
- D. R. Maidment, “Handbook of hydrology,” Mc Graw Hill, 1993.
- M. T. Van Genuchten, “A closed-form equation for predicting the hydraulic conductivity of unsaturated soils,” Soil Science Society of America Journal, Vol. 44, No. 5, pp. 892–898, 1980.
- Extoxnet, “Pesticide information profiles (PIPs) database,” Oregon State University. http:// extoxnet.orst.edu/ pips/ghindex.html, 2006.
- W. A. Jury, W. R. Gardner, and W. H. Gardner, “Soil physics,” Fifth Edition, Wiley & Sons, 1991.
- A. G. Hornsby, R. D. Wauchope, and A. E. Herner, “Pesticide properties in the environment,” Springer, 1996.
- E. Burri, E. Pacioni, and M. Petitta, “Nitrati e pesticidi nelle acque del bacino del Fucino in funzione della disponibilità della risorsa idrica e dell’attività agricola,” Atti dei Convegni Lincei, Vol. 198, pp. 97–111, 2006.
- USDA, “Urban hydrology for small watersheds,” Technical Release 55 (TR-55), Natural Resources Conservation Services, USDA, Washington, 1986.
- E. Pacioni, M. Petitta, and M. A. Mariño, “Simulation by the IPTM-CS model of pesticides found in surface water and groundwater of the Fucino Plain, Italy,” in Proceedings Water Quality and Sediment Behaviour of the Future: Predictions for the 21st Century, IAHS Vol. 314, pp. 188–196, 2007.
- E. Pacioni, “1D analysis of flow and transport of pesticides in unsaturated zone, for vulnerability evaluation of porous alluvial aquifer of Fucino Plain, Central Italy,” PhD dissertation, Earth Science Department, La Sapienza University of Rome, 2009.
- E. Pacioni, M. Petitta, Guidotti M., “Fluidodynamic of pesticides in the unsaturated zone: A column experiment related to the case-study of the Fucino Plain, Central Italy,” Giornale di Geologia Applicata, in press, 2010.