Journal of Software Engineering and Applications
Vol.10 No.06(2017), Article ID:76982,18 pages
10.4236/jsea.2017.106030
A New Vectorial Order Approach Based on the Classification of Tuples Attribute and Relative Absolute Adaptive Referent: Applications to Multicomponent Images
Adles Francis Kouassi 1,2,3, Sié Ouattara1,2, Jean-Claude Okaingni1,2, Adama Koné1,2, Wognin Joseph Vangah1,2, Georges Loum1,2, Alain Clement4
1Laboratory of Signals and Electrical Systems (L2SE)), Institut National Polytechnique Houphouët Boigny, Yamoussoukro, Cote D’Ivoire
2Institut National Polytechnique Houphouët Boigny (INPHB), Yamoussoukro, Cote D’Ivoire
3Ecole Supérieure des Technologies de l’Information et de la Communication (ESATIC), Abidjan, Cote D’Ivoire
4Institut Universitaire de Technologie d’Angers (IUT), Angers, France

Copyright © 2017 by authors and Scientific Research Publishing Inc.
This work is licensed under the Creative Commons Attribution International License (CC BY 4.0).
http://creativecommons.org/licenses/by/4.0/


Received: May 3, 2017; Accepted: June 16, 2017; Published: June 19, 2017
ABSTRACT
In this paper, we are presenting a new vector order, a solution to the open problem of the generalization of mathematical morphology to multicomponent images and multidimensional data. This approach uses the paradigm of P?order. Its primary principle consists, first in partitioning the multi-com- ponent image in the attribute space by a classification method in different numbers of classes, and then the vector attributes are ordered within each class (intra-order-class). And finally the classes themselves are ordered in turn from their barycenter (inter-class order). Thus, two attribute vectors (or colors) whatever, belonging to the vector image can be compared. Provided with this relation of order, vectors attributes of a multivariate image define a complete lattice ingredient necessary for the definition of the various morphological operators. In fact, this method creates a strong close similarity between vectors in order to move towards an order of the same principle as defined in the set of real numbers. The more the number of classes increases, the more the colors of the same class are similar and therefore the absolute adaptive referent tends to be optimal. On the other hand, the more the class number decreases or equals two, the more our approach tends towards the hybrid order developed previously. The proposed order has been implemented on different morphological operators through different multicomponent images. The fundamental robustness of our approach and that relating to noise have been tested. The results on the gradient, Laplacian and Median filter operators show the performance of our new order.
Keywords:
Multicomponent Image, P-Order Optima Adaptive Absolute Referent, Intraclass and Interclass Order, Morphological Operators, Noise

1. Introduction
Mathematical morphology (MM) is a non-linear image processing and irreversible approach based on a fundamental structure: Complete lattice  . Hence the construction of morphological operators needs an order between the elements to be treated. Theoretically a partial order is sufficient to construct complete lattices, but total orders are preferred because they do not introduce false colors [1] . Equipped with the complete lattice structure, it is possible to define morphological operators for any type of lattice. Although it is well-defined for binary and grayscale images, there is no admitted absolute order supported extension which enables to perform morphological operations on vector or multimodal images. Thus, the extension of mathematical morphology to multivariate images is a field which is the object of active research. Numerous different approaches have been proposed in the literature for color images and hyper spectral images [2] [3] [4] . Recently, we developed a new hybrid order based on an order reduced to Adaptive absolute reference [5] . We have highlighted the relevance of the morphological operators using this order as well as its robustness to noise. Unfortunately, this approach does not fully manage the proximity between tuples because the comparison between tuples is dependent on a referent and this referent is not necessarily the optimum. In order to take into account the notion of proximity as defined in the set of real, we propose in this article a variant of order of type P-order. It is based on the partition of tuples in different classes. The vectors are ordered in each class and the groups are ordered to obtain a total order. Contrary to the hybrid order [5] , which does not support the proximity between tuples since the comparison between tuples is only a referent dependent; this reference is not necessarily the optimum. The order by classification we propose in this article has the advantage of taking into account the notion of proximity between tuples.
The paper is organized as follows: in Section 2, we present the proposed approach then a theoretical and experimental validation of our approach is presented in Section 3. We shall conclude with some perspectives for future works, which will specifically be based on morphological classification and segmentation vector.
2. Research Question
Construction of morphological operators needs a complete lattice structure. In other words, the definition of new orders for the extension of the scalar algorithms vector case. The main issue with this kind of extension is based on the definition of a suitable vector ordering, because there is no natural ordering for vectors particularly in the case of mathematical morphology that makes it complex for color images application. The main of this paper is to presenting a new vector order, a solution to the open problem of the generalization of mathematical morphology to multicomponent images and multidimensional data [3] [4] [5] [6] .
3. Methodology
We present in this section the principle and algorithms for our new order.
3.1. Principle (Vector Order by Classification)
Firstly, the multidimensional compact histogram multicomponent of the image is calculated. Then the image attribute space is partitioned into a number of K- classes. After, we order each class attributes vectors (intraclass order) using the hybrid vector order we proposed recently in [5] . Finally, we propose a strategy for ordering two tuples belonging to different classes. It consists to order the centers of gravity of the relevant classes using the hybrid order. Also, the algorithm responding to this new order by classification is presented in Section 2.2. We emphasize that the partitioning algorithm used is the K-means method because of its simplicity and its good performance. In fact, this algorithm was long used on large data sets because of its speed. The work on the K-means method was initiated by Hartigan in 1975 [7] . In its algorithmic principle it combines the pixels of an image in separate K-classes, K being set by the user. An initialization of the K centers of gravity representing the K clusters is mandatory.
Each pixel of the image is randomly assigned to a cluster and it is iterated as follows: the centers of gravity of the different groups are recalculated and each pixel is again assigned to a group according to the nearest center of gravity. Convergence is achieved when the centers are fixed.
Let n be the number of color components of the image,  the vector associated with any one color of the image and N is the number of pixels of the image. At each an iteration, the vectors
  are divided into K groups. Note
  all the centers of gravity of the groups, calculated by averaging the coordinates of group of vectors. An attribute
  vector pixel is group j if:
 (1)
(1)
Each point is assigned to a class with the function defined as follows:
 (2)
(2)
Compact groups are then obtained by minimizing the following expression J:
 (3)
(3)
where  is the center of gravity of all the classes.
The K-means algorithm works by minimizing the Equation (3) on J iteratively.
3.2. Algorithm of Proposed Order
Let’s call I the image of the matrix associated with a multicomponent image N of the plan (N > 1). The compact histogram of I is divided into K-classes Ik where  and Ik the kth partition and Gk the barycenter of the Ik class.
Let  be the vector I of K-class and Cardinal of the class
  .
.
Consider
 (4)
(4)
the minimum absolute referent vector. Where each component corresponds to the minimum per component of all elements of that class and
 (5)
(5)
The minimum absolute referent vector centers of gravity and h is the bit- mixing function defined in [5] .
Let’s  and
and  be two vectors to be compared (intraclass order):
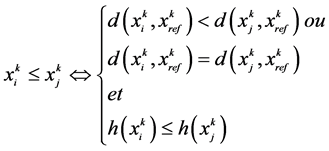 (7)
(7)
To classify the vectors belonging to different classes we will introduce the notion of order between two classes.
Let  and
and  be two distinct classes to be compared.
 (8)
(8)
Now, let’s consider two vectors  of
of  and
and  of
of , we admit the following proposal:
 (9)
(9)
We can illustrate our algorithm by the flow chart of the Figure 1.
Principal Algorithm
Let v be a neighborhood order 3 × 3 around pixel p of image I with (i,j) as coordinates. We designate L and M respectively the number of rows and columns of image I.
Let Hc be the compact histogram of an image, K the number of classes and Classe a struct which contains the colors by classe and the index by classes relatively to the compact histogram, ordred by increasing order.
[G, Classe] =K-MeansBis (Hc, K)
[HistoOrderlyFinal, IndexOrderlyFinal, ClasseFinal] =OrderByClassification (Hc, Classe, K)
For i=1 to L do

Figure 1. The flow chart of our algorithm.
For j=1 to M do
Determination of the neighborhood W=(Vp) around the pixel p(i,j)
//Determination of Vmin and Vmax: //
[Pos]=FindPositions (HistoOrderlyFinal, W); // returns the position of colors in W relatively to HistoOrderlyFinal//
Vmin= HistoOrderlyFinal(Min(Pos));
Vmax= HistoOrderlyFinal(Max(Pos));
//Determination of the Gradient and the Laplacian of the pixel p(i,j): //
Grad(i,j)=Gradient (p(i,j), Vmin, Vmax );
Lapl(i,j)=Laplacian (p(i,j), Vmin, Vmax );
MedFilter_Grad(i,j)=MedianFilter(P(i,j));
MedFilter_Lapl(i,j)=MedianFilter(P(i,j))
End for
End For
Function [Vmax, Vmin] = HybridOrderMaxMin(w)
// W: Histogram or matrix of colors //
// Let I be the matrix associated with a multicomponent image of P plans. We note Max and Min, the conventional comparison operators that are the maximum and minimum respectively.//
// Let  des N-tuple define
  so as: //
 (1)
(1)
 (2)
(2)
// The dilated Vmax and the eroded Vmin of the histogram W are defined by the following expressions:
 (3)
(3)
 (4)
(4)
// In the case of no unicity of Vmax and Vmin, the solution vectors are ordered according to the vector order by bit mixing, see the article [5] //
End
Function [IndexNewOrderly, HistoNewOrderly] = HistoOrderly (HistoCompact, Index)
// HistoCompact: the compact histogram of an image, see the article [5] . //
// Index: is a vector matric containing the position or order of colors in HistoCompact. //
N=length(HistoCompact ); // return the total number of colors in the image
IndexNewOrderlymin=[ ];
IndexNewOrderlymax=[ ];
HistoNewOrderlymin=[ ];
HistoNewOrderlymax=[ ];
HistoNewOrderly=[ ];
j←0
do
j←j+1
[Vmax, Vmin] = HybridOrderMaxMin(HistoCompact)
PosMin= FindPosition (Vmin) // return the position of Vmin in HistoCompact
PosMax= FindPosition (Vmax)
IndexNewOrderlyMin=[ IndexNewOrdermin, PosMin ];
IndexNewOrderlyMax=[ IndexNewOrderMax, PosMax ];
IndexNewOrderly=[ IndexNewOrderly, IndexNewOrderlymin];//returns the position of the minimums//
HistoNewOrder =[ HistoNewOrder, Vmin]; // returns colors of the HistoCompact ordered by increasing order//
HistoCompact(PosMin)= [ ];
Index(PosMin) =[ ]
While ( j
End
Function [G, Classe] =K-MeansBis (HistoCompact, K)
// HistoCompact: The Compact Histogram
// K: The number of classes
// G: The matrix of the centers of gravity of the classes ordered by the function HistoOrderly//
// Classe.Index: struct of tree type. It return the list of the positions of colors with regard to HistoCompact by Class //
// Classe.Histo: struct of tree type. It return the list of colors (Histogram) with regard to HistoCompact by Class //
[G1, Index1]=kmeans (HistoCompact, K);
// kmeans: function which returns the centroids of classes in G1 and the class number which each of the color of HistoCompact belongs to, in Index1 under Matlab //
Index2=[1:K]; // Matrix vector containing the numbers in increasing order from 1 to K
[Index2NewOrderly, G]= HistoOrderly(G1, Index2);
For k=1:K
Classe(k).Index=FindPositions(Index1, Index2NewOrderly( k)); // returns the positions of colors of the class number k//
Classe(k).Histo=HistoCompact(Classe(Index2NewOrderly( k)).Index)); // returns the positions of colors of the class number k//
end
End
Function [HistoOrderlyFinal, IndexOrderlyFinal, ClasseFinal] =OrderByClassification(Hc, Classe, K)
K:// The number of classes //
Hc:// The Compact Histogram//
HistoOrderlyFinal:// Compact Histogram ordered by classification order//
IndexOrderlyFinal:// Positions of the colors of Compact Histogram ordered by classification order//
ClasseFinal: // struct of tree type. It return the colors and list of the positions of colors ordered by classification order, with regard to HistoCompact by Class //
HistoOrderlyFinal=[ ];
IndexOrderlyFinal=[ ];
[G, Classe] =K-MeansBis (HistoCompact, K)
For k=1:K
[IndexNewOrderly, HistoNewOrderly]= HistoOrderly(Classe(k).Histo, Classe(k).Index )
ClasseFinal(k).Histo=HistoNewOrderly;
ClasseFinal(k).Index= IndexNewOrderly;
HistoOrderlyFinal= [HistoOrderlyFinal, HistoNewOrderly];
HistoOrderlyFinal=[ HistoOrderlyFinal, IndexNewOrderly];
end
End
4. Results and Discussions
In this section, the different parameters below are studied in order to highlight the relevance and robustness of our approach. They are as follows:
・ The influence of the number of classes upon the proposed orders;
・ Statistical link between our order and other orders;
・ The performance of the proposed order through the operators gradient and laplacien as compared to other orders;
・ The robustness of the median filter of the proposed order face to noise regard to other orders.
4.1. The Influence of the Number of Classes on the Proposed Orders
We study here the influence of the number of classes on the proposed order. To do this, we first review some mathematical quantities [8] , which are useful for our study.
4.1.1. Hamming Distance
Let A be an alphabet and F the set of sequences of length n with values in A. The Hamming distance between two elements a and b of F is the number of elements of the set of images of a that differ from that of b.
In other words, if d(,) denotes the Hamming distance:
 (8)
(8)
where the notation  denotes the cardinality of the set E.
4.1.2. Mutual Information
Let (X, Y) be a pair of random variables of joint probability density given by P (X, Y) Let us note the marginal distributions P (x) and P (y). Then the mutual information is in the discrete case:
 (9)
(9)
4.1.3. Correlation Coefficient
The correlation coefficient between two random variables X and Y each having a (finite) variance, denoted Cor (X, Y) or sometimes  is defined by
 (10)
(10)
where  denotes the covariance of the variables X and Y and their standard deviations.
4.1.4. The Influence of the Number of Classes upon the Proposed Orders
The proposed order requires a partitioning of the multidimensional histogram of the image and therefore the influence of the corresponding K parameter should be studied.
In fact, the variation of K has been studied on many natural and synthetic color images. To illustrate our approach, an analysis was made on the synthetic image Savoise of Figure 2 with its compact multidimensional histogram. The tuples or “colors” are ordered according to the lexicographic order indicated by their index of order.
We also presented some results on real images. For fundamental reasons we made K vary between 2 and 6 K as shown in the tables below.
For the proposed new order, (i.e.) order by classification, Table 1 shows the variation of the order of the tuples as a function of the number of classes of the

Figure 2. Synthetic image Savoise and its compact histogram (ordered according to the lexicographic order), and the index of tuples (position of colors in the compact histogram).

Table 1. Order by classification according to the number of K classes of the image Savoise.
synthetic image Savoise.
We see through this table that the order of tuples may change when the number of K classes varies and stabilized itself at a certain rank, here K = 5.
The study of the influence of K was also performed on real images. Direct assessment is not possible because of the number (Nt) of high tuples of the multidimensional histogram. For example, House and Mandrill images have a respective Nt 33,925 and 61,662. However, when K = 1 order by classification coincides with the hybrid reduced order. The same phenomenon is repeated when K tends to Nt.
Therefore, we have introduced in this section similarity measurements such as the generalized Hamming (DH) distance that is to say multi-symbols and the inter-class correlation coefficient (δ) and the mutual information to evaluate the the influence of K parameter when passing a number of classes K1 = I to a number of classes K2 = j. Thus, the Hamming distance between two tuples of the same length measures the number of symbols or positions for which the two tuples are different. Here DH is expressed as a (%) of the length of the tuples corresponding in practice to an error rate.
We note DHij, δij, IM and the Hamming distance respectively, the coefficient of correlation and mutual information between classes i and j.
We have calculated these similarity measurements on different images. An illustration is made on Savoise photographs House and Lena through Tables 2-4.
On the whole of the images processed and particularly the Tables 2-5 presented shows that:
・ The order changes with the variation in the number of K classes. This is due to the colorimetric content of the image;
・ The interclass similarity of Hamming varies randomly from an image to another. This is inevitably due to the content of the images;
・ When K tends to Nt, the similarity between interclass and orders is higher This has no practical interest for our application.
Indeed, the order of the tuples becomes stable when the number of classes increases.
Regarding the interclass correlation coefficient δij the results are not relevant and do not allow to objectively compare the orders because of the inclusion of the number of tuples.
The tests similarity measurement with mutual information IMij were unsuccessful because constant regardless of the combination of the number of K classes.
In addition, for i = i0 the j variation causes an increase of the Hamming distance interclass orders if the difference between (i0, j) increases. In other words, the similarity of the interclass orders is greater when the interclass distance is small. As shown in Tables 3-5.
As for the coefficient of linear correlation the interclass orders, it decreases when the deviation of the couple (i, j) increases. This is not the case for images
Table 2. Similarity of order by classification according to the number of classes of the image Savoise by DH.
Table 3. Similarity of order by classification according to the number of classes of the House image by DH.
Table 4. Order similarity by classification as a function of the number of classes of the Mandrill image by DH.
Table 5. Order similarity by classification according to the number of classes of the Lena image by DH.
Savoise and Lena. One might therefore think that its results depend on the colorimetric content of the image.
Also, when the Hamming distance is null, the correlation coefficient equal s 1 and therefore the distributions of the interclass orders are identical (see Table 2).
4.2. Statistical Link between the Different Levels
We study in this section the statistical relationship between the classification by order (marked OD_C) proposed in this article and other existing orders in the literature that we deemed relevant [5] such orders as bit mixing (OD_E), The reduced order (OD_R) and the hybrid order (OD_H). Only the Hamming distance is used here to evaluate the similarity between the different orders.
As before, for each image, the compact multidimensional histogram was calculated. The rank of tuples in the histogram is its index. For the different orders we have calculated each multidimensional histogram.
Using the multi-symbol Hamming distance, we have calculated the similarity rate of index ranks between orders two by two for a multitude of images for some results are recorded in the tables below.
Note that we took several different values of k for order by classification.
For each given order and image the inter order mutual information is identical and of the same value as that of the orders by interclass classification.
No law allows us to appreciate the distance of Hamming inter order when the class K number varies. This could be justified by the colorimetric content of the images.
When K = 2, the Hamming distance between the hybrid order and the classification order is the smallest for each image, as shown in Table 7 and Table 8. However, for the synthetic savoise image, the minimum Hamming distance is reached for the values of K = 2 and K = 6, as shown in Table 6. We can see that when the number of class is equal to the number of color in the image, the order by classification coincides with the hybrid order.
5. Performance Analysis of the Proposed Order through the Operators Gradient, Laplacian
Morphological Gradient and Laplacian
In image processing, the Gradient and the Laplacian are operators allowing highlighting the high frequency information in an image. Indeed, they perform a function of detecting contours. In discrete functional mathematical morphology,
Table 6. Similarity between orders: Case of the synthetic image Savoise.
Table 7. Similarity between orders: Case of the natural image House.
Table 8. Similarity between orders: Case of the natural image Mandrill.
they rely on two basic operators: dilation and erosion, which correspond to the maximum and minimum in a neighborhood of a pixel of the image commonly called a vectorial structuring element. We used the Symmetric Laplacian in this work. The following formulas describe these operators:
Let I be a multicomponent image with n (n> = 1) components and a B a structuring element. It is noted  expands I versus B and
  the eroded I. Let Max and Min respectively be the maximum and minimum elements of a set.
 (11)
(11)
 (12)
(12)
Hence the following expressions of the Gradient and the Laplacian are noted respectively Grad and Lapl:
 (13)
(13)
 (14)
(14)
The objective in this part is to evaluate quantitatively our gradient and Laplacian operators through the order by proposed classification and the hybrid order. Due to the lack of direct methods for evaluating the results of these operators, we used binary segmentation or thresholding to obtain contour segmentation images. For this we used the Otsu thresholding method [9] for this purpose. At this stage, we used several methods of evaluating contour segmentation [10] to indirectly evaluate our gradient and Laplacian results. Also, in the literature the proposed evaluation methods are supervised, i.e. they require field truths or expert segmentations.
In fact, the BSDS300 [10] Benchmark database with an image base with expert segmentations of contours allowed us to evaluate our contour detection operators through the two vector orders. Figure 3 shows two (02) images of the benchmark database with their ground truths.
From a quantitative point of view, different measurements of contour segmentation evaluation exist to evaluate the relevance of our contour detection operators. In our context we took into account distance from Pratt as well as Vinet measure.
The results are shown in Table 9(a) and Table 9(b). From the results

Figure 3. Images of the BSDS300 Benchmark database with their expert segmentations.
(a) (b)
Table 9. (a) Performance of gradient operators and Laplacian (Measure of Pratt); (b) Performance of gradient and Laplace operators in relation to the different vector orders (Measure of Vinet).
obtained we can make the following analysises:
The Vinet measurement generally gives constant values for the different values of K in the case of order by proposed classification; therefore it does not discriminate their performance.
- However, Pratt's measurement shows the performance of the different operators.
- The set of results from the different images of the database show that the proposed classification approach is generally efficient than the hybrid order for the gradient operator.
On the contrary, the hydric order is more efficient than the order by classification for the laplacian operator.
Note that the lower the measurement, the better the contour detection operator.
6. Robustness of the Order Provides Noise through the Median Filter
To test the effectiveness of our proposal to noise, we added impulsive noise to different images of the Benchmark BSDS300 Images database to study the robustness of the proposed approach and the median filter. We chose two images here for illustration (113044.jpg, 323016.jpg) and different noise powers were added to the images described by the parameter p.
For each noisy image we applied the median filter using the proposed order and the hybrid order, and then we calculated the error rates generated by each order. The results are shown in Table 10 and Table 11.
Table 10. Comparison of median filters for different vector orders studied picture 113044.jpg.
Table 11. Comparison of median filters for different vector orders Studied we 323016.jpg picture.
We noted that the results obtained have the same order of magnitude for the set of images.
However the error rate median filter is lower than the proposed hybrid order. We can conclude that our proposal is less robust to noise compared to the hybrid order. This could be explained by the fact that the classification algorithm used, in particular K-means, is sensitive to noise.
7. Conclusions and Perspectives
In this paper, we have presented a new vector order, a solution to the open problem of the generalization of mathematical morphology to multicomponent images and multidimensional data. Our proposal is a P-order. Indeed, it first parses the multicomponent image in the attribute space by the K-means classification method into different numbers of classes. Then the attribute vectors are ordered within each class (intra class order). And finally the classes themselves are ordered in turn from their barycenter (interclass order). Equipped with this order the space attribute of the image is a complete lattice.
We can conclude that on all images tested, the proposed order by classification gives better results than the hybrid order on the gradient operator, specifically for edge detection. However, our order resists less noise than the hybrid order.
In our future work we intend to improve the noise resistance of our order by using a classification method rather than the K-means algorithm. Then we know that K varies theoretically from 1 to Nt. Indeed, the choice or the implementation of an unsupervised evaluation criterion should automatically allow us to obtain the value K = Kopt producing for each morphological operator (Gradient, Laplacian, Median filter, etc.), the optimal solution whatever the vector order may be.
What is more, we shall also focus our research on the development of new methods of Vector morphological segmentation based on scalar approaches or grayscale.
Cite this paper
Kouassi, A.F., Ouattara, S., Okaingni, J.-C., Koné, A., Vangah, W.J., Loum, G. and Clement, A. (2017) A New Vectorial Order Approach Based on the Classification of Tuples Attribute and Relative Absolute Adaptive Referent: Applications to Multicomponent Images. Journal of Software Engineering and Applications, 10, 546-563. https://doi.org/10.4236/jsea.2017.106030
References
- 1. Ronse, C. (1990) Why Mathematical Morphology Needs Complete Lattices. Signal Process, 21, 129-154.
https://doi.org/10.1016/0165-1684(90)90046-2 - 2. Aptoula, E. and Lefevre, S. (2009) Multivariate Mathematical Morphology Applied to Color Image Analysis. In: Collet, C., Chanussot, J. and Chehdi, K., Eds., Multivariate Image Processing: Methods and Applications, ISTE-John Wiley, Hoboken, 303-337.
- 3. Angulo, J. (2007) Morphological Color Operators in Totally Ordered Lattices Based on Distances: Application to Image Filtering, Enhancement and Analysis. Computer Vision and Image Understanding, 107, 56-73.
https://doi.org/10.1016/j.cviu.2006.11.008 - 4. Aptoula, E. and Lefevre, S. (2007) A Comparative Study on Multivariate Mathematical Morphology. Pattern Recognition, 40, 2914-2929.
https://doi.org/10.1016/j.patcog.2007.02.004 - 5. Ouattara, S., Kouassi,A., Okaingni, J.C., Koffi, A., Loum, G. and Clement, A. (2016) A New Hybrid Order Approach to Morphological Color Image Processing Based on Reduced Order with Adaptive Absolute Reference. Engineering, 8, 633-645.
https://doi.org/10.4236/eng.2016.89057 - 6. Valle, E. and Vicente, D.M.G. (2013) Sparsely Connected Autoassociative Lattice Memories with Implementation Year for the Reconstruction of Color Images. Journal of Mathematical Imaging, 32, 786-796.
- 7. Hartigan, J.A (1975) Clustering Algorithms. John Wiley and Sons, New York.
- 8. Sié, Q., Clément, A. and Chapeau-Blondeau, F. (2007) Fast Computation of Entropies and Mutual Information for Multispectral Images. 4th ICINCO (International Conference on Informatics in Control, Automation and Robotics), Angers, 9-12 May 2007.
- 9. Otsu, N. (1979) A Threshold Selection Method from Grey-Level Histograms. IEEE Transactions on Système Man and Cybernetics, SMC-9, 62–66.
https://doi.org/10.1109/TSMC.1979.4310076 - 10. Arbelaez, P., Maire, M., Fowlkes, C. and Malik, J. (2011) Contour Detection and Hierarchical Image Segmentation. Transactions on Pattern Analysis and Machine Intelligence, 33, 898-916.
https://doi.org/10.1109/TPAMI.2010.161