Journal of Software Engineering and Applications
Vol.6 No.5(2013), Article ID:31451,8 pages DOI:10.4236/jsea.2013.65031
Higher-Order Statistics for Automatic Weld Defect Detection
![]()
Department of Computer Engineering, Faculty of Engineering and Technology, Arab Academy for Science and Technology, Cairo, Egypt.
Email: eng_sarasaber@hotmail.com
Copyright © 2013 Sara Saber, Gamal I. Selim. This is an open access article distributed under the Creative Commons Attribution License, which permits unrestricted use, distribution, and reproduction in any medium, provided the original work is properly cited.
Received February 17th, 2013; revised March 18th, 2013; accepted March 26th, 2013
Keywords: High Order Statistics; Defect Detection; Radiographic Images; Non-Destructive Testing
ABSTRACT
Image processing and image analysis are the main aspects for obtaining information from digital image owing to the fact that this techniques give the desired details in most of the applications generally and Non-Destructive testing specifically. This paper presents a proposed method for the automatic detection of weld defects in radiographic images. Firstly, the radiographic images were enhanced using adaptive histogram equalization and are filtered using mean and wiener filters. Secondly, the welding area is selected from the radiography image. Thirdly, the Cepstral features are extracted from the Higher-Order Spectra (Bispectrum and Trispectrum). Finally, neural networks are used for feature matching. The proposed method is tested using 100 radiographic images in the presence of noise and image blurring. Results show that in spite of time consumption, the proposed method yields best results for the automatic detection of weld defects in radiography images when the features were extracted from the Trispectrum of the image.
1. Introduction
Non-Destructive Testing NDT has been considered as a simple laboratory curiosity but throughout the past Five decades, it was proved to be one of the essential tools in industry. Although radiography is one of the oldest techniques of NDT, it is still one of the most important Criteria in controlling weld joint in various industries. Furthermore, Welding can be defined as the process of combining metals using heat, pressure or both with or without a filler metal to produce localized union through fusion or recrystallization across the interface [1]. It is essentially used for several reasons such as the lack or the difficulty of a material to function solely, economic reasons, simplicity in usage as well as maintenance and repair. The quality of welding is relatively depends on the application to evaluate whether it'll be considered of a good quality or not, if it meets appearance requirements and continues indefinitely to do the job for which it is intended to do therefore, it is of a good quality.
Non Destructive Testing (NDT) methods are used for welding process inspection by examining the surface and subsurface of the weld and surrounding base material. Five basic methods are commonly used to examine welds; visual, liquid penetrate, magnetic particle, ultrasonic and radiographic [2]. Radiography can be carried out using X-rays, a radioactive gamma source, or a neutron source. In gamma radiography, a gamma beam is transmitted from the radiation source to penetrate the weld. Different levels of absorption take place in the defective part and the surrounding metal, depending upon the material used as shown in Figure 1 [3]. A radiographic record of the transmitted energy, called the radiograph, is obtained. It is based on the different degrees of penetration of the radiant energy in the weld. When less absorption occurs owing to a thin section of metal, dark regions appear in the radiograph, where more penetration of the rays takes place. On the other hand, thicker areas or higher density materials absorb more radiation, and their corresponding images on the radiograph are lighter. The film is developed and treated with chemical components in a darkroom before the radiograph of the weld interior can be inspected clearly using an illumination box [2]. The film can be used for evaluating the weld area by a radiographic expert or can be digitized to the computer using a digital camera or scanner. The interpretation of the radiographic film can be done automatically or by a skilled operator. The automatic weld defect detection in radio-
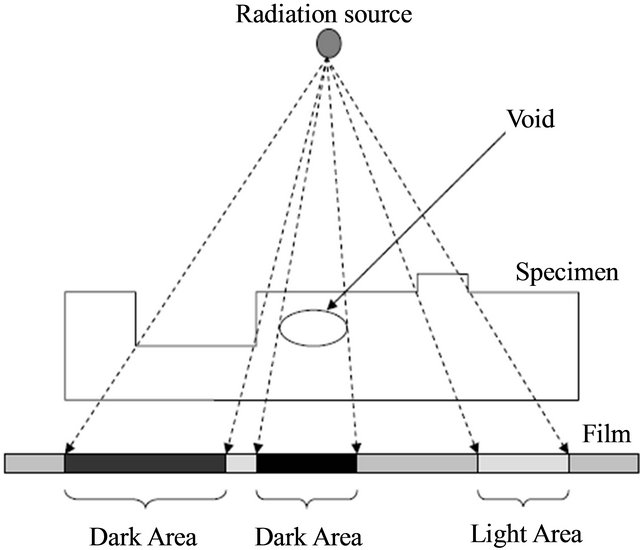
Figure 1. Gamma radiography principles.
graphy images has been studied by several researchers using various techniques and approaches [4-11]. Recently, Kasban et al. [12,13] used Cepstral approaches depending on extracting the features from the transform domains or from the power density related to the images.
The rest of this paper is organized as follows. Section 2 presents the proposed automatic weld defect detection method. Section 3 presents the image enhancement procedure. The method of selecting the welded area is presented in Section 4. Section 5 presents the usage of Higher Order Statistics (HOS) in the automatic detection of weld defects. Finally, conclusions are illustrated in Section 6.
2. Proposed Automatic Weld Defect Detection Method
The proposed approach in this paper is shown in Figure 2, the radiographic images were enhanced using Adaptive Histogram Equalization and filtered using Mean and Wiener filters. Secondly, the welding area was selected from the whole radiography image. Thirdly, the Cepstral features were extracted from the High Order Spectra (HOS) using Bispectrum and Trispectrum methods. Finally, neural networks were used for feature matching.
3. Image Enhancement
Image enhancement is required for improving the contrast between the image background and the weld area and for removing any noise originating from the digitizing process. In this paper, the radiographic images were enhanced using contrast enhancement and image filtering.
3.1. Contrast Enhancement
The histogram equalization improves the visual appear-
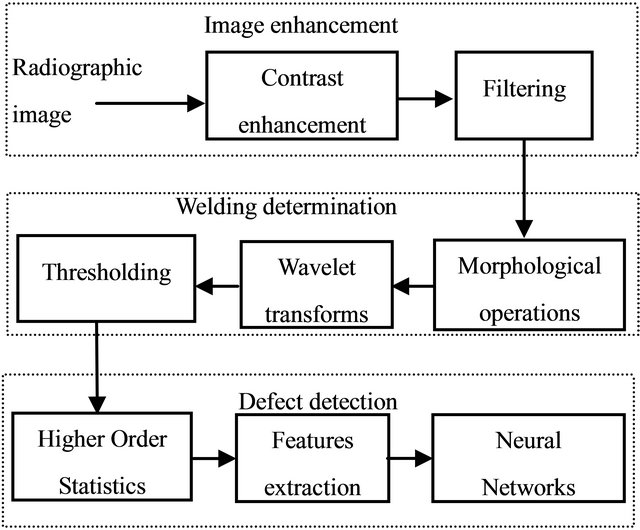
Figure 2. Automatic weld defect detection method.
ance of the image by assigning equal number of pixels to all available intensity values [14]. Image contrast can be maximized using adaptive histogram equalization by adaptively enhancing the contrast of each pixel relative to its local neighborhood. This process produces improved contrast for all levels of contrast in the original image. In this process firstly, the histograms are calculated for small regional areas of pixels, producing local histograms, then equalize these local histograms or are remapped from the often narrow range of intensity values indicative of a central pixel and its closest neighbors to the full range of intensity values available in the display. Adaptive Histogram Equalization (AHE) can provide better contrast in local areas than that achievable utilizing traditional histogram equalization method. The traditional methods process the entire image at once, where adaptive histogram equalization utilizes local contextual region. Consider an image of size M × N, gray levels Gy, the cumulative histogram H(g), then the transfer function FHE(g) that maps the original gray levels into the transformed ones is define as [13]:
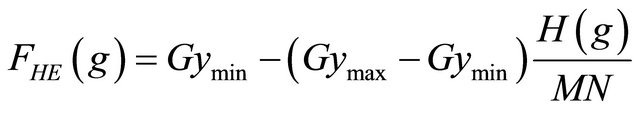 (1)
(1)
where Gymax and Gymin are the upper and lower limits of the transformed gray values, respectively. The adaptive histogram equalization is made adaptive by taking the histogram over a local region instead of the whole image as [13]:
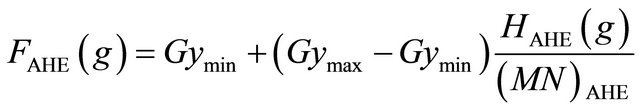 (2)
(2)
3.2. Filtering
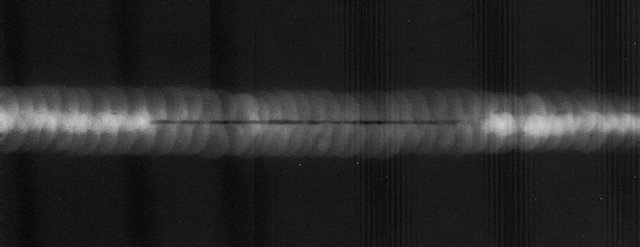
Image filtering can be used for removing the noise, sharpen contrast, or highlight contours from the radiographic images. Recently many researchers used and compared many filters and they proved that Wiener filter is the most suitable one for the radiographic image filtering process [13,15,16], so that wiener filter has been selected in this paper. Wiener filter is designed by minimizing the MSE between the filtered image and the original image. It can be applied to the image adaptively, tailoring itself to the local Image variance. Where the variance is large, it performs little smoothing, where the variance is small it performs more smoothing. Since the intensities of the pixels in the weld area distribute more as a Gaussian distribution than other areas in the image of weld [5], it was selected for filtering radiographic images of welds. Figure 3 shows the effects of the image enhancement process on the radiographic image.
The results show that the contrast enhancement and the image filtering improve the radiographic image quality by improving the contrast between the image background and the weld defect regions.
4. Welding Area Determination
Determination the welding area from the hall radiography image is important process for elimination of irrelevant information, leaving only the area of interest in the image. Many researchers have been carried out this process using different algorithms and different data set and they achieved different results [13,16-17]. In this paper, the welding area is determined in three steps; the
 (a)
(a)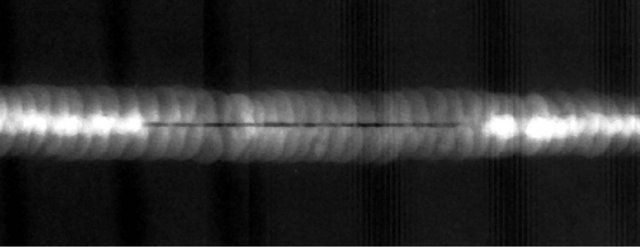 (b)
(b)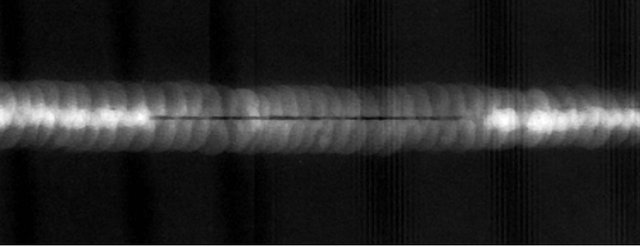 (c)
(c)
Figure 3. Radiographic image enhancement. (a) Original image; (b) After contrast enhancement; (c) After filtering.
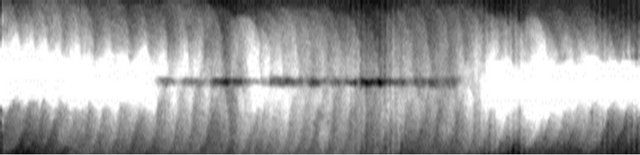
to the image using a flat disk structuring element. The second step is applying discrete wavelet transform (DWT) to the closed image which leads to a decomposition of this image into four components; the approximation component and three detail components. The last step is thresholding the image using a threshold value. This value is automatic obtained from the occurrence histogram. The occurrence histogram of the local variance image exhibits at least two distinct peaks. The largest peak corresponds to the background while the others correspond to objects in the image. The gray level corresponding to the first trough between the first two peaks is considered the optimal threshold value for discrimination between the objects and the background [13]. Figure 4 shows the result of this process when applied on the enhanced image shown in Figure 3(c).
5. Weld Defect Detection
In the proposed method for weld effect detection the Cepstral features are extracted from the HOS (Bispectrum and Trispectrum) related to the welding area from the radiographic images. These areas are lexicographically ordered into 1-D signals. The features are extracted from database consists of 100 signals. These features are used to train a neural network resulting features database. In neural network testing, the features are extracted from these signals then matching these features with the features that stored in the database during the training. For testing the proposed approach the tested signals have been degraded by different types of noise.
5.1. Power Density Spectrum and Higher Order Statistics
Power Density Spectrum (PDS) describes how the power of a signal is distributed with frequency. There are several methods for estimating the PDS, which are divided into three categories; nonparametric methods, parametric methods and advanced-analysis methods [18]. In this paper we will take one method from the third category that has been achieved the best results in weld defect detection (MUSIC method) previously in [13]. The HOS are extensions of second-order measures such as the auto-
 (a)
(a)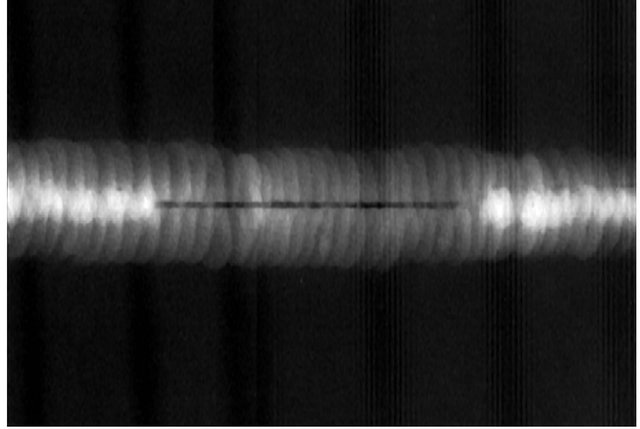 (b)
(b)
Figure 4. Welding area determination. (a) Whole enhanced image; (b) Welding area.
correlation function and power spectrum. The Bispectrum provides an integral representation of the thirdmoment function of the process (skewness), where Trispectrum provides an integral representation of the fourth moment (kurtosis) [19]. The HOS are used because the second-order measures contain no phase information, so that the non-minimum phase signals cannot be correctly identified by 2nd-order techniques. And any Gaussian signal is completely characterized by its mean and variance. Consequently the HOS of Gaussian signals are either zero (e.g. the 3rd order moment of a Gaussian signal is zero), or contain redundant information. Many signals encountered in practice have non-zero HOS, and many measurement noises are Gaussian, and so in principle the HOS are less affected by Gaussian background noise than the 2nd order measures. E.g. the power spectrum of a deterministic signal plus Gaussian noise is very different from the power spectrum of the signal alone. However the Bispectrum of the signal and the noise is, at least in principle, the same as that of the signal [20]. HOS can be estimated using non-parametric or parametric methods. The non-parametric methods may be direct or indirect methods. The indirect method based on estimating the cumulant function and then taking Fourier transforms, while the direct method based on a segment averaging approach. The estimation methods in details are found in [21].
5.2. Feature Extraction
The image features are the most basic characteristics, it used to distinguish an image from others. The Mel Frequency Cepstral Coefficients (MFCCs) and the polynomial coefficients are used successfully in weld defect detection from radiographic images [12,13]. The Melscale is a mapping between the real frequency scale in Hz (flinear) and the perceived frequency scale in Mels (fmel). The Mapping is virtually linear below 1 kHz and logarithmic above as given by the following equation [12]:
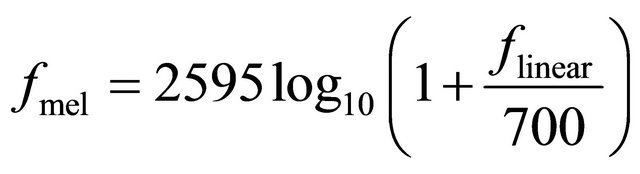 (3)
(3)
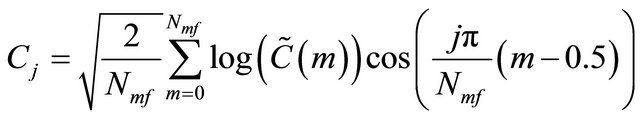
The mel-frequency warping is performed using a melfilter bank composed of a set of band-pass filters with constant bandwidths and spacing on the mel-scale .The bank consists of one filter for each desired mel-frequency component, where each filter has a triangular filter bandpass frequency response. The triangular filters are spread over the entire frequency range from zero to the Nyquist frequency. The number of filters is one of the parameters, which affect the recognition accuracy of the system. The last stage involves performing a DCT on the log of the Mel-spectrum. If the energy of the mth mel-filter output is the MFCCs will be given as follow [12]:
 (4)
(4)
where , Jmf is the number of MFCCs, Nmf is the number of Mel-filters and cj are the MFCCs. The number of the resulting MFCCs is 13, since most of the signal information is represented by the first few coefficients. The 0th coefficient represents the average log energy of the frame.
The MFCCs are sensitive to mismatches and time shifts between training and testing data. Thus, there is a need for other coefficients to be added to the MFCCs to reduce this sensitivity. Polynomial coefficients can be used for this purpose as these coefficients can help in increasing the similarity between the training and the testing signals. To calculate the polynomial coefficients, the time waveforms of the Cepstral coefficients are expanded by orthogonal polynomials. The following two orthogonal polynomials have been used [12]:
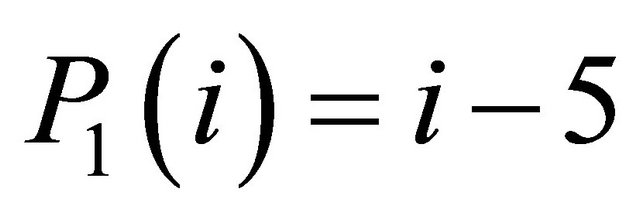 (5)
(5)
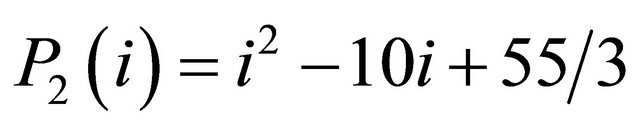 (6)
(6)
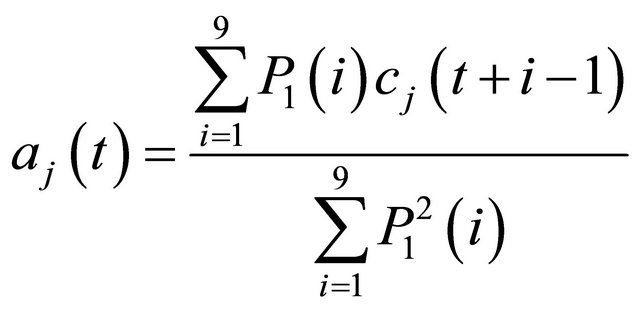
To model the shape of the MFCCs time functions, a nine elements window at each MFCC is used. Based on this window assumption, the polynomial coefficients can be calculated as follow [12]:
 ,
,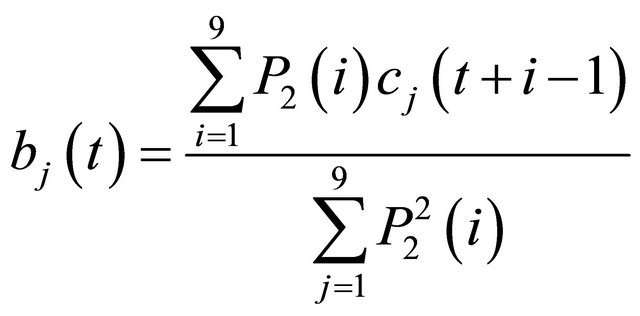
(7)
where aj(t) and bj(t) are the slope, and the curvature of cj in the tth frame. The vectors containing all cj, aj and bj are concatenated to form a single features vector.
5.3. Artificial Neural Network
The Artificial Neural Networks (ANNs) are computational representations based on the biological neural architecture of the brain [22]. ANN has several advantages such as; it can perform tasks more than the linear system, when an element of the ANN fails, it can continue without any problem by their parallel nature, ANN learns and does not need to be reprogrammed, ANN can be implemented in any applications, and finally, ANN can be implemented without any problem. The ANN suffers from some drawbacks such as; it needs training to operate, the architecture of ANN is different from the architecture of microprocessors therefore needs to be emulated, and it requires high processing time for large neural networks. The ANNs have been successfully applied in weld defect detection from radiographic images [12,23,24]. In this paper the ANNs are trained about the features of the radiographic images in the training stage. In testing stage it make a feature matching between the features of the tested image and the features that stored during the training. The used ANN is a Multi-layer perceptions (MLPs) neural network has an input layer, a single hidden layer, and an output layer. A single neuron only of the output layer is shown for simplicity. Each neuron in the neural network is characterized by an activation function and its bias, and each connection between two neurons by a weight factor. In this paper, the neurons from the input and output layers have linear activation functions and hidden neurons have the following sigmoid activation function:
 (8)
(8)
Therefore, for an input vector E, the neural network output vector Y can be obtained according to the following matrix equation [13]:
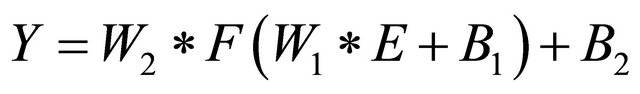 (9)
(9)
where W1 and W2 are the weight matrices between the input and the hidden layer and between the hidden and the output layer, respectively, and B1 and B2 are bias matrices for the hidden and the output layer, respectively. The training algorithm adapts the weights by attempting to minimize the sum of the squared error between a desired output and the actual output of the output neurons given by [13]:
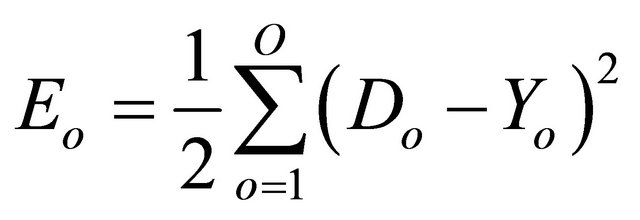 (10)
(10)
|
5.4. Weld Defect Detection Results
In radiographic systems, there is a variety of imaging noise sources, which originate from the different stages and elements of the system, such as gamma ray source, scattered radiation, imaging screen or electronic circuits among others [25]. The proposed method is run 8 times according to image degradations and image blurring. The degradations considered are Gaussian, impulsive, speckle and Poisson noise with and without image blurring. For each time, the features are extracted separately and compared from 5 signals related to the image. The first signal is the power density spectrum (PDS) of the image estimated by Multiple Signal Classification (MUSIC) method. The second signal is the Bispectrum of the image estimated by direct method. The third signal is the Bispectrum of the image estimated by indirect method. The fourth signal is the Bispectrum of the image estimated by ARMA method. The last signal is the Trispectrum of the image estimated by ARMA method.
Gaussian noise is the most common type of noise that results from the contributions of many independent signals [26]. In radiographic images, Gaussian noise may come from many natural sources, such as the thermal vibrations of atoms in conductors, black body radiation from the earth and other warm objects. To test the proposed method in the presence of the Gaussian noise, the percentage of detection rate is plotted with respect to the Signal to Noise Ratio (SNR) in decibel as shown in Figure 5. The results show that the detection rate is increase by increasing the SNR, and the parametric methods for higher order spectra estimation give higher detection rate than the nonparametric (direct and indirect) methods or PDS estimated by MUSIC method. The Bispectrum gives higher detection rate at low SNR (lower than 12 dB), and at high SNR the Trispectrum gives the higher detection rate.
Image blurring makes the image unfocused. It has been carried out by convolving the image with a low pass filter with kernel:
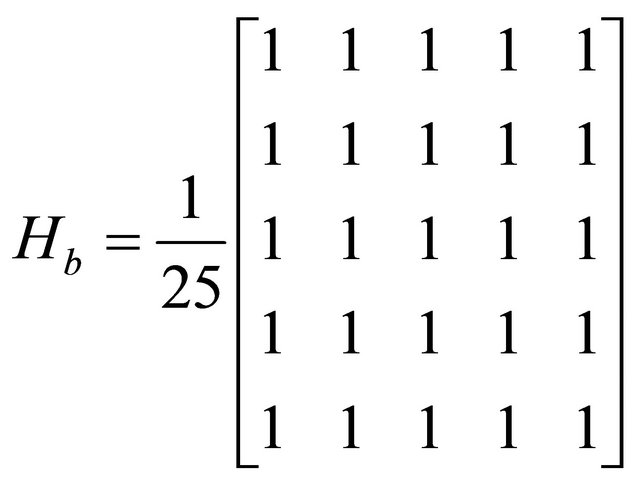 (11)
(11)
In the presence of the Gaussian noise with blurring, the detection rate is plotted against the SNR as shown in Figure 6.
The results show that the parametric methods for

Figure 5. Detection results when the tested images are degraded by Gaussian noise.
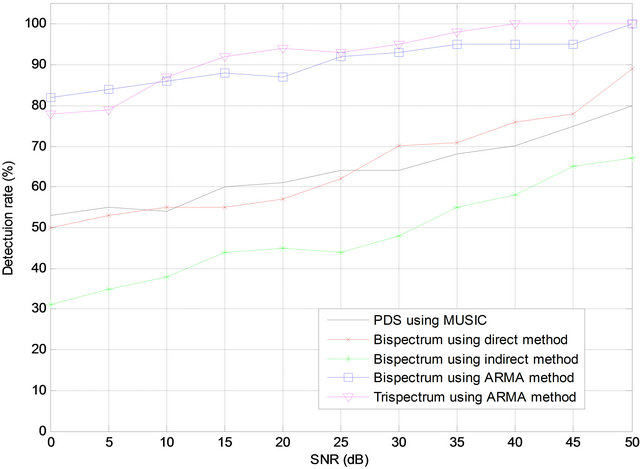
Figure 6. Detection results when the tested images are blurred and degraded by Gaussian noise.
higher order spectra estimation give higher detection rate than the nonparametric or PDS estimated using MUSIC method. The Bispectrum gives higher detection rate at low SNR (lower than 10 dB), and at high SNR the Trispectrum gives the higher detection rate. By comparing the results in Figures 5 and 6 we see that the image blurring decrease the detection rate.
Impulse noise corruption is very common in digital images. It is always independent and uncorrelated to the image pixels and is randomly distributed over the image [27]. Failures in sensors, readout circuits, A/D converters, or communication channels may introduce impulsive noise in digital images, in particular in radiography. Impulsive noise has been added to the radiographic images in the form of salt and pepper noise. In this case, the percentage detection rate is plotted against the percentage impulsive noise, as shown in Figure 7.
The results show that, the detection rate is decrease by increasing the impulsive noise, and the parametric methods for higher order spectra estimation give higher detection rate than the nonparametric (direct and indirect) methods or PDS estimated by MUSIC method. The Trispectrum gives the higher detection rate. In the presence of the impulsive noise after image blurring the percentage detection rate is plotted against the percentage impulsive as shown in Figure 8.
The results is similar to the results obtained in Figure 7, but it is noted that the image blurring decrease the detection rate. Speckle noise may be results from random fluctuations in the return signal from an object that is no bigger than a single image-processing element. It increases the mean grey level of a local area. Speckle noise has general model with the equation [28]:
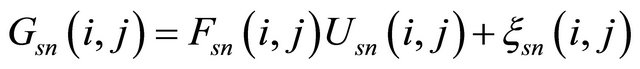 (12)
(12)
where Gsn, Fsn, Usn and ξsn refers to the observed image, original image, multiplicative component and additive
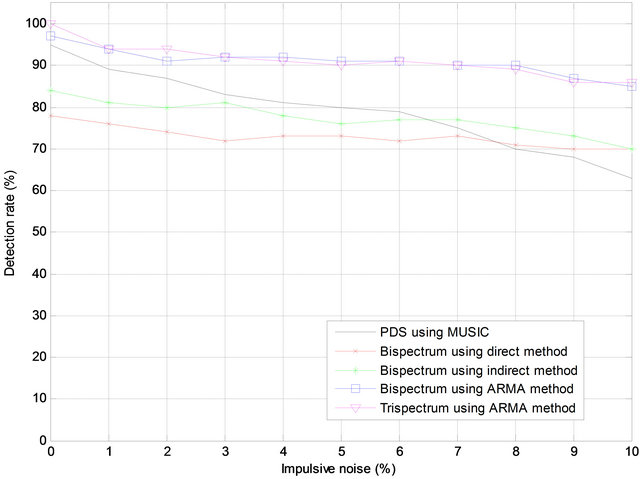
Figure 7. Detection results when the tested images are degraded by impulsive noise.
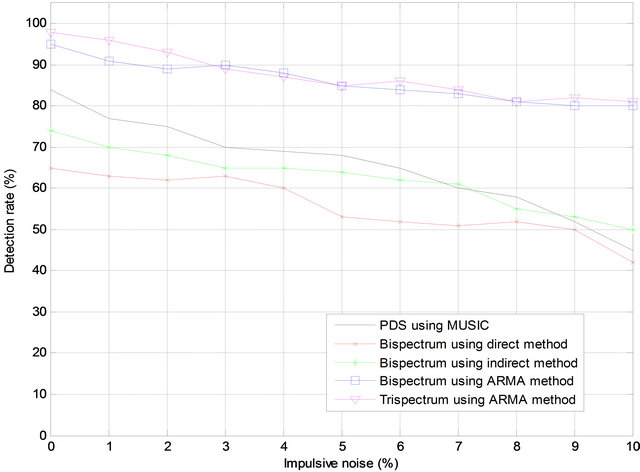
Figure 8. Detection results when the tested images are blurred and degraded by impulsive noise.
component of the speckle noise respectively. In the presence of the speckle noise, the detection rate is plotted against the noise variance as shown in Figure 9.
The results show that, the detection rate is decrease by increasing the noise variance, and the parametric methods for higher order spectra estimation give higher detection rate than the nonparametric (direct and indirect) methods or PDS estimated by MUSIC method. The Trispectrum gives the higher detection rate. In the presence of the speckle noise after image blurring the percentage detection rate is plotted against the percentage impulsive as shown in Figure 10.
The results is similar to the results obtained in Figure 9, but it is noted that the image blurring decrease the detection rate. Unlike Gaussian noise, Poisson noise is proportional to the underlying signal intensity, which makes separating signal from noise a very difficult task [29]. It may be result when the finite number of particles that carry energy is sufficiently small so that uncertainties
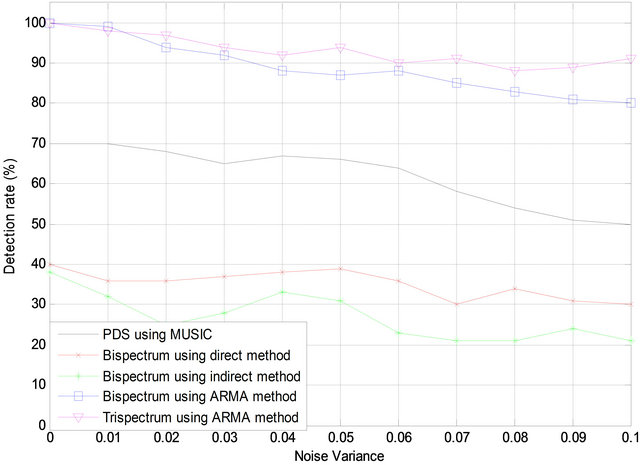
Figure 9. Detection results when the tested images and degraded by speckle noise.
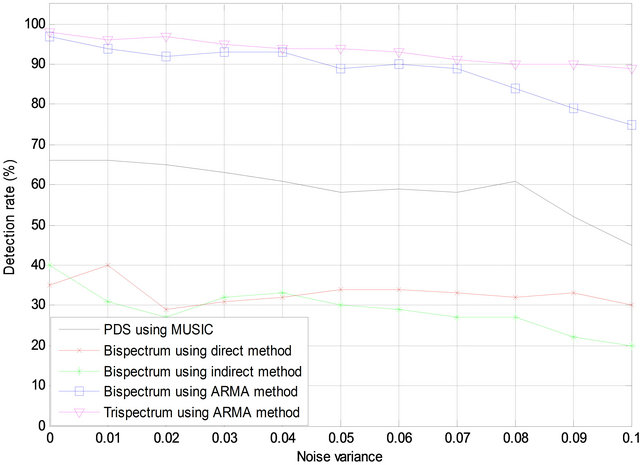
Figure 10. Detection results when the tested images are blurred and degraded by speckle noise.
due to the Poisson distribution, which describes the occurrence of independent random events, are of significance. In the presence of the Poisson noise with and without blurring, the detection rates are summarized in Table 1.
The results show that, the parametric methods for higher order spectra estimation give higher detection rate than the nonparametric (direct and indirect) methods or PDS estimated by MUSIC method. The Trispectrum gives the higher detection rate. The major disadvantage of using the HOS is that it consume more time for estimation than the PDS. The processing time for testing 100 images by the proposed method for different contaminations is tabulated in Table 2. The processing time results are obtained using an i5 Dell laptop running MATLAB software.
6. Conclusion
This work proposes a method for the automatic detection
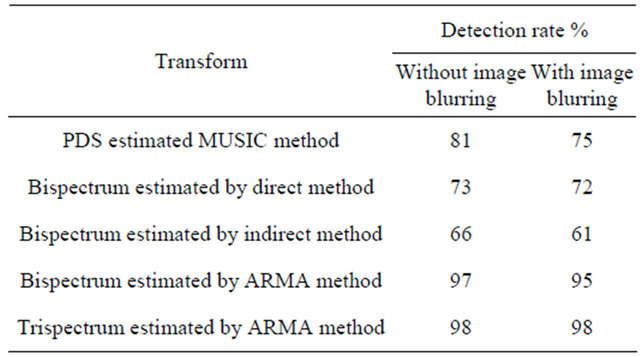
Table 1. Detection results when the tested images are degraded by Poisson noise with and without blurring.

Table 2. The processing time for testing 100 images by the proposed method for different contaminations.
of weld defects in radiographic images. Previously, the Cepstral features were extracted from the Power Density Spectrum (PDS) using MUSIC method. We propose using Higher Order Spectra of the images (Bispectrum and Trispectrum) to extract the Cepstral features. The proposed method was tested and ran 8 times according to image degradations and image blurring. The degradations were Gaussian, Impulsive, Speckle and Poisson noise applied with and without image blurring. We conclude that in spite of time consumption, the proposed method yields best results for the automatic detection of weld defects in radiography images when the features were extracted from the Trispectrum of the image.
REFERENCES
- J. T. Karlsen, G. Farrants, T. Torgrimsen and A. Reith, “Chemical Composition and Morphology of Welding Fume Particles and Grinding Dusts,” American Industrial Hygiene Association Journal, Vol. 53, No. 5, 1992, pp. 290-297. doi:10.1080/15298669291359681
- C. Hayes, “The ABC’s of Nondestructive Weld Examination,” Welding Journal, Vol. 76, No. 5, 1998, pp. 46-51.
- W. K. F. Thai, “Development of a Computed Radiography-Based Weld Defect Detection and Classification System,” M.Sc. Thesis, University of Sains, Penang, 2008.
- H. R. Sim, M. B. Rabello, R. Camargo and M. S. Pereira, “Digital Radiography for the Inspection of Weld Seams of Pipelines—Better Sensitivity,” Welding International, Vol. 24, No. 4, 2010, pp. 249-257. doi:10.1080/09507110902844022
- G. Wang and T. W. Liao, “Automatic Identification of Different Types of Welding Defects in Radiographic Images,” Nondestructive Testing and Evaluation: An Intertional Journal, Vol. 35, No. 8, 2002, pp. 519-528.
- H. I. Shafeek, E. S. Gadelmawla, A. A. Abdel-Shafy and I. M. Elewa, “Automatic Inspection of Gas Pipeline Welding Defects Using an Expert Vision System,” Nondestructive Testing and Evaluation: An International Journal, Vol. 37, No. 4, 2004, pp. 301-307.
- T. Saravanan, S. Bagavathiappan, J. Philip, T. Jayakumar and B. Raj, “Segmentation of Defects from Radiographic Images by the Histogram Concavity Threshold Method,” Insight, Vol. 49, No. 10, 2007, pp. 578-584. doi:10.1784/insi.2007.49.10.578
- S. S. L. Eong, Z. Samad, M. M. Ratnam and M. A. Khalid, “Weld Extraction from Digitized Radiographs Using Graphical Analysis of Weld Intensity Profiles,” Journal of Technology, Vol. 45, No. D, 2006, pp. 167- 180.
- J. Zapata, R. Vilar and R. Ruiz, “An Adaptive-NetworkBased Fuzzy Inference System for Classification of Welding Defects,” Nondestructive Testing and Evaluation: An International Journal, Vol. 43, No. 3, 2010, pp. 191-199.
- R. Vilar, J. Zapat and R. Ruiz, “Classification of Welding Defects in Radiographic Images Using an ANN with Modified Performance Function,” Springer Berlin, Heidelberg, 2009, pp. 284-293.
- J. Zapata, R. Vilar and R. Ruiz, “Automatic Inspection System of Welding Radiographic Images Based on ANN Under a Regularisation Process,” Journal of Nondestructive Evaluation, Vol. 31, No. 1, 2012, pp. 34-45
- H. Kasban, O. Zahran, H. Arafa, M. El-Kordy, S. M. S. Elaraby and F. E. A. El-Samie, “Welding Defect Detection from Radiographic Image Using Cepstral Approach,” Nondestructive Testing and Evaluation: An International Journal, Vol. 44, No. 2, 2011, pp. 226-231.
- H. Kasban, “Applying Advanced Digital Signal Processing Techniques in Industrial Radioisotopes Applications,” Ph.D. Thesis, Faculty of Electronic Engineering, Menofia University, Shibin Al Kawm, 2012.
- D. Coltuc, P. Bolon and J. M. Chassery, “Exact Histogram Specification,” IEEE Transactions on Image Processing, Vol. 15, No. 5, 2006, pp.1143-1152. doi:10.1109/TIP.2005.864170
- I. Frosio and N. A. Borghese, “Statistical Based Impulsive Noise Removal in Digital Radiography,” IEEE Transactions on Medical Imaging, Vol. 28, No. 1, 2009, pp. 3- 16. doi:10.1109/TMI.2008.922698
- T. W. Liao, D. M. Li and Y. M. Li, “Extraction of Welds from Radiographic Images Using Fuzzy Classifiers,” Informatics and Computer Science: An International Journal, Vol. 126, No. 1-4, 2000, pp. 21-42.
- M. A. Carrasco and D. Mery, “Segmentation of Welding Defects Using a Robust Algorithm,” Materials Evaluation, Vol. 62, No. 11, 2004, pp. 1142-1147.
- O. Zahran, H. Kasban, F. E. A. El-Samie and M. ElKordy, “Power Density Spectrum for the Identification of Residence Time Distribution Signals,” Applied Radiation and Isotopes, Vol. 70, No. 11, 2012, pp. 2638-2645. doi:10.1016/j.apradiso.2012.05.006
- W. B. Collis, P. R. White and J. K. Hammond, “HigherOrder Spectra: The Bispectrum and Trispectrum,” Mechanical Systems and Signal Processing, Vol. 12, No. 3, 1998, pp. 375-394. doi:10.1006/mssp.1997.0145
- M. G. Kang, K.-T. Lay and A. K. Katsaggelos, “Phase Estimation Using the Bispectrum and Its Application to Image Restoration,” Optical Engineering, Vol. 30, No. 7, 1991, pp. 976-985. doi:10.1117/12.55893
- J. F. McAloon, “Comparison of Higher Order Moment Spectrum Estimation Techniques,” M.Sc. Thesis, Electrical Engineering, University of South Florida, Tampa, 1983.
- N. Nafaâ, D. Redouane and B. Amar, “Weld Defect Extraction and Classification in Radiographic Testing Based Artificial Neural Networks,” 15th WCNDT, Roma, 2000. http://www.ndt.net/article/wcndt00/papers/idn575/idn575.htm
- E. S. Amin, “Application of Artificial Neural Networks to Evaluate Weld Defects of Nuclear Components,” Journal of Nuclear and Radiation Physics, Vol. 3, No. 2, 2008, pp. 83-92.
- C. M. Bishop, “Neural Networks for Pattern Recognition”, Clarendon Press, Oxford, 1995.
- J. Starck, F. Murtagh and A. Bijaoui, “Image Processing and Data Analysis: The Multiscale Approach,” Cambridge University Press, Cambridge, 1998. doi:10.1017/CBO9780511564352
- P. Gravel, G. Beaudoin and J. A. De Guise, “A Method for Modeling Noise in Medical Images,” IEEE Transactions on Medical Imaging, Vol. 23, No. 10, 2004, pp. 1221-1232. doi:10.1109/TMI.2004.832656
- J. Harikiran, B. Saichandana and B. Divakar, “Impulse Noise Removal in Digital Images,” International Journal of Computer Applications, Vol. 10, No. 8, 2010, pp. 39- 42.
- P. R. Deshmukh and M. V. Sarode, “Reduction of Speckle Noise and Image Enhancement of Images Using Filtering Technique,” International Journal of Advancements in Technology, Vol. 2, No. 1, 2011, pp. 30-38.
- R. J. Ferrari and R. Winsor, “Digital Radiographic Image Denoising via Wavelet-Based Hidden Markov Model Estimation,” Journal of Digital Imaging, Vol. 18, No. 2, 2005, pp. 154-167. doi:10.1007/s10278-004-1908-3