Journal of Service Science and Management
Vol.6 No.2(2013), Article ID:33181,7 pages DOI:10.4236/jssm.2013.62017
Study on Validity of Logistics Risk Early Warning Model in Manufacturing Enterprises: Based on the Listed Corporation of Manufacturing Industry in Beijing Area*
![]()
School of Business, Beijing Wuzi University, Beijing, China.
Email: bjwylys@sina.com, 287765628@qq.com, mawenjie_2007@sohu.com
Copyright © 2013 Yongsheng Liu et al. This is an open access article distributed under the Creative Commons Attribution License, which permits unrestricted use, distribution, and reproduction in any medium, provided the original work is properly cited.
Received February 24th, 2013; revised March 25th, 2013; accepted April 3rd, 2013
Keywords: Manufacturing Enterprise; Enterprise Logistics Risk; Principal Components Analysis; Risk Early Warning; Validity
ABSTRACT
In order to formulate the logistics risk early warning model of listed corporations of manufacturing industry in Beijing area, 40 A-stock listed companies of manufacturing enterprise in Beijing area are taken as the study samples, the principal components analysis method is applied to the logistics risk index of Sample Firms in 2009-2011 for extracting principal components to achieve simplified indicators. The validity of the constructed model is tested, the strengths and limitations of the early warning model are analyzed and the ways to improve the validity of the early warning model are proposed.
1. Introduction
Enterprise logistics risk is the influence of uncertainty facing enterprise logistics systems on enterprise expected target, including various risks concealed in the exercise of logistics functions and the organization of logistics activities, etc. [1]. As the owner of cargos, manufacturing enterprises risk damage and loss; As the owner of the plant, equipment and other production materials, manufacturing enterprises risk inefficient use of the assets; As the contractor for the sale of goods, manufacturing enterprises are faced with the liability for breach of contract risk, which might result inaccurate or delayed delivery. Early warning and control of logistics risk is of vital significance to enterprise risk management. Enterprises should establish the logistics risk early warning model according to their own actual conditions, then check the logistics risk and discover the potential risk of logistics so as to take effective measures to prevent the logistics risk and then avoid losses as much as possible. Howeveras it relates to the company’s operation and management of data, and data is not easy to obtain, there are some difficulties in the detection of enterprise logistics risks [2]. At present, the literature on enterprise logistics risk early warning research is very few, Q. Cheng (2010) [3] presented an early warning management method and model of logistics service operating risks, and discussed the content and requirement of early warning management, and established the frame of early warning index system of logistics service operating risks. W. Y. Duan (2010) [4] established the enterprise reversion logistics risk early warning system, established the enterprise reverse logistics risk early warning model using the MATLAB toolbox, and proved the BP neural network is suitable completely to the enterprise reverse logistics risk early warning model. Z. Cheng et al. (2010) [5] studied logistics equilibrium early warning control of Steel Corporation Industrial Port, introduced early warning method to implement early warning for inventory of raw materials with the objective of logistics equilibrium and regarding the inventory of raw materials of industrial port as coupling points of internal raw materials supply logistics. optimized interior logistics organization of Steel Corporation Industrial Port through a high-limit warning to promote the priority of mixing ratio and a lowlimit warning to draw the front ship unloaded. Y. S. Liu et al. (2012) [6] put forward the basic approach to the designing of early warning indicators system for logistics risk based on process of enterprise operation, designed the early warning indicator system for logistics risk based on process of enterprise operation on the basis of the seven elements, which are respectively environment risk, market risk, supply logistics risk, production logistics risk, sale logistics risk, recycle logistics risk and overall logistics risk, and analyzed the specific early warning indicators.
Based on the above analysis, the study is based on the financial reports of listed companies of manufacturing industries in Beijing, selecting a series of logistics risk evaluation index. The principal component analysis method is used and follows the enterprise logistics risk warning model. A comprehensive evaluation of the logistics risk of listed companies of manufacturing enterprise in Beijing area is conducted, testing the effectiveness of early warning model and then the ways to improve the effectiveness of the early warning model is put forward.
2. Theoretical Composition of the Evaluation System of Enterprise Logistics Risk Early Warning
At present, in the researches literature on enterprise logistics risk warning, the establishment of the index system does not have a unified standard, and targets selected by scholars in the research are different. This paper, based on the research of enterprise logistics risk early warning and enterprise logistics performance evaluation, considered the indicators of relevance, comprehensiveness and feasibility. According to the financial reports, we combined with the listed corporation logistics practical and determined the risk early warning index system of logistics, as shown in Table 1 [2,7].
The indicator system is a comprehensive reflection of the profitability of the enterprise logistics, cost efficiency and inventory management efficiency. To reflect the profitability of the enterprise logistics,four indicators are selected: main business profit rate, investment rate of return, return on assets and the rate of return on net assets. These indicators reflect the operating results of enterprises and the overall vitality and development of the enterprise. To some extent, these indicators show the effect of the enterprise logistics operation as a whole. The larger the index value is, the better overall enterprise logistics operation is, hence lower risk, and vice versa. Operating expense ratio is selected to reflect the efficiency of enterprise logistics costs. Operating expense ratio used to indirectly reflect the efficiency of transport and logistics costs. The larger the index value is, the lower logistics cost efficiency is, the greater the corresponding logistics risk is; Five indicators are selected to reflect the corporate logistics inventory management efficiency: Inventory turnover, inventory ratio, inventory devaluation proportion, proportion of stock merchandise, inventory of raw materials ratio. Inventory turnover not only reflect the effect of the production and sales, but also warehouse utilization efficiency and inventory management capabilities. More quickly Inventory turn-over is, the lower occupancy levels of inventory is, the stronger the liquidity is, which means the speed of inventory into cash or receivables become faster. Inventory ratio reflects the enterprise stock funds accounted for the proportion of total assets, less inventory means less capital occupied, which can bring more money to the production and development of enterprises. If a company inventory is more, there will be many disadvantages: for example, the inventory will occupy a large number of enterprise funds and cover the disadvantages of production and management. Enterprise's ability to adapt to the market is relatively weak and the corresponding logistics risk will be greater. Proportion of stock merchandise, inventory of raw materials ratio are mainly embodied in enterprise inventory of goods and raw materials in the proportion of the total inventory and mainly reflecting the stock structure of the enterprise which can reflect the enterprise logistics performance. The greater the proportions of these two are, the worse logistics performance is, the greater the risk of corresponding logistics is.
3. Construction of Enterprise Logistics Risk Early Warning Model Based on Principal Component Analysis
3.1. The Selection of Research Samples
The study sample data, in this paper, use mixed data of industry A shares of listing Corporation 40 manufacturing companies in Beijing area 2009-20111. Data are derived from the financial report of Beijing manufacturing industry listing Corporation which the huge influx of information network announced. Appendix at the end of the paper presents a list of sample companies, their code numbers, as well as the original financial ratios from 2009 to 2011. According to statistics, when the sample size is greater than or equal to 30, which is with sufficient representative power for total data set, the sample can support this research. We use Spss19.0 software to process and analyze data.
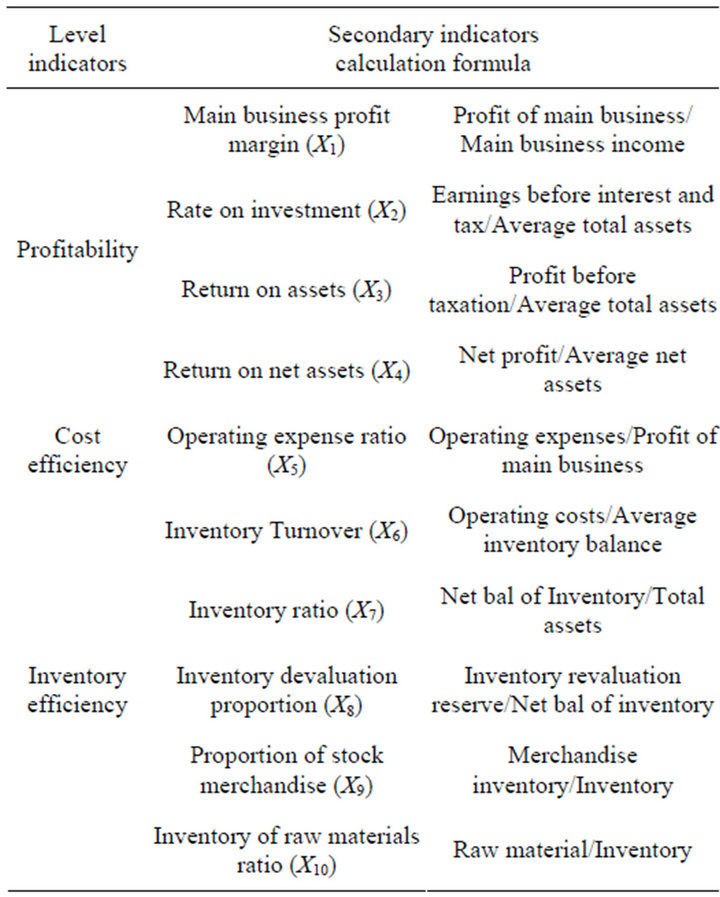
Table 1. Logistics risk early warning indicator system of listed companies in the manufacturing sector.
3.2. Principal Component Analysis
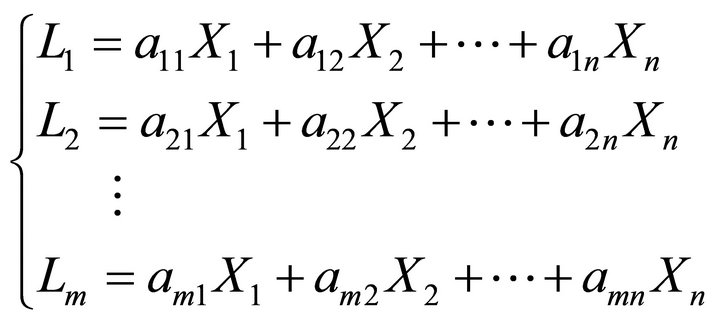
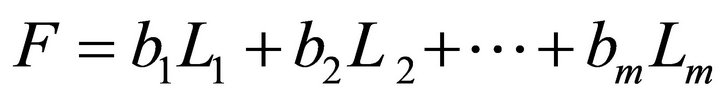
Principal component analysis is also known as principal component analysis which refers to the multiple indicators into few independent comprehensive indexes. That is to say, through principal component analysis, we express multiple indexes of actual with the few potential indexes, namely linear combination of principal component to represent original variable, which simplify the index and will be conducive to a more accurate analysis of the purpose of the study [7]. Equation (1) and Equation (2) are the general model of principal component analysis.
 (1)
(1)
 (2)
(2)
In the above formula, Xj is each indicator variable, Li is the extracted each principal component; aij is the factor loading, the greater the factor loading is, then the greater the degree of indicator variables associated with the main component is; bi is the i-th principal component contribution rate; the F indicates enterprise logistics risk prediction score.
3.3. Application of Principal Component Analysis
Because of the above eleven indicators, from different sides and different extent, reflect the logistics risk information in a company, and there is a correlation between these indicators. Therefore, we use Spss13.0 to 40 companies logistics risk indicator for processing, synthetic new comprehensive index, namely extraction principal component [8]. The method of reverse index positive process is that minus sign before the raw data in the reverse indicator, in this paper indicators which need positive process are: the main business profit rate, investment rate of return, return on assets, rate of return on net assets and inventory turnover rate. To test whether sample data is appropriate for principal component analysis, first of all we calculated KMO statistics and Bartlett spherical inspection (we put 40 companies 2009-2011 three years average logistics risk early warning index as calculating data), the results are shown in Table 2. Table 2 shows that the KMO > 0.5, Bartlett test statistic corresponding significant probability is 0.000, it is suitable for factor analysis.
In applying SPSS to process the selected 40 companies’ average logistics risk early warning index from 2009 to 2011, we calculate eigenvalue and contribution rate of each of the main component, and the results are shown in Table 3. We select the first four principal components which contain 89.212% of the original index information content (cumulative contribution rate). After maximizing variance rotation, the contribution rates of the four main components are 41.554%, 25.849%, 11.677% and 10.133%. The factor loading matrix and factor score coefficient matrix of 4 principal component factors are shown in Tables 4 and 5. Table 4 shows, in principal component 1, loadings of X1, X2, X3 and X4 are more obvious and concentrated, which mainly represents the profitability of enterprise logistics. The principal component 1 is the factor for logistics risk warning profitability; In the principal component 2, loadings (absolute value) of X6, X9 and X10 are significantly greater than other indicators, which mainly represents the enterprise inventory management efficiency. The principal component 2 is the factor for the logistics risk warning inventtory management efficiency; In principal component 3,
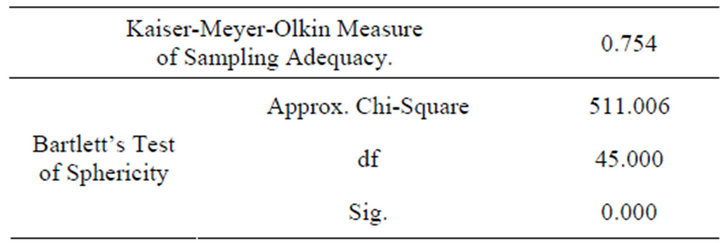
Table 2. KMO and Bartlett’s test.
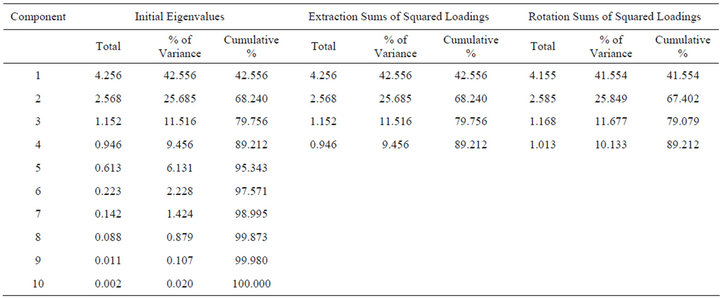
Table 3. Principal component eigenvalues and the contribution rate of the logistics risk early warning index.
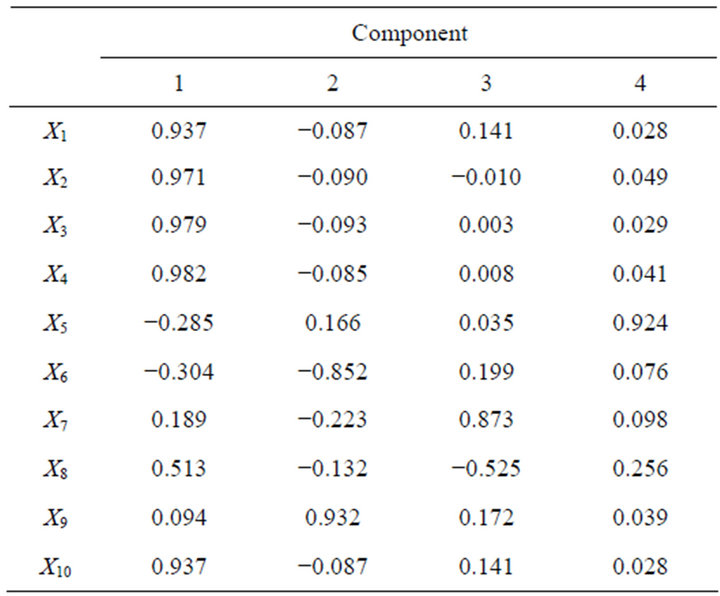
Table 4. Factor loading matrix.
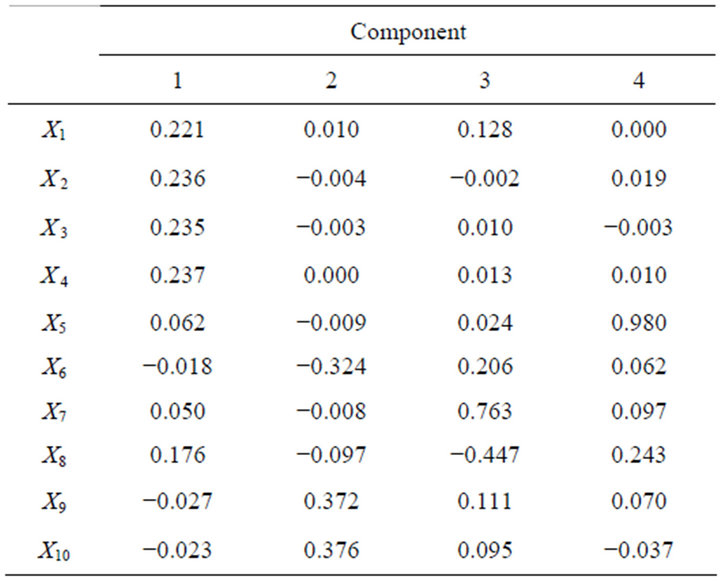
Table 5. Factor score coefficient matrix.
loadings of X7 and X8 are significantly greater than other indicators, which mainly represents the enterprise merchandise inventory value. The principal component 3 is the factor for logistics risk warning inventory value of goods; In the principal component 4, the load of the X5 is 0.924, far higher than other index, which represents the enterprise logistics cost efficiency. The principal component 4 is the factor for the logistics cost efficiency of logistics risk warning.
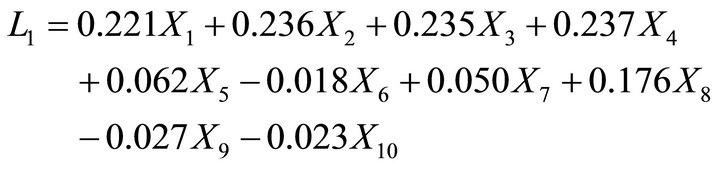
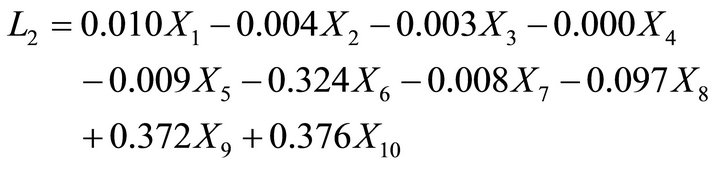
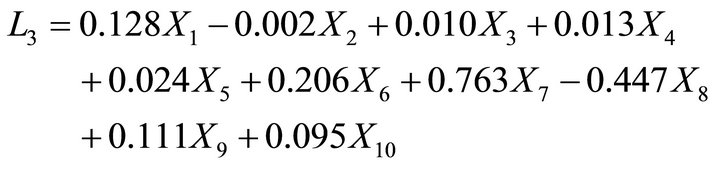
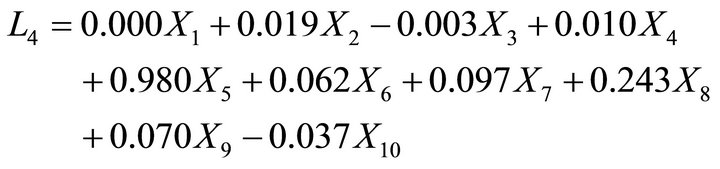
According to Table 5, we can get the principal component (L) linear formula about the logistics risk warning index. Equations (3)-(6) are the formula we got.
 (3)
(3)
 (4)
(4)
 (5)
(5)
 (6)
(6)
X1-X10, in the above expression, are standardized variables whose original indexes are after a mean of 0 and standard deviation of 1. According to rotated principal component factor contribution rate in Table 3, we can get a comprehensive evaluation formula of manufacturing listed companies in logistics risk warning. Equation (7) is the formula we got.
 (7)
(7)
L1 represents the profitability factor; L2 stands for inventory management efficiency factor; L3 represents the inventory value factor; L4 represents the cost of logistics efficiency factor.
4. The Logistics Risk Early Warning Model Effectiveness Test
4.1. Determination of Critical Value
According to the average value of 2009-2011 logistics risk early warning index, we calculated the comprehensive evaluation value (F) of logistics risk early warning index of Beijing area manufacturing listed Corporation. The results are shown in Table 6.
In order to directly predict different logistics risk, here we learn from the national monitoring early-warning practices, take the light signal display method, with the green, yellow light, red and black light signal to said respectively [5]. Therefore, F values, in Table 6, are classified by “quartering” method, we get three critical value: −0.19037, 0.00130, 0.24500. In this paper, we have defined the company whose integrated logistics risk evaluation scores ranked in the bottom 25% as “logistics risk serious” company. Therefore, if a listing Corporation’s F value is greater than 0.24500, then its logistics risk serious.
In order to directly predict different logistics risk, here we learn from the national monitoring early-warning practices, take the light signal display method, with the green, yellow light, red and black light signal to said respectively [9]. Therefore, F values, in Table 6, are classified by “quartering” method, we get three critical value: −0.18942, 0.06563, 0.29811. In this paper, we have defined the company whose integrated logistics risk evaluation scores ranked in the bottom 25% as “logistics risk serious” company. Therefore, if a listing Corporation’s F value is greater than 0.29811, then its logistics risk serious.
4.2. The Model Effectiveness Test
According to comprehensive evaluation model of the logistics risk warning based on an average of the three years of data, after we standardized original index of 2011 sample listed companies, we use EXCEL to calculate the F value of the sample listed companies in 2011. The F value rankings are shown in Table 7.
We can see from the Table 7, there are 11 listing corporations whose F values greater than 0.24500 in 2011, they are: Beiren Printing Machinery Holdings Lim-
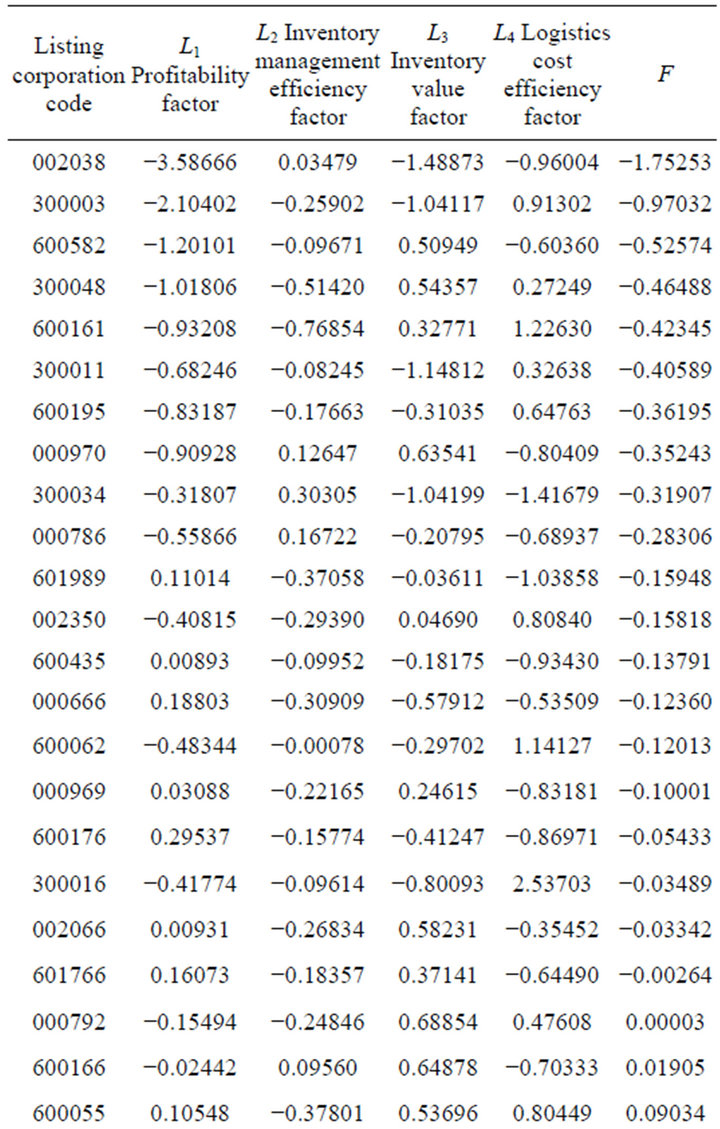
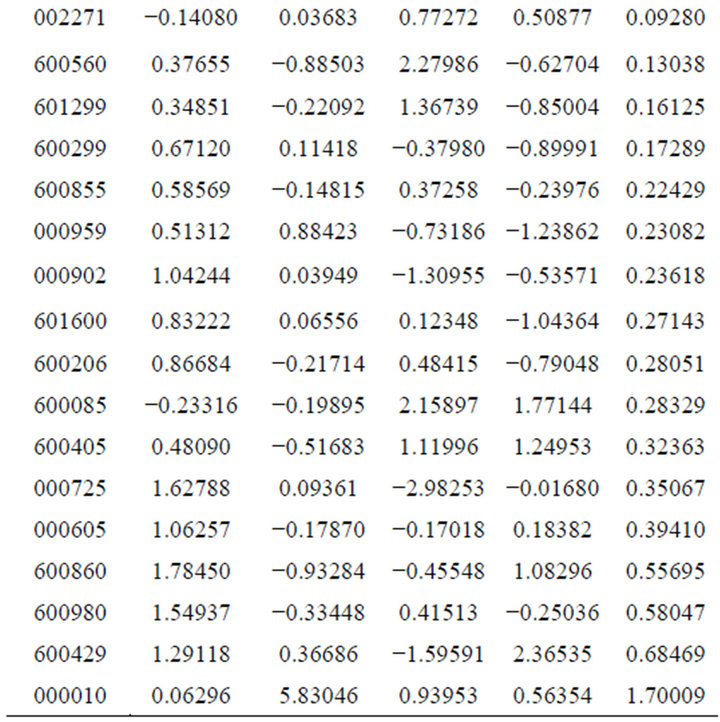
Table 6. The comprehensive evaluation value (F) of logistics risk early warning index of manufacturing listed company in Beijing area.
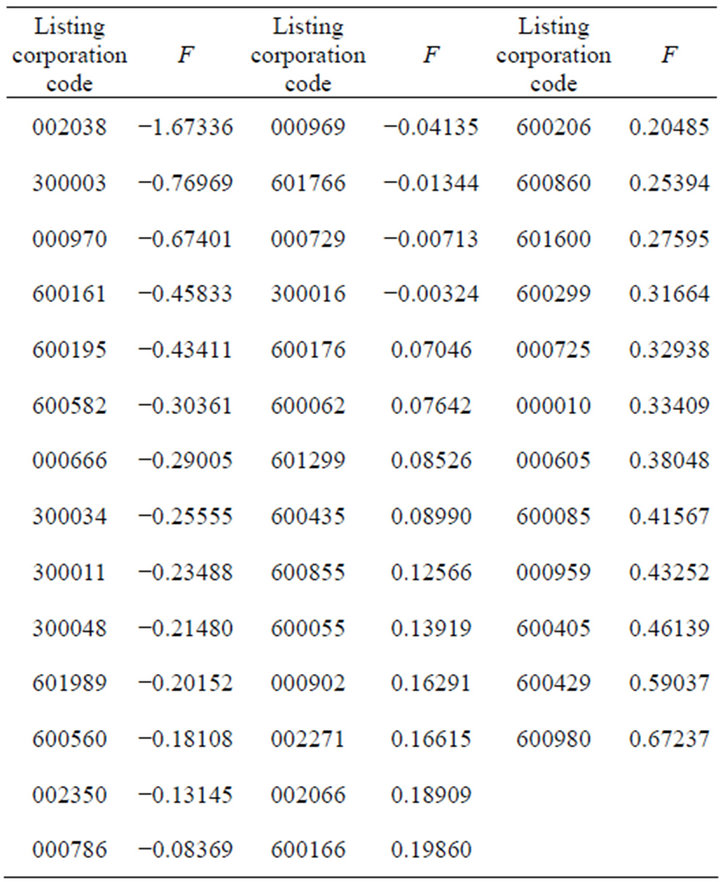
Table 7. 2011 sample listed company F value ranking.
ited (600860), Aluminum Corporation Of China Limited (601600), Blue Star New Chemical Materials Co., Ltd. (600299), BOE Technology Group Co., Ltd. (000725), Beijing Shenhuaxin Co., Ltd. (000010), Sihuan Pharmaceutical Co., Ltd. (000605), Beijing Tongrentang Co., Ltd. (600085), Beijing Shougang Co., Ltd. (000959), Beijing Dynamic Power Co., Ltd. (600405), Beijing Sanyuan Foods Co., Ltd. (600429), BGRIMM Magnetic Materials & Technology Co., Ltd. (600980). F value of the remaining 29 is less than 0.24500.
In order to test the effectiveness of the model, we define that, if positive logistics risk warning index in the industry ranking is after 3/4 or reverse logistics risk warning index in the industry ranking is after 1/4, the indicators show “logistics risk serious”; If there are 4 or more logistics risk warning indicators show “logistics risk serious”, we then identified the listed companies as a “logistics risk serious” company. According to the 2011 data, we calculated the sample listing Corporation logistics risk warning indicators. The results are shown in Table 8.
It is seen from Table 8, in 29 Sample Firms which is “non-logistics risk serious” company according to the F value determination, there are 3, according to the judgment principles, will be judged as “logistics risk serious” company, the error rate is 10.34%; 11 sample companies which have been judged to be “logistics risk serious” company according to F value, 1 of them will be deter-
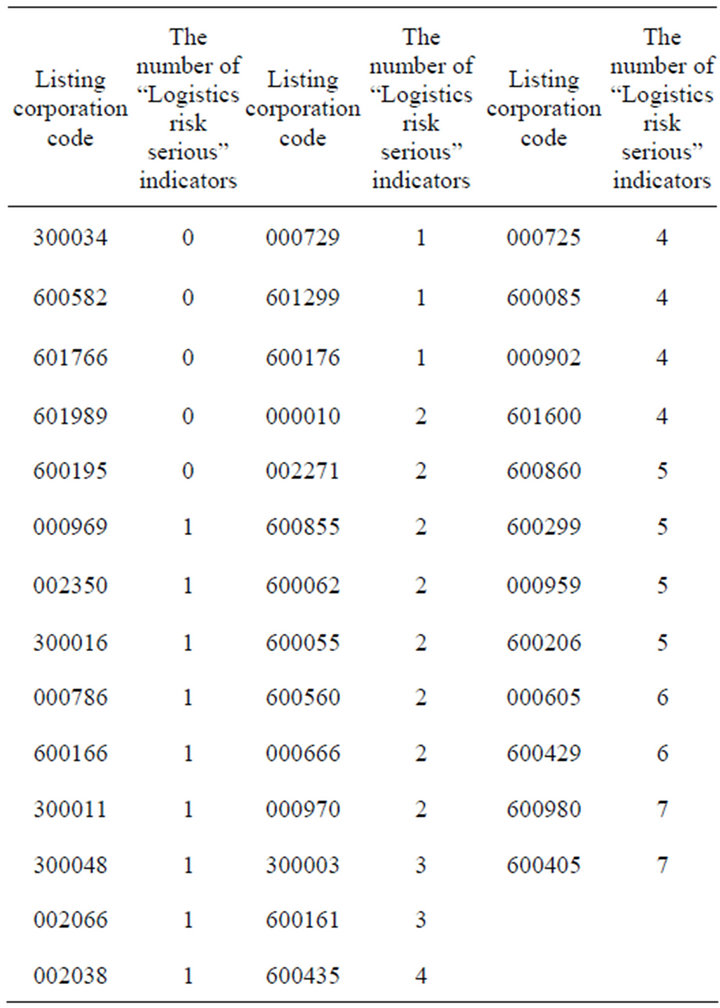
Table 8. The results of logistics risk early-warning indicators of the samples listed companies in 2011.
mined, according to the above judgment principles, as “non-logistics risk serious” company, the error rate is 9.09%. The overall error rate is 10.00%. The accuracy rate of the model prediction is 90.00%, and this shows that the early warning model obtained in this paper can judge accurately to the logistics risk status of listing corporation.
4.3. The Overall Evaluation of the Model
4.3.1. The Advantage of the Model
In this paper, an early warning model for logistics risk of listed companies of manufacturing industry in Beijing is formulated. The method of principal component analysis with the help of Spss13.0 is used to analyze the early warning indicators of enterprise logistics risk, simplifying the early warning indicators of enterprise logistics risk, extracting the principal components, and finally scoring the logistics risk warning index of manufacturing industry listed corporations in Beijing. This paper also reflects the risk status of the overall listed corporations of manufacturing industry in Beijing, providing new ideas and methods for manufacturing enterprises to carry out the logistics risk warning.
4.3.2. Limitations of the Model
First of all, the variables selected are based on the indicators in the financial reports, and those of non-financial indicators are not selected. Therefore the model failed to reflect the influence of non-financial factors of enterprise logistics risk status. Secondly, critical point of division with certain subjectivity needs to summarize and consummate constantly in practice. Third, logistics risk warning in practice, combination of quantitative and qualitative methods is needed. Limited to financial reporting data, the paper failed to combine qualitative methods and early warning model.
5. Ways to Improve the Effectiveness of Enterprise Logistics Risk Early Warning Model
In order to formulate effective risk early warning model for enterprise logistics, firstly, more data should be collected as samples. Even if the sample is not sufficient, we have to make the sample data as sufficient as possible so as to get a more accurate prediction. Secondly, when samples are sufficient, categorization of specific industry, which eliminate the influence of industry difference of logistics risk warning model, is to be considered [10]. Thirdly, on the basis of investigation, an appropriate number of non-financial nature logistics risk indicators is needed so as to reflect the actual situation of enterprise logistics operation comprehensively and objectively. Fourthly, imitation of the stock listing rules of the measures for special treatment of abnormalities of listed corporations stock trading which the abnormal financial condition or other conditions is to be used, so as to clarify the standard of “abnormal condition of enterprise logistics” company and offer reference for the definition of “logistics risk serious”. Fifthly, in practice, the critical non-quantitated factors should be considered and combination of qualitative analysis and early warning model for enterprise logistics risk warning is necessary.
6. Conclusion
In this paper, the principal component analysis method was used in the logistics risk warning empirical research for manufacturing industry listed companies in Beijing area. A statistical analysis on the logistics risk data of 2009-2011 is carried out and a principal component analysis model of manufacturing industry listed corporations logistics risk warning is composed based on a three-year average data. Finally, based on our 2011 listing Corporation data, the validity of the model is tested, and the results show that the model has good warning effect. Although the model is in need of further improvement, a new method for manufacturing industry listed corporations is provided. At the same time, this model can also provide reference for the non-listed manufacturing companies in the logistics risk warning.
REFERENCES
- Y. S. Liu, “Research on Early Warning of Enterprise Logistics Risk Based on Supply Chain Management,” Intellectual Property Press, Beijing, 2010, p. 3.
- L. Wang, “Enterprise Logistics Performance Evaluation and Benchmarking Study Based on the Financial Statements,” Master’s Degree Thesis, Chongqing Jiaotong University, Chongqing, 2008.
- Q. Cheng, “Study on Logistics Service Operating Risks and Its Early Warning Management,” Journal of Wuhan University of Technology (Social Science Edition), Vol. 23, No. 5, 2010, pp. 636-640.
- W. Y. Duan, “Research on the Early-Warming Management of Enterprise Reverse Logistics System,” Master’s Degree Thesis, Daqing Petroleum Institute, Daqing, 2010.
- Z. Cheng and P. Zhang, “Study on Logistics Equilibrium Early Warning Control of Steel Corporation Industrial Port,” 2010 IEEE International Conference on Advanced Management Science, Chengdu, 9-11 July 2010, pp. 572- 574.
- Y. S. Liu, Y. Liu and H. Liu, “ Design of Early Warning Indicator System in Logistics Risk Based on Operation Process of Enterprise,” The 11th National Annual Symposium on Industrial Technology of Economic Management Institutions, Education and Research Press, Hong Kong, 2012, pp. 33-37.
- K. R. Liu and Y. Mi, “Shanxi Province Listed Companies' Financial Early Warning Model Based on Principal Components Analysis,” Science Economy Society, Vol. 28, No. 4, 2010, pp. 88-93.
- X. H. Liu, “The Necessity and the Software Realization Data Positive Treatment in Factor Analysis,” Journal of Chongqing Institute of Technology (Natural Science), Vol. 23, No. 9, 2009, pp. 152-155.
- Y. Z. Yang, Y. G. Wang and H. L. Duan, “The Construction of Risk Early Warning System of Commercial Banks in China,” Economic Science Press, Beijing, 2006, p. 145.
- X. Y. Pan, “Research on the Effectiveness of Financial Crisis Early Warning Model Based on EVA,” The Financial Times, No. 8, 2008, pp. 35-36.
NOTES
*This work is supported by Project supported by the Philosophy and Social Science Planning of Beijing (Grant No. 11JGB053) and Project supported by Academic Human Resources Development in Institutions of Higher Learning under the Jurisdiction of Beijing Municipality (PHR (IHLB)) under (Grant No. PHR2012).
1Wind Information Co., Ltd: By the end of December 31, 2011, Beijing area has a total of 195 A-share listing companies, including 57 manufacturing listed companies. There are 40 manufacturing industry listing companies which have three or more years of financial reporting data.