Journal of Biomedical Science and Engineering
Vol.7 No.6(2014), Article ID:45815,8 pages DOI:10.4236/jbise.2014.76036
Does Resampled Image Data Offer Quantitative Image Quality Benefit for Pediatric CT?
Nancy L. Ford1, Angjelina Protik2, Paul Babyn3, Karen Thomas4
1University of British Columbia, Vancouver, Canada
2Ryerson University, Toronto, Canada
3University of Saskatchewan, Saskatoon, Canada
4The Hospital for Sick Children and University of Toronto, Toronto, Canada
Email: nlford@dentistry.ubc.ca
Copyright © 2014 by authors and Scientific Research Publishing Inc.
This work is licensed under the Creative Commons Attribution International License (CC BY).
http://creativecommons.org/licenses/by/4.0/


Received 5 April 2014; revised 6 May 2014; accepted 13 May 2014
ABSTRACT
Acquiring CT images with thin slices can improve resolution and detectability, but cause an increase in the image noise. To compensate for the additional image noise, the kVp or mA can be increased, which carries a dose penalty to the patient. We investigate the image quality achieved in MPR images reformatted from different slice thicknesses 0.625 mm and 5 mm, to determine if a thicker slice could be resampled to smaller thickness with minimal loss of image information. Catphan®600 phantom was imaged using selected kVp/mA settings (80 kVp/250 mA, 100 kVp/ 150 mA and 120 kVp/200 mA) to generate slices with thicknesses of 0.625 mm and 5 mm using a GE Discovery HD750 64-slice CT scanner to investigate the impact of the acquisition slice thickness on the overall image quality in MPRs. Measurements of image noise, uniformity, contrast-tonoise ratio (CNR), low contrast detectability and limiting spatial resolution were performed on axial and coronal multiplanar reformatted images (MPRs). Increased noise, reduced contrast-tonoise ratio, and improved limiting spatial resolution and low contrast detection were observed in 2 mm coronal MPRs generated with 0.625 mm thin slices when compared to the MPRs from 5 mm thick slices. If the 2 mm coronal MPRs acquired with 5 mm slices are resampled to 0.6 mm slice thickness, the reductions in limiting resolution and low contrast detection are compensated, although with reduced uniformity and increased image noise. Thick slice image acquisitions yield better CNR and less noise in the images, whereas thin slices exhibited improved spatial resolution and low contrast detectability. Retrospectively resampling into thinner slices before obtaining the coronal MPRs provided a balance between image smoothness and identifying fine image detail. Which approach provides the optimal image quality may also depend on the imaging task, size and composition of the features of interest, and radiologist preference.
Keywords:Paediatric CT, Image Quality, Multiplanar Reformats (MPR), Collimation

1. Introduction
Advances in CT technology have resulted in its increased use for a multitude of diagnostic tasks in both adult and paediatric patients [1] . A major innovation in CT evolution was the introduction of multislice CT scanners (MSCT), which replaced a single row of large detectors with multiple rows of smaller detectors, enabling faster scanning [2] , reduced section collimation and substantially increasing the potential length of the patient scanned per gantry rotation. The scan time reduction diminished the need for sedation of paediatric patients that was previously necessary in order to decrease motion artifacts. These scanners also enabled larger volume coverage and acquisition of thinner image slices with nearly isotropic voxels, enabling the production of high quality images in the coronal, sagittal and axial planes. Choosing the appropriate slice thickness for a certain diagnostic task is very important [3] since it influences the sensitivity of lesion detection, spatial resolution and image noise in addition to affecting radiation dose to the patient.
In MSCT the slice thickness is defined by detector configuration and not X-ray beam collimation [4] . Increasing the beam width (collimation) will cover a larger area and reduce the required number of rotations and scan time. In MSCT the actual X-ray beam is wider than the detector to ensure uniform X-ray coverage across all detectors; however, this increases patient dose since some X-rays do not strike the detector or contribute to the image. With increased number of detector rows this penumbra overlap decreases due to the wider beam in z-direction. A thicker beam width includes most of the detectors in z-direction, decreases the penumbra effect and enhances the dose efficiency. Conversely, a narrower (thin) beam width results in a greater penumbral effect, known as overbeaming, and, therefore, a higher radiation dose is delivered to the patient. However, thin slices provide images with higher resolution compared to images acquired with thicker slices.
One advantage of MSCT using thin slices is the ability to produce high quality multiplanar reformats (MPRs) which are useful in a wide variety of clinical applications, including for example assessing blood vessels; evaluating extent of bowel and mesentery involvement from disease; investigating tumor metastasis burden, etc. Coronal and sagittal MPRs are particularly helpful in evaluating longitudinally orientated structures such as the spine and kidneys, the aorta and its branches. To generate MPR reformats with high image quality, it is desirable to start with a stack of axial images that have isotropic spatial resolution (approximately equal resolutions in the x, y, and z directions). MPR reformats from thinner slices, where the slice thickness is roughly equal to the inplane resolution [5] , demonstrating better visibility of fine structures compared to MPRs from thicker slices.
In this study, we investigate the image quality achieved in MPR images reformatted from different slice acquisition thicknesses (0.625 mm and 5 mm), to determine if a thicker slice could be resampled to smaller thickness with minimal loss of image information, as this may allow users to reduce kVp or mA and so achieve dosesavings to the patient. The specific aim for this experiment was to compare the image quality between axial slices and 2 mm coronal MPRs generated from 0.625 mm and 5 mm slice thickness data and to determine if resampling images acquired at 5 mm slice thickness into thinner slices can maintain the desired image quality.
2. Materials and Methods
To test our hypothesis, phantom images were acquired with thick 5 mm slice thickness and with thin 0.625 mm slice thickness and the image quality was assessed in the axial images (5 mm thickness) and in coronal MPRs (2 mm thickness). The images acquired with 5 mm slice thickness were also retrospectively resampled to 0.625 mm slice thickness and reformatted to 2 mm coronal MPR images. Images acquired with the thinner slices (0.625 mm) were stacked to produce 5 mm axial MPRs. Image quality was assessed in the MPRs for image noise, contrast-to-noise ratio, low contrast detectability and limiting spatial resolution.
2.1. Imaging Protocol
All imaging was performed on a DiscoveryTM CT750HD (GE Healthcare, Milwaukee WI, USA) multislice CT scanner utilizing a CT image quality phantom (Catphan®600, The Phantom Laboratory, Salem NY, USA). The data was acquired at three selected kVp/mA settings (80 kVp/250 mA, 100 kVp/150 mA and 120 kVp/200 mA) to reflect some typical kVp and mA settings used clinically for pediatric torso imaging at a large pediatric teaching hospital. The remaining scanning parameters were kept constant (pitch = 1.375, 0.5 s per rotation, detector width = 40 mm, acquisition field of view (FOV) adjusted for small body, display FOV (DFOV) = 250 mm, standard reconstruction algorithm). The full length of the Catphan®600 phantom was scanned at each setting using thin (0.625 mm) and thick (5 mm) acquisition slice thicknesses and reformatted to generate images in the axial and coronal planes.
From the 5 mm thick slices we generated axial slices (5 mm AX5 mm) and coronal MPRs with 2 mm slice thickness (2 mm COR5 mm). The acquired 5 mm thick slices were also retrospectively resampled to 0.625 mm slice thickness to generate 2 mm thick coronal MPRs (2 mm COR5 mm-resampled). From the data acquired with 0.625 mm slice thickness, we generated 5mm displayed axial slices (5 mm AX0.6 mm) and 2 mm thick coronal MPRs (2 mm COR0.6 mm).
2.2. Image Quality Analysis
Image J (version 1.43 u; National Institutes of Health, Bethesda, MD, USA) was used for viewing the images and for analysis of image noise, low contrast detectability, contrast-to-noise ratio and limiting spatial resolution. Lab-based code written in Matlab® (verson 7.7, The MathWorks, Inc., Natick, MA) was used for the spectral analysis measurement of the Noise Power Spectra (NPS).
Image noise was evaluated using the uniformity module. Five circular regions of interest (ROIs) measuring approximately 90 mm2 were located at the centre and periphery of the phantom in 3 separate slices of the uniformity module. The standard deviation was measured in each of the 15 ROIs and the average value reported as the image noise. Noise Power Spectrum (NPS) analysis was performed with our own MATLAB®7.7 code developed following the methods described by Boedeker et al. [6] . From each slice in the uniformity module a centered 128 × 128 square matrix ROI was isolated. To improve the accuracy and account for statistical uncertainties, the 2D NPS was calculated and averaged over all 60 slices from the uniform module and radially averaged to produce a 1D NPS.
Uniformity: To illustrate the signal variation across the phantom, a radial signal profile was taken through the center of the cylindrical phantom in a uniform acrylic section. The CT number samples along the diameter of the phantom are plotted versus position to show the radial signal uniformity.
Contrast to Noise Ratio (CNR) was measured on the low contrast module consisting of circular objects ranging from 2 mm to 15 mm in diameter and with a contrast of 0.3%, 0.5% or 1.0% compared to the background material. The ROI was placed on the largest low contrast object and the mean CT number recorded. A ROI of the same size was selected from the background and the mean CT number and standard deviation recorded. The contrast to noise ratio is given in Equation (1):
 (1)
(1)
where HUobject is the mean CT number in the object, HUbackground is the mean CT number in the background and SDbackground is the standard deviation in the background.
Low Contrast Detectability (LCD) was measured using the same low contrast module. The ability to distinguish between the object and the background is limited by object size and image noise. LCD measurements were reported as the diameter of the smallest target object that could be observed at each contrast level.
Limiting Spatial Resolution: Subjective assessment of the limiting resolution was made with the bar-pattern module by finding the smallest visible repeating pattern. A line was drawn on the smallest resolvable pattern, its length in cm was recorded and the number of line pairs was counted. The results were reported in lp/cm.
3. Results
The choice of X-ray tube parameters (kVp and mA) did not impact the image quality assessments reported in this study. Although the measured noise and contrast were affected by the tube parameters, the trends when comparing the different acquisition slice thicknesses did not change.
Image Noise: Images generated from 5 mm thick slice acquisitions (5 mm AX5 mm and 2 mm COR5 mm) were less noisy compared to images obtained with thin 0.625 mm slice thickness (5 mm  and 2 mm
 ), as expected (Figure 1). The 5 mm AX5 mm show on average 20% and 2 mm COR5 mm 65% less noise with 5 mm thick slices compared to the noise in corresponding images obtained with 0.625 mm thin slices. Resampling the thick slice acquisition (5 mm) to a thinner slice (0.625 mm) resulted in an increase in noise in the 2 mm COR MPRs to levels similar to those derived originally from thin slices.
In Figure 2, the data acquired using 120 kVp/200 mA is displayed as representative for NPS illustration purposes. The NPS analysis confirms the decrease in image noise for all spatial frequencies. In our technique the direct current (DC) component was eliminated from the NPS calculation by subtracting the mean pixel value of the isolated square ROI from each pixel in the ROI, which was not sufficient to completely remove the electronic noise leaving a peak in the low frequency region in the NPS plot (Figure 2). To eliminate this peak completely a noise image should be subtracted from another noise image acquired by the same detector row as suggested by Boedeker et al. (6), which requires acquisition of two images at same start angle of gantry for each series. The subtraction without controlling for the start angle (as well as detector row) could not remove the structured noise completely.
Uniformity: The uniformity was maintained in the axial and coronal images acquired with 0.625 mm thin or 5 mm thick slices. The maximum deviation between central and peripheral ROIs was less than 5 HU with each scanning technique. The radial signal uniformity in the images acquired at 80 kVp - 250 mA with 5 mm and 0.625 mm slices is illustrated in Figure 3. The kVp/mA setting was chosen as a representative for the nosiest images (with the highest standard deviations and the widest range of CT#) in this experiment. The pixel-to-pixel signal variations in the axial images (5 mm) at 80 kVp - 250 mA for 5 mm thick slice acquisitions are within 79 HU, and for 0.625 mm thin slice acquisitions are within 204 HU. The results from the radial plots confirmed that 5 mm axial images generated from 5 mm thick slices are more uniform and exhibit improved radial uniformity by 61% (125 HU) in comparison to 0.625 mm thin slices. The 2 mm COR5mm from 5 mm slices have better uniformity by 70% (70 HU) compared to 2 mm COR0.6 mm from 0.625 mm slices (Figure 3). The 2 mm  from 5 mm thick slices then retrospectively resampled at 0.625 mm have 21% (20 HU) better radial uniformity compared to 2 mm COR0.6 mm from 0.625 mm thin slices.
Contrast-to-Noise Ratio: The results of the contrast-to-noise ratio (CNR) assessment are graphically presented in Figure 4. For both the axial and coronal planes, the images obtained with 5 mm thick slices exhibited better CNR than those obtained with 0.625 mm thin slices (53% improvement for coronal and 23% improvement for axial). Resampling the 5 mm thick slice images to thinner slices (0.625 mm) and producing 2 mm COR images resulted in a reduction in CNR to a level only 6% improved compared to direct 0.625 mm acquisition coronal images.
Low contrast detectability assessment shows that images (5 mm AX0.6 mm and 2 mm COR0.6 mm) generated from thin collimation (0.625 mm slices) have better LCD compared to those with thick collimation (5 mm slices). Retrospectively resampling the thick slices to thinner slices showed improved LCD in the 2 mm  images but poorer LCD than 2 mm COR0.6 mm made directly from initial 0.625 mm AX slices (Figure 5). The LCD plot illustrates the smallest detectable diameters for each contrast level represented in the phantom. Choosing one contrast level of interest (0.3%, 0.5% or 1%), the plot of the MPR line of interest inter-
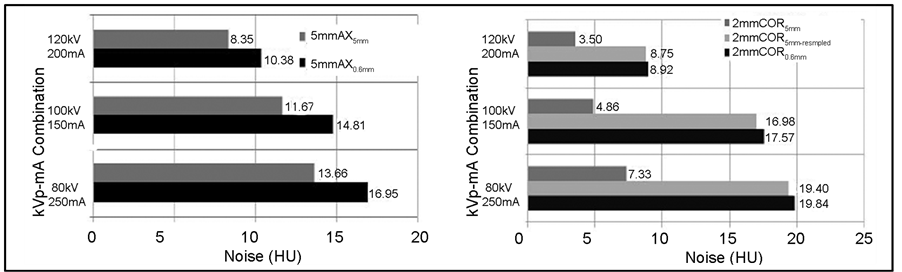
Figure 1. Noise measurements (standard deviations) measured in MPRs generated from 0.625 mm thin slices and 5 mm thick slices acquired with three different kVp/mA settings.
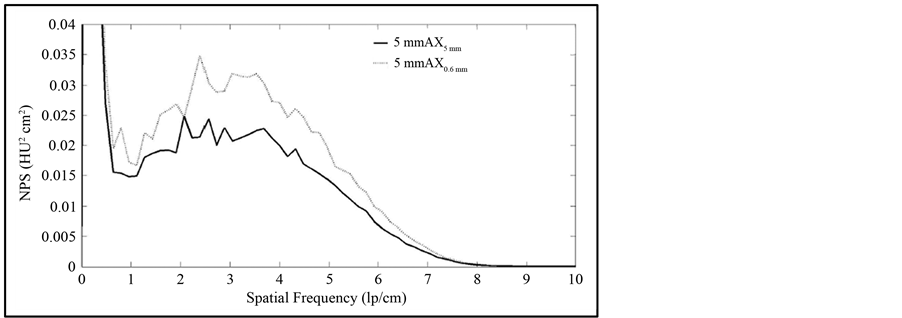
Figure 2. Noise power spectra plots for 5 mm axial images from 0.625 mm thin slices (AX0.6 mm) and from 5 mm thick slices (AX0.5 mm) acquired at 120 kVp and 200 mA.
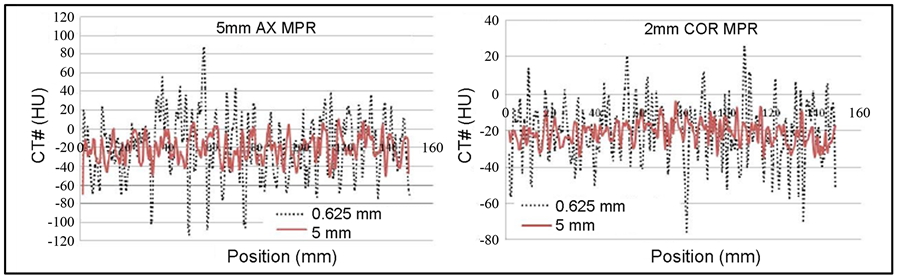
Figure 3. Mean CT number fluctuations for images acquired at 80 kVp - 250 mA, with the 5 mm axial images on the left and the coronal 2 mm MPR images on the right. The legend for both graphs shows the images acquired with 0.625 mm thin slices (dashed line) and acquired with 5 mm thick slice (solid line).

Figure 4. Contrast-to-noise ratio for 5 mm axial and 2 mm coronal MPRs generated from 0.625 mm and 5 mm slice thicknesses at three kVp/mA settings.
sects the y-axis at the smallest diameter detectable at the chosen contrast level. The ideal LCD is defined as the capability to detect the smallest low contrast object (in our case 2 mm circle) at all contrast levels. This will show as straight line parallel to the contrast level axis and intersecting the diameter axis at 2 mm.
Limiting spatial resolution was assessed with the bar pattern method, a subjective method. Averaged results in lp/cm are presented in Figure 6. As expected, both the axial and coronal images exhibited better resolution when obtained with thin slices (0.625 mm) compared to thick slices (5 mm). In the coronal plane, retrospectively resampling the thick images to 0.6 mm before reformatting to 2 mm COR resulted in an improvement in
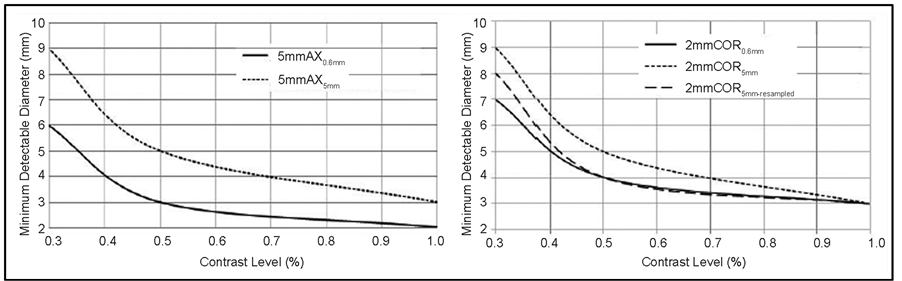
Figure 5. Low contrast detectability measured in 5 mm axial images (left) and 2 mm coronal MPRs (right) from 0.625 mm thin slices and 5 mm thick slices acquired with 120 kVp and 200 mA.
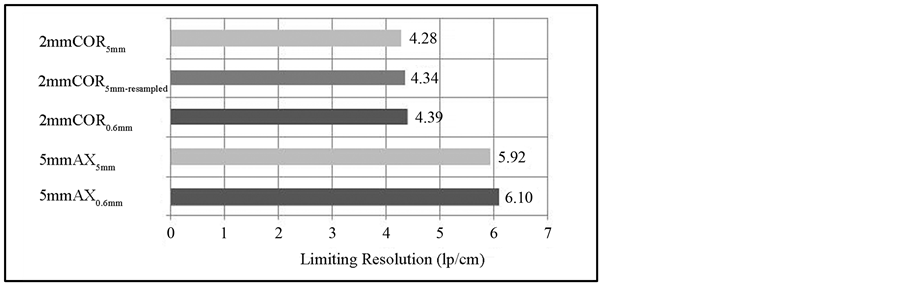
Figure 6. Comparison of the limiting spatial resolution measurements (in lp/cm) observed with the bar pattern method for different collimations in axial and coronal MPRs.
the spatial resolution; however, this improvement in resolution was not equivalent to obtaining a 2 mm COR from a thin slice acquisition (0.625 mm).
4. Discussion
Within each of the three experimental kVp/mA settings, all other technical parameters were kept constant apart from slice thickness, therefore representing a constant radiation dose to a patient. The images obtained with 0.625 mm thin slices exhibited improved spatial resolution and low contrast detectability, but with increased image noise, and reduced uniformity and contrast to noise ratio when compared with images obtained with 5 mm thick slices. This trend was observed for both the direct axial images and the MPR reformatted 2 mm coronal images, as expected. Resampled images exhibited image quality that was intermediate between the thin and thick slice acquisitions.
The image quality parameters noise, uniformity and contrast to noise ratio all depend on the photon counting statistics at the detector. For thick slice acquisitions (5 mm), we expect more photons to be counted at the detector, decreasing the quantum mottle, which we measured as standard deviation in ROIs in the image. The NPS analysis provides valuable information on noise texture and low frequency noise characteristics. Our tests confirmed improvements in noise variance/randomness in both axial and coronal MPRs acquired with 5 mm collimation (5 mm AX5 mm and 2 mm COR5 mm) when compared to MPRs acquired with 0.625 mm slice thickness (5 mm AX0.6 mm and 2 mm COR0.6 mm). The uniformity of CT numbers is also improved in the MPRs composed from thicker slices. Smaller standard deviations measured in the image imply smaller fluctuations in the mean values of the CT numbers, which we assessed with radial signal profiles. Images acquired with 5 mm collimation demonstrated improved contrast-to-noise ratios due to the reduced image noise.
The limiting resolution and low contrast detectability are related to the pixel size in the acquired images, where the smaller pixels provide improved resolution and detectability of small objects. Images derived from the 0.625 mm thin slices exhibited improved low contrast detectability and limiting spatial resolution in the axial and coronal MPR images (5 mm AX0.6 mm and 2 mm COR0.6 mm) compared with those acquired at 5 mm slice thickness (5 mm AX5 mm and 2 mm COR5 mm). The low contrast test objects were more easily visualized for the images acquired with the 0.625 mm thinner slices. For each contrast level, smaller targets were better visualized for the thin slice collimation in both axial and coronal reformatted images (5 mm AX0.6 mm and 2 mm COR0.6 mm) than for images acquired at 5 mm slice thickness (5 mm AX5 mm and 2 mm COR5 mm). MPRs generated from thinner (0.625 mm) slices theoretically contain more information about the scanned phantom than MPRs composed of thicker slices (5 mm). Small objects that occupy less than one voxel can be visualized despite increased noise when a narrow image thickness is used due to increased contrast as the voxel size decreases [7] and reduced partial volume effects [8] [9] . Thicker 5 mm slices are also prone to an increased number of scattered photons, which could further contribute to the image blurriness. The voxel spacing of thinner slices is almost isotropic which improves the z-axis resolution (along the length of a patient), as assessed by coronal MPRs in our study. The 2 mm COR0.6 mm MPRs from 0.625 mm slices demonstrate the best z-axis limiting resolution (Figure 6). The in-plane resolution assessed in 5 mm AX0.6 mm also demonstrated better limiting resolution if generated from thinner 0.625 mm AX slices compared to 5 mm AX5 mm composed from 5 mm slices.
In this study, we also investigated the possibility of resampling the images acquired with 5 mm thick collimation to thinner 0.6 mm slices as a means of improving the spatial resolution and low contrast detection limits in the coronal MPRs. The low contrast detectability and limiting spatial resolution in the coronal plane in the resampled images was nearly equivalent to the MPR images acquired with 0.625 mm thin slices. The resampled images exhibited noise, uniformity and contrast-to-noise ratios intermediate between the thick slice and thin slice acquisitions. By acquiring the images with thick slices and resampling to thinner slices, the image quality in the coronal plane can be maintained with spatial resolution and low contrast detection similar to the thin acquisitions, but with improved noise, uniformity and contrast-to-noise ratio. Depending on the imaging task, the resampling demonstrated here may be useful in clinical practice. In addition, if the radiologist is agreeable to having a small increase in the image noise, the kVp and/or mA settings could be further reduced to achieve dose-savings to the patient.
To mitigate the increased noise from dose reduction strategies, most manufacturers offer advanced image processing or image reconstruction algorithms to improve the appearance or smoothness of low dose images. In this study, we did not alter the tube settings (and therefore the radiation dose) between the different acquisitions, nor did we implement advanced image reconstruction or image processing algorithms. However, the DiscoveryTM CT750HD (GE Healthcare, Milwaukee WI, USA) multislice scanner offers the ASiRTM iterative reconstruction algorithm. We have previously measured the impact of the ASiRTM algorithm on image quality using a variety of X-ray tube parameters used in pediatric abdominal scans [10] . Our initial testing used the same image quality phantom (Catphan®600, The Phantom Laboratory, Salem NY, USA) imaged with 0.625 mm slice thickness and we reformatted the images into 0.6 mm and 5 mm axial views and 2 mm coronal MPRs. The results of our previously published study showed the image noise, uniformity and contrast-to-noise ratio were improved with the ASiRTM algorithm, but under certain circumstances, the spatial resolution and low contrast detection limits were mildly degraded [10] . In pediatric imaging, the diagnostic task must be carefully assessed to determine if increased noise, or a loss of spatial resolution or low contrast detectability is acceptable in clinical practice to reduce the radiation dose to the patient.
In pediatric CT imaging, there is a well-defined need for low radiation doses to the patient, as the pediatric population is more sensitive to radiation damage and has a long expected life-span post-irradiation [11] . The need to minimize the dose for this population is clear and using a larger slice thickness (5 mm) coupled with a reduced kVp and/or mA setting can result in a reduced dose. However, due to the smaller size of pediatric patients and their tissue composition, the ability to visualize the abnormal tissue can be quite challenging, and may require higher spatial resolution for diagnostic confidence. The concept of resampling the image data at a different slice thickness to improve image quality [12] has been applied in clinical practice and may be beneficial in reducing the radiation dose for pediatric patients. In this study, we provide an objective and quantitative assessment of the resulting image quality to demonstrate the benefits of resampling the scan data. Further reductions in image noise may also be achieved through the use of additional filters during resampling or iterative reconstruction algorithms, which are beyond the scope of this study. Additional work will be needed to extend our phantom study to clinical practice, including end-user assessment and consideration of diagnostic task and patient size.
5. Conclusion
Our phantom study investigated the image quality of axial and coronal images acquired with different collimation thicknesses over a specific range of kVp and mA used in pediatric torso imaging. Images obtained using thicker collimation exhibited improved noise, uniformity and contrast-to-noise ratio, whereas those obtained using thinner collimation had better low contrast detectability and limiting spatial resolution. Depending on the needs of the radiologist and the diagnostic task, there are advantages to either imaging approach. For many pediatric imaging tasks, thin slice acquisition would provide the improved spatial resolution and low contrast detection desired for imaging small patients, and with emerging iterative reconstruction techniques, the image noise could be improved with no additional radiation dose to the patient. Resampling 5 mm thick slice acquisitions to 0.6 mm slices and then producing 2 mm coronal MPRs improved the spatial resolution but with a moderate noise penalty.
Acknowledgements
The authors acknowledge Nancy Padfield for operating the CT scanner, Chris Gordon for use of the Catphan phantom, and financial support from the Natural Sciences and Engineering Research Council (NSERC) and the Hospital for Sick Children.
References
- Brenner, D., Elliston, C., Hall, E., et al. (2001) Estimated Risks of Radiation-Induced Fatal Cancer from Pediatric CT. American Journal of Roentgenology, 176, 289-296. http://dx.doi.org/10.2214/ajr.176.2.1760289
- Valentin, J. (2007) Managing Patient Dose in Multi-Detector Computed Tomography (MDCT). ICRP Publication, 102. Annals of ICRP, 37, 1-79.
- Dalrymple, N.C., Prasad, S.R., Freckleton, M.W., et al. (2005) Informatics in Radiology (infoRAD): Introduction to the Language of Three-Dimensional Imaging with Multidetector CT. Radiographics, 25, 1409-1428. http://dx.doi.org/10.1148/rg.255055044
- Goldman, L.W. (2007) Principles of CT: Radiation Dose and Image Quality. Journal of Nuclear Medicine Technology, 35, 213-225. http://dx.doi.org/10.2967/jnmt.106.037846
- Kalra, M.K., Maher Mm Fau-D’Souza, R., D’Souza R Fau-Saini, S., et al. (2004) Multidetector Computed Tomography Technology: Current Status and Emerging Developments. Journal of Computer Assisted Tomography, 28, S2-S6.
- Boedeker, K.L., Cooper, V.N. and McNitt-Gray, M.F. (2007) Application of the Noise Power Spectrum in Modern Diagnostic MDCT: Part I. Measurement of Noise Power Spectra and Noise Equivalent Quanta. Physics in Medicine and Biology, 52, 4027-4046. http://dx.doi.org/10.1088/0031-9155/52/14/002
- Wedegartner, U., Lorenzen, M., Nagel, H.D., et al. (2004) Image Quality of Thinand Thick-Slice MSCT Reconstructions in Low-Contrast Objects (Liver Lesions) with Equal Doses. Rofo, 176, 1676-1682.
- Glover, G.H. and Pelc, N.J. (1980) Nonlinear Partial Volume Artifacts in X-Ray Computed Tomography. Medical Physics, 7, 238-248. http://dx.doi.org/10.1118/1.594678
- Plewes, D.B. and Dean, P.B. (1981) The Influence of Partial Volume Averaging on Sphere Detectability in Computed Tomography. Physics in Medicine and Biology, 26, 913-919. http://dx.doi.org/10.1088/0031-9155/26/5/011
- Protik, A., Thomas, K., Babyn, P. and Ford, N.L. (2012) Phantom Study of the Impact of Adaptive Statistical Iterative Reconstruction (ASiR™) on Image Quality for Paediatric Computed Tomography. Journal of Biomedical Science and Engineering, 5, 793-806.
- Sorantin, E., Weissensteiner, S., Hasenburger, G., et al. (2013) CT in Children—Dose Protection and General Considerations When Planning a CT in a Child. European Journal of Radiology, 82, 1043-1049. http://dx.doi.org/10.1016/j.ejrad.2011.11.041
- Lell, M.M., May, M., Deak, P., et al. (2011) High-Pitch Spiral Computed Tomography: Effect on Image Quality and Radiation Dose in Pediatric Chest Computed Tomography. Investigative Radiology, 46, 116-123. http://dx.doi.org/10.1097/RLI.0b013e3181f33b1d