Journal of Cancer Therapy
Vol. 4 No. 1 (2013) , Article ID: 27789 , 7 pages DOI:10.4236/jct.2013.41019
Acuros XB Algorithm vs. Anisotropic Analytical Algorithm: A Dosimetric Study Using Heterogeneous Phantom and Computed Tomography (CT) Data Sets of Esophageal Cancer Patients
![]()
1Department of Radiation Oncology, Arizona Center for Cancer Care, Peoria, USA; 2Department of Medical Physics, ProCure Proton Therapy Center, Oklahoma City, USA; 3Premiere Oncology, Fort Myers, USA.
Email: *suresh.rana@gmail.com
Received December 4th, 2012; revised January 5th, 2013; accepted January 13th, 2013
Keywords: Acuros XB; AAA; Esophageal Cancer; Heterogeneity Correction
ABSTRACT
Our purpose in this study was to assess the dosimetric impact of the Acuros XB algorithm (AXB), in comparison with Anisotropic Analytical Algorithm (AAA) calculations, for esophageal cancer treatment plans created with RapidArc technique. First, we performed a phantom study by comparing the percent depth dose (PDD) calculated by AXB and AAA against the measured PDD in a slab phantom containing a 2 cm air gap thickness. Second, we performed a clinical study using a computed tomography (CT) data set from 10 esophageal cancer patients. The treatment plans calculated by AXB and AAA were evaluated for planning target volume (PTV) coverage, doses to the PTV and organs at risk (OARs). Dose calculations by the AXB and AAA were done for identical beam parameters. The AXB showed better agreement (within ±0.5%) with measurements than did the AAA (−4.9% to −6.2%). In comparison to the AAA, the AXB predicted a higher maximum PTV dose (2.0%), but lower mean (1.1%) and minimum (2.5%) PTV doses as well as reduced PTV coverage (9.1%). The averaged mean doses to all OARs predicted by the AXB were lower (up to 3.6%), and the percentage of lungs volume receiving at least 20 and 5 Gy were lower by about 3.6% in the AXB plans compared to the AAA plans. The AXB is more accurate than the AAA for dose predictions when air medium is involved. The use of AXB is more likely to avoid dose overestimation or underestimation for the esophageal cancer treatment plans compared to AAA.
1. Introduction
The treatment of esophageal cancer traditionally involves a combination of chemotherapy and radiation therapy [1]. The goal of radiation therapy of esophageal cancer is to deliver a conformal dose distribution to the target while minimizing the dose to the critical structures such as lungs, heart, liver and spinal cord. RapidArc (Varian Medical Systems, Palo Alto, CA) is a type of volumetric modulated arc therapy (VMAT) technique which delivers modulated radiation beams with simultaneous adjustment of multi-leaf collimator (MLC) field aperture, dose rate and gantry rotation speed [2]. The RapidArc treatment planning for esophageal cancer is challenging because the target is close to the spinal cord and is surrounded by the lungs, a radiosensitive organ that has low radiation tolerance. One of the major components of the modern treatment planning system (TPS) is the dose calculation algorithm that can compute the radiation doses accurately ensuring higher tumor coverage and lower normal tissue toxicity. The International Commission on Radiation Units (ICRU) recommends that the dose to be delivered with an error of less than 5% [3]. This implies that each step such as dose calculation and machine calibration needs to be performed to an accuracy of better than 5%. The accuracy for the dose calculation step should be of the order of 2% - 3% [4].
Currently, there are wide varieties of dose calculation algorithms commercially available for clinical radiation treatment planning; however, due to the differences in their beam modeling approach, discrepancies in their dose predictions exist, especially in the presence of a low density medium such as air. This provides a challenge for the TPS to predict the dose for an esophageal target, where the lateral-scatter conditions are different from those in water-equivalent tissues. At Arizona Center for Cancer Care, we use the Anisotropic Analytical Algorithm (AAA) in the Eclipse TPS (Varian Medical Systems, Palo Alto, CA) for dose calculations of patient treatment plans, and we are currently introducing a commercially available new dose calculation algorithm called the Acuros XB algorithm (AXB) implemented within the Eclipse TPS. The AXB is considered to be similar to classic Monte Carlo (MC) methods for accurate modeling of the dose deposition in heterogeneous media [5-7]. The AXB solves numerically the Linear Boltzmann Transport Equation (LBTE) which describes the macroscopic behavior of radiation particles as they travel through and interact with the matter [5]. By contrast, the AAA is an analytical photon dose calculation algorithm based on a pencil beam convolution-superposition technique [8,9].
Several authors have studied the dosimetric impact of the AXB by using MC simulations [5,6,10-12], experimental measurements [12-14], and real computed tomography (CT) datasets of patients for nasopharyngeal [12], breast [15] and lung [16] cases. The MC method and experimental studies [5,6,10-14] showed that the AXB is more accurate than the AAA when inhomogeneous media are involved. Authors of clinical studies [12,15,16] reported that, in comparison to the AAA, the AXB could improve the dose estimation in the dose plans computed for actual treatment of patients. Although previous studies involving MC simulations and measurements have shown that the AXB is superior to the AAA in predicting doses in the presence of heterogeneous media [5,6, 10-14], it is essential further to evaluate the accuracy of the AXB by performing dose calculations for clinical patient treatment plans. Our purpose in this study was to assess the clinical dosimetric impact of the AXB, in comparison with well-known and validated AAA calculations, on the CT data sets of 10 esophageal cancer patients treated with the RapidArc technique.
2. Methods and Materials
All of the results presented in this study are based on the beam data for a 6 MV photon beam from Varian Clinac iX accelerator equipped with a Millennium 120 MLC (Varian Medical Systems, Palo Alto, CA).
2.1. Dose Calculation Algorithms
2.1.1. AAA
The beam model for the AAA includes separately modeled contributions from 1) bremsstrahlung photons due to interaction of the electron beam with the target and that do not interact with the linear accelerator head; 2) photons scattered in the flattening filter, primary collimators, and jaws; and 3) electrons created mainly by Compton interaction in the head of the linear accelerator and air [17-19]. The final dose is calculated by the convolution of the separately modeled contributions of the above mentioned three sources [17-19]. The tissue heterogeneity is handled by radiologic scaling of primary photons and photon scatter kernel scaling in lateral directions according to the local electron density [17-19]. For more detailed description on the AAA, readers are advised to refer to a publication by Tillikainen et al. [9].
2.1.2. AXB
The AXB implementation in the Eclipse TPS has two models. The first one is the multiple photon source model already implemented for the AAA [5,7]. The second one is the radiation transport model which allows calculation of the dose accounting for the elemental composition of specific anatomical regions as derived by the CT dataset [5,7]. For the AXB, the dose is reported either in dose-to-medium (Dm) or dose-to-water (Dw) mode. The detailed explanation for Dm and Dw calculation options for the AXB have been described in the previous publiccations [5,13]. Because the AXB explicitly solves for radiation transport in materials, the default dose reporting mode in the AXB is Dm, and we selected Dm for all of the AXB calculations in this study. For more detailed description on the AXB, readers are advised to refer to a publication by Vassilev et al. [5].
2.2. Phantom Study
A rectangular heterogeneous phantom (30 × 30 cm2) with a 2 cm air gap thickness was created in the Eclipse TPS in order to simulate the experimental set-up (Figure 1). The top and bottom layers in the phantom were assigned an average Hounsfield (HU) number that was obtained by scanning of the solid-water blocks with a GE Lightspeed CT scanner, whereas the middle layer was assigned with an HU number equivalent to free air (i.e., HU = −1000). The central-axis depth doses were computed at points of interest (P1, P2, and P3) (Figure 1) with the AAA (version 10.0.26) and AXB (version 10.0.26) for 100 monitor units (MUs) with use of the identical beam set up. The dose computations were done for an open field size of 10 × 10 cm2 with use of a 2.5 mm calculation grid size.
For the experimental set up, a new phantom was created in the treatment room. Specifically, rectangular Styrofoam blocks (5 × 5 cm2) of 2 cm thickness were placed between a 5 cm thickness of rectangular solidwater material (30 × 30 cm2) above and a 15 cm thickness of rectangular solid-water materials (30 × 30 cm2) below. Next, 100 MUs were delivered to the phantom for the identical beam parameters that were used for dose
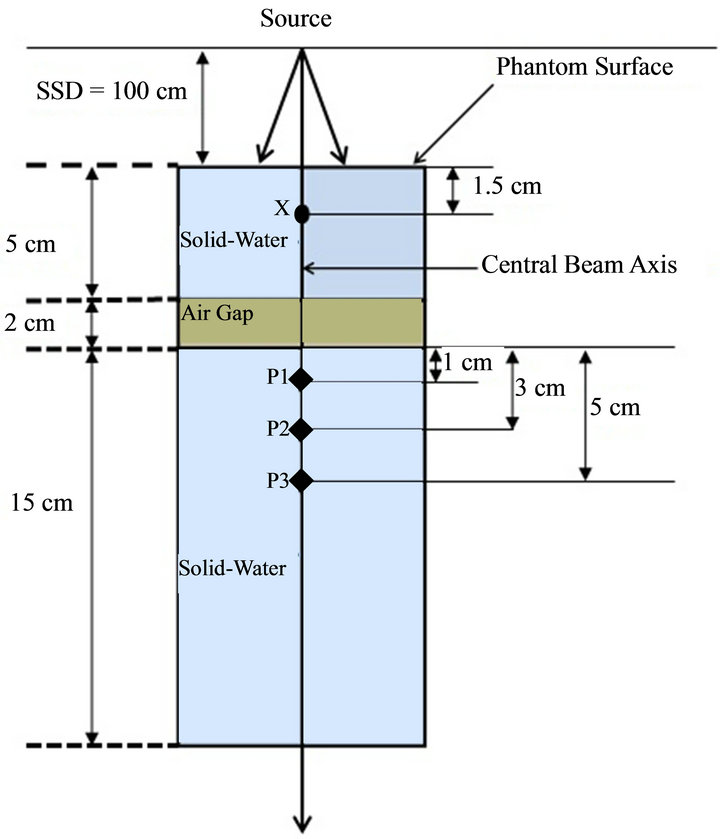
Figure 1. Schematic diagram of the experimental set-up for central axis depth dose computations and measurements in a heterogeneous rectangular slab phantom containing a 2 cm air gap between two solid-water materials. The central axis depth doses were compared in solid-water medium (third or bottom phantom layer) for selected points of interest (P1, P2, and P3). The normalization point is 1.5 cm proximal to the phantom surface and is marked with “X”.
computations by the AAA and AXB in the Eclipse TPS. A cylindrical ionization chamber (collecting volume 0.053 cm3) (Standard Imaging, Middletown, WI) was used for the measurements at points P1, P2, and P3, and the measurement at each point of interest was repeated three times to reduce the statistical uncertainty associated with the chamber measurements.
We then normalized the calculated (AAA and AXB) and measured doses to the value obtained at the normalization point, “X” (see Figure 1) in order to convert them to the percent depth dose (PDD). The difference (∆) between the calculated (AAA and AXB) PDDs and measured PDDs at each point of interest was obtained using Equation (1).
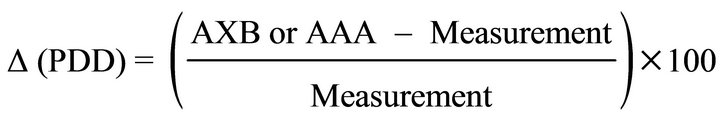 (1)
(1)
2.3. Clinical Study
2.3.1. Patients, CT Simulation, and Contouring
Ten esophageal cancer patients were selected for this retrospective study and all patients were treated at our Arizona Center for Cancer Care with external beam radiation therapy. The CT scans of all patients were acquired with 512 × 512 pixels at 0.25 cm slice spacing on a flat tabletop of a GE LightSpeed CT Scanner. All of the CT images were verified by the radiation oncologist before the transfer via computer network to the Eclipse TPS for subsequent contouring and planning purposes. The planning target volume (PTV) was created on the axial CT slices by application of a 5 mm wide isotropic expansion of the clinical target volume (CTV) to compensate for the variability of the treatment setup and for internal-organ motion. The organs at risk (OARs), such as the lungs (left and right), heart, liver, and spinal cord, were delineated based on the axial CT images.
2.3.2. Planning and Optimization
Ten esophageal cancer treatment plans were generated by use of the RapidArc technique with two arcs, one in a clockwise direction and the other in an anti-clockwise direction (Varian IEC scale). The beam parameters for all 10 esophageal cancer treatment plans were set up in the Eclipse TPS by use of the 6X mode of the 600 MU/min dose rate. The Beam’s-Eye-View graphics in Eclipse TPS was used for better selection of the field sizes of the coplanar arcs, with the objective of achieving a maximal PTV coverage and a minimal OAR dose. The isocenter of the treatment plans was placed at the center of the PTV, and all plans were inversely optimized such that at least 95% of the PTV received the prescription dose of 50.4 Gy in 28 fractions while OARs doses were kept below the dose limits provided in Table 1.
2.3.3. Dose Calculation
The final dose calculations of the optimized plans were performed with the AAA (version 10.0.26). Each calculated plan was then normalized such that 100% of the prescribed dose covered 95% of the PTV. The final patient
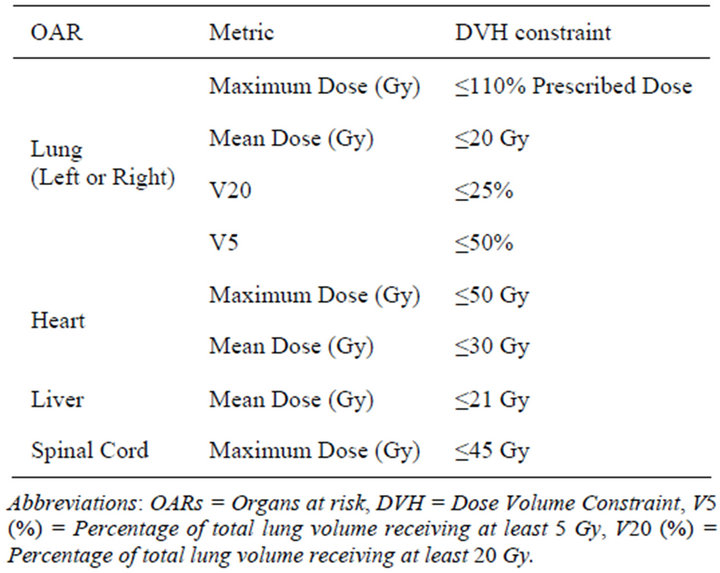
Table 1. Dose specification for OARs.
treatment plan generated after plan normalization was referred as the AAA plan. Next, for each patient, the AAA plan was copied and the AXB plan was generated by performance of a dose re-calculation on the AAA plan with AXB (version 10.0.26) for identical jaw settings, MLC leaf positions, and MUs as in the corresponding AAA plan. The calculation grid was set to 2.5 mm for all cases.
2.3.4. Plan Evaluation
The dose-volume histograms (DVH) of 20 esophageal cancer treatment plans (AAA and AXB) of 10 patients were generated in the Eclipse TPS for the PTV, total lung (i.e., sum of left and right lung), heart, liver and spinal cord. For the PTV, the maximum dose, mean dose, minimum dose, and percentage of the PTV covered by 100% of the prescribed dose (V100) was evaluated. For the total lung, the maximum dose, mean dose, and the percentage of the total lung volume receiving at least 5 and 20 Gy (V5 and V25) were compared. For the heart, liver and spinal cord, the maximum and mean doses were evaluated. For the purpose of comparison, the AAA plans were used as the standard, and the percent differences for the DVH parameters were calculated by use of Equation (2).
 (2)
(2)
In Equation (2), AXB and AAA represent the corresponding values of the evaluated DVH parameter in the AXB and AAA plans respectively for the same patient. The ∆avg. (%) means the difference in percentage averaged over all 10 patients. The statistical analysis was done by use of the paired two-sided Student’s t-test in a Microsoft Excel spreadsheet, and a P value of less than 0.05 (i.e., P < 0.05) was considered to indicate statistical significance.
3. Results
3.1. Phantom Study
Figure 2 shows the dose difference (Δ) in percentage between the calculated (AAA and AXB) and measured PDD data for measurement points, P1, P2 and P3 (see Figure 1) in the heterogeneous phantom containing a 2 cm thick air gap for an open field size of 10 × 10 cm2.
It is seen from Figure 2 that the AXB’s values had better agreement with the measurements at all measured points (P1, P2, and P3) than those of the AAA. Specifically, in comparison to measured doses, the AXB predicted doses within ±0.5%, whereas the AAA predicted doses from −4.9% to −6.2%.
3.2. Clinical Study
Figure 3 shows the ∆avg. (%) for the maximum dose to the PTV, total lung, heart, liver and spinal cord, and the values are averaged over the ten analyzed patients. A positive ∆avg. (%) means that the AXB’s prediction is higher than that of the AAA and a negative ∆avg. (%) means that the AXB’s prediction is lower than that of the AAA. A similar interpretation of ∆avg. (%) is applied for the results presented in Figures 4 and 5.
It is seen from Figure 3 that, in comparison to the AAA, the AXB predicted a higher maximum dose to the PTV and total lung by averages of 2.0% and 2.2% respectively, whereas the AXB predicted a lower maximum dose to the heart, liver, and spinal cord by averages

Figure 2. Dose difference (Δ) in percentage between the calculated (AAA and AXB) and measured PDD data for measurement points, P1, P2, and P3 (see Figure 1) in the heterogeneous phantom containing a 2 cm air gap for an open field size 10 × 10 cm2. (6 MV photon beam, 100 cm SSD, 100 MUs). Note: The ∆ (%) is defined in the Results section (see Equation (1)). Abbreviations: AAA = Anisotropic Analytical Algorithm, AXB = Acuros XB Algorithm.

Figure 3. The ∆avg. (%) for the maximum dose to the PTV, total lung, heart, liver, and spinal cord. The values are averaged over the ten analyzed patients. Note: The error bars represent the standard deviations. The ∆avg. (%) is defined in the Results section (see Equation (2)). Abbreviations: PTV = Planning Target Volume.

Figure 4. The ∆avg. (%) for the mean dose to the PTV, total lung, heart, liver, and spinal cord. The values are averaged over the ten analyzed patients. Note: The error bars represent the standard deviations. The ∆avg. (%) is defined in the Results section (see Equation (2)). Abbreviations: PTV = Planning Target Volume.
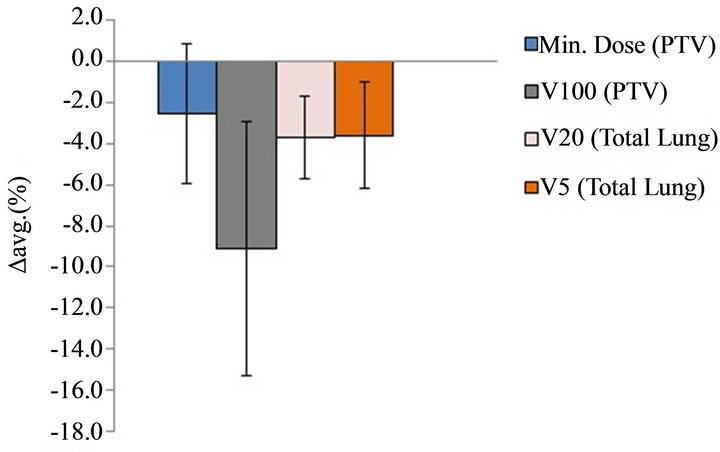
Figure 5. The ∆avg. (%) for the minimum dose to the PTV, V100 of PTV, as well as V20 and V5 of total lung. The values are averaged over the ten analyzed patients. Note: The error bars represent the standard deviations. The ∆avg. (%) is defined in Equation (2). Abbreviations: PTV = Planning Target Volume, Min. = Minimum, V100 = Percentage of PTV covered by 100% of the prescribed dose, V20 = Percentage of total lung volume receiving at least 20 Gy, V5 = Percentage of total lung volume receiving at least 5 Gy.
of 0.6%, 0.4%, and 1.7% respectively.
Figure 4 shows the ∆avg. (%) for the mean dose to the PTV, total lung, heart, liver, and spinal cord, and the values are averaged over the ten analyzed patients. In comparison to the AAA, the AXB predicted lower mean dose to the PTV, total lung, heart, liver, and spinal cord by averages of 1.1%, 3.6%, 2.0%, 1.8%, and 0.9% respectively.
Figure 5 shows the ∆avg. (%) for the minimum dose to the PTV, V100 of PTV, as well as V20 and V5 to the total lung, and the values are averaged over the ten analyzed patients. For the PTV, the minimum dose predicted by the AXB was lower by an average of 2.5% and the V100 predicted by the AXB was lower by an average of 9.1% when compared with the AAA results. For the total lung, the V20 and V5 values in the AXB plans were lower by averages of 3.7% and 3.6% respectively when compared with the corresponding values in the AAA plans.
4. Discussion
4.1. Phantom Study
The presence of an air gap between two solid-water materials causes the lateral spread of scattered radiation in it; hence there is a reduction in the scattered radiation reaching the measurement points downstream. Previous studies involving an air medium showed that the secondary build-up region occurred beyond air cavities in the interface region [6,11,17,19]. Higher dose discrepancies between the AAA’s results and the measurements seen in this study may be due to the AAA’s improper beam modeling of the scattered radiation contribution to the measurement points in the secondary build-up and builddown regions beyond the air gap.
Several researchers reported their observations similar to our findings, showing that the AXB was superior to the AAA in predicting doses beyond the air gap. Bush et al. [6] showed that the result of MC and AXB differed by up to 4.5%, whereas the difference between AAA and MC results was up to 13% in the secondary build-up beyond the air when they used a 10 × 10 cm2 6 MV photon beam. Kan et al. [12] showed that the measured doses agreed with the doses calculated by the AXB within 3% and the discrepancy between the AAA and measurements was up to 10% near air/tissue interfaces in the anthropomorphic thorax phantom. Han et al. [13] showed better agreement of AXB results (0.1% to 3.6%) than of AAA results (0.2% to 4.6%) when they compared them to the measurements in an anthropomorphic head and neck phantom. Although the results from our phantom study showed that the AXB was more accurate for dose predictions beyond a low-density medium such as air, further verification of the dose prediction accuracy of the AXB must be performed in different clinical situations that may include the use of smaller field sizes and multiple tissue heterogeneities.
4.2. Clinical Study
Previous studies with MC simulations and experimental measurements [5,6,10-14] as well as our phantom study showed the superiority of the AXB over the AAA for dose predictions when heterogeneous media are involved. If the AXB is considered to be more accurate for dose calculations for real patient treatment plans, our clinical study indicates the clear discrepancies between the doses calculated by the AAA and the doses actually delivered during treatment for esophageal cancer treatment plans.
The analysis of the maximum dose to the PTV and OARs showed that the dose predicted by the AXB was higher to the PTV and total lung by averages up to 2.2%, and dose differences between the AXB and AAA plans were statistically significant for both the PTV (P = 0.001) and total lung (P = 0.000), whereas the opposite trend was seen for heart, liver, and spinal cord with the AXB predicting a lower maximum dose to these OARs by averages up to 1.7%. Statistical significance of the maximum dose differences between the AXB and AAA plans was observed for the spinal cord (P = 0.000), but not for the heart (P = 0.092) and liver (P = 0.464).
The analysis of the mean PTV dose showed a markedly different pattern, with the AXB’s prediction being lower (by an average of 1.1%) than that of the AAA, and the dose difference showed the statistical significance (P = 0.000). A similar observation was reported by Fogliata et al. [16] for large non-small-cell-lung cancer (NSCLC) with the mean PTV dose predicted by the AXB lower by 1.3% using with the RapidArc technique when the target was inside the soft tissue. For OARs, Fogliata et al. [16] showed the dose differences below ± 0.5% for 6 MV and Kan et al. [12] showed a dose prediction by the AXB that was lower (by 3% to 6%) than for the AAA. The mean dose evaluation for OARs in our study showed that the averaged mean dose differences in the AXB plans were lower by an average of up to 3.6% compared to AAA plans, and the differences were statistically significant with P = 0.000 for all of the OARs. A similar trend was observed showing statistical significance for the V5 (P = 0.004) and V20 (P = 0.000) parameters for the total lung, and their values were lower (by an averages of 3.6 and 3.7% respectively) in the AXB plans compared to the AAA plans.
Furthermore, the data from our clinical study showed statistically significant differences for the minimum PTV dose (P = 0.045) and V100 (P = 0.000) of PTV, with the AXB predicting a lower minimum dose to the PTV (average, 2.5%) and lower PTV coverage (average, 9.1%) than with the AAA. Similar to our minimum PTV dose and V100 results, Kan et al. [12] reported that the AXB’s predictions for both the minimum dose and coverage of the PTV were lower by about 4% than for the AAA for locally persistent nasopharyngeal carcinoma cases. If the AXB plans are normalized such that the PTV coverage in AXB plans same as in the AAA plans (V100 = 95%), the MUs in the normalized AXB plans will increase, with an increase in the prescribed dose for esophageal cancer treatment plans. The more accurate AXB is more likely to avoid dose overestimation or underestimation which occurs due to miscalculation of MUs.
5. Conclusion
The heterogeneous rectangular slab phantom study showed that the AXB is more accurate and provides better agreement with the central-axis depth dose measurements than does the AAA. For esophageal cancer treatment plans, in comparisons to the AAA, the AXB predicted lower PTV coverage as well as a lower mean and minimum PTV dose but a higher maximum PTV dose. The averaged mean doses to all OARs predicted by the AXB were lower compared to the AAA. The maximum doses to the OARs in the AXB plans were lower for the heart, liver, and spinal cord but higher for the total lung compared to the AAA plans. Furthermore, the V20 and V5 values of the total lung in the AXB plans were lower when compared with the corresponding values in the AAA plans.
REFERENCES
- B. Minsky, T. Pajak, R. Ginsberg, T. Pisansky, J. Martenson, R. Komaki, G. Okawara, S. Rosenthal and D. Kelsen, “INT 0123 (Radiation Therapy Oncology Group 94-05) Phase III Trial of Combined-Modality Therapy for Esophageal Cancer: High-Dose Versus Standard-Dose Radiation Therapy,” Journal of Clinical Oncology, Vol. 20, No. 5, 2002, pp. 1167-1174. doi:10.1200/JCO.20.5.1167
- C. C. Ling, P. Zhang, Y. Archambault, J. Bocanek, G. Tang and T. Losasso, “Commissioning and Quality Assurance of RapidArc Radiotherapy Delivery System,” Journal of Clinical Oncology, Vol. 72, No. 2, 2008, pp. 575- 581. doi:10.1016/j.ijrobp.2008.05.060
- International Commission on Radiation Units and Measurements (ICRU), “Determination of Absorbed Dose in a Patient Irradiated by Beams of X and Gamma Rays in Radiotherapy Procedures,” ICRU Report, Bethesda, 1976.
- B. Fraas, J. Smathers and J. Deye, “Summary and Recommendations of a National Cancer Institute Workshop on Issues Limiting the Clinical Use of Monte Carlo Dose Calculation Algorithms for Megavoltage External Beam Radiation Therapy,” Medical Physics, Vol. 30, No. 12, 2003, pp. 3206-3216. doi:10.1118/1.1626990
- O. Vassiliev, T. Wareing, J. McGhee, G. Failla, M. Salehpour and F. Mourtada, “Validation of a New Grid Based Blotzmann Equation Solver for Dose Calculation in Radiotherapy with Photon Beams,” Physics in Medicine and Biology, Vol. 55, No. 3, 2010, pp. 581-598. doi:10.1088/0031-9155/55/3/002
- K. Bush, I. M. Gagne, S. Zavgorodni, W. Ansbacher and W. Beckham, “Dosimetric Validation of Acuros XB with Monte Carlo Methods for Photon Dose Calculations,” Medical Physics, Vol. 38, No. 4, 2011, pp. 2208-2221. doi:10.1118/1.3567146
- A. Fogliata, G. Nicolini, A. Clivio, E. Vanetti, P. Mancosu and L. Cozzi, “Dosimetric Validation of Acuros XB Advanced Dose Calculation Algorithm: Fundamental Characterization in Water,” Physics in Medicine and Biology, Vol. 56, No. 6, 2011, pp. 1879-1904. doi:10.1088/0031-9155/56/6/022
- L. Tillikainen, H. Helminen, T. Torsti, S. Siljamäki, J. Alakuijala, J. Pyyry and W. Ulmer, “3D Pencil-BeamBased Superposition Algorithm for Photon Dose Calculation in Heterogeneous Media,” Physics in Medicine and Biology, Vol. 53, No. 14, 2008, pp. 3821-3839. doi:10.1088/0031-9155/53/14/008
- L. Tillikainen, S. Siljamäki, H. Helminen, J. Alakuijala and J. Pyyry, “Determination of Parameters for a Multiple-Source Model of Megavoltage Photon Beams Using Optimization Methods,” Physics in Medicine and Biology, Vol. 52, No. 5, 2007, pp. 1441-1467. doi:10.1088/0031-9155/52/5/015
- T. Han, J. Mikell, M. Salehpour and F. Mourtada, “Dosimetric Comparison of Acuros XB Deterministic Radiation Transport Method with Monte Carlo and ModelBased Convolution Methods in Heterogeneous Media,” Medical Physics, Vol. 38, No. 5, 2011, pp. 2651-2664. doi:10.1118/1.3582690
- A. Fogliata, G. Nicolini, A. Clivio, E. Vanetti and L. Cozzi, “Dosimetric Evaluation of Acuros XB Advanced Dose Calculation Algorithm in Heterogeneous Media,” Radiation Oncology, Vol. 6, No. 1, 2011, p. 82. doi:10.1186/1748-717X-6-82
- M. Kan, L. Leung and P. Yu, “Verification and Dosimetric Impact of Acuros XB Algorithm on Intensity Modulated Stereotactic Radiotherapy for Locally Persistent Nasopharyngeal Carcinoma,” Medical Physics, Vol. 39, No. 8, 2012, pp. 4705-4714. doi:10.1118/1.4736819
- T. Han, F. Mourtada, K. Kisling, J. Mikell, D. Followill and R. Howell, “Experimental Validation of Deterministic Acuros XB Algorithm for IMRT and VMAT Dose Calculations with the Radiological Physics Center’s Head and Neck Phantom,” Medical Physics, Vol. 39, No. 4, 2012, pp. 2193-2202. doi:10.1118/1.3692180
- L. Hoffmann, M. Jørgensen, L. Muren and J. Petersen, “Clinical Validation of the Acuros XB Photon Dose Calculation Algorithm, a Grid-Based Boltzmann Equation Solver,” Acta Oncologica, Vol. 51, No. 3, 2012, pp. 376- 385. doi:10.3109/0284186X.2011.629209
- A. Fogliata, G. Nicolini, A. Clivio, E. Vanetti and L. Cozzi, “On the Dosimetric Impact of Inhomogeneity Management in the Acuros XB Algorithm for Breast Treatment,” Radiation Oncology, Vol. 6, No. 1, 2011, p. 103. doi:10.1186/1748-717X-6-103
- A. Fogliata, G. Nicolini, A. Clivio, E. Vanetti and L. Cozzi, “Critical Appraisal of Acuros XB and Anisotropic Analytic Algorithm Dose Calculation in Advanced NonSmall-Cell Lung Cancer Treatments,” Journal of Clinical Oncology, Vol. 83, No. 5, 2012, pp. 1587-1595. doi:10.1016/j.ijrobp.2011.10.078
- D. M. Robinson, “Inhomogeneity Correction and the Analytic Anisotropic Algorithm,” Journal of Applied Clinical Medical Physics, Vol. 9, No. 2, 2008, pp. 112-122.
- K. Breitman, S. Rathee, C. Newcomb, B. Murray, D. Robinson, C. Field, H. Warkentin, S. Connors, M. Mackenzie, P. Dunscombe and G. Fallone, “Experimental Validation of the Eclipse AAA Algorithm,” Journal of Applied Clinical Medical Physics, Vol. 10, No. 2, 2007, pp. 76- 92.
- A. Van Esch, L. Tillikainen, J. Pyykkonen, M. Tenhunen, H. Helminen, S. Siljamäki, J. Alakuijala, M. Paiusco, M. Iori and D. Huyskens, “Testing of the Analytical Anisotropic Algorithm for Photon Dose Calculation,” Medical Physics, Vol. 33, No. 11, 2006, pp. 4130-4148. doi:10.1118/1.2358333
NOTES
*Corresponding author.