Journal of Geographic Information System
Vol.5 No.2(2013), Article ID:29780,12 pages DOI:10.4236/jgis.2013.52014
Spatiotemporal Urban Land Use Changes in the Changzhutan Region of Hunan Province in China
1Hunan Province Engineering Laboratory of Geospatial Information, Hunan University of Science and Technology, Xiangtan, China
2USDA/ARS, National Sedimentation Laboratory, Oxford, USA
3TIANDITU Science and Technology Development Limited Company, Tianjin, China
Email: quanbin308@yahoo.com.cn
Copyright © 2013 Bin Quan et al. This is an open access article distributed under the Creative Commons Attribution License, which permits unrestricted use, distribution, and reproduction in any medium, provided the original work is properly cited.
Received February 5, 2013; revised March 4, 2013; accepted April 4, 2013
Keywords: Land Use/Land Cover Change; Urbanization; Geographical Information System; The Changzhutan Region
ABSTRACT
The Changzhutan region in the north-central part of Hunan Province in China has experienced a rapid urbanization in the past few decades that has led to substantial changes in its environment. In 2007, the National Development and Reform Commission of China designated the metropolitan district of Changsha City, Zhuzhou City, and Xiangtan City of this region as the fourth National Demonstration Area where economic development should be implemented in harmony with resource-saving and environment-friendly land use practices. The research, focus of this article will be on quantifying the spatial pattern of urban land use change which not only can provide an assessments and predictions of future environmental effects, but also will serve as a scientific basis for the development of urban sustainability. This paper integrates historical Landsat TM imagery, geographical information system (GIS) and socioeconomic data to determine the spatiotemporal urban land use dynamics and conversion of land use in response to the rapid urbanization of a select group of cities in China from 1990 to 2007. The approach is based on Principle Component Analysis to determine and model the relationship between the socioeconomic factors and land use/cover change (LUCC) for identifying the driving forces. The results indicate that land cover of the Changzhutan region mainly consists of forestland and cropland which accounted for about 93% of the total land area. During the 1990-2007 study period, the urban areas and water bodies increased by 46,297 ha and 775 ha, respectively, while forestland, cropland, and grassland decreased appreciably by 22,580 ha, 21,808 ha, and 5618 ha, respectively. Moreover, the urban land area during the 2000-2007 period increased by five times as much as that during the 1990-2000 period. The land use dynamic degree of Changsha City is the largest one followed by that for Xiangtan and Zhuzhou Cities. During this study period, the land use comprehensive intensity index increased and followed the sequence Xiangtan > Changsha > Zhuzhou. The changes were attributed to economic development, population growth, infrastructure improvements and construction, and land use policies. To address the negative or eco-environmental deleterious effects of these changes, landscape ecology plan, population growth control, and the development of an ecological friendly agriculture were suggested.
1. Introduction
A major goal of today’s geographers is to better understand how land use change affects and shapes the environment. Land use/cover change (LUCC) is an important parameter in assessing regional and global environmental changes. It also affects the quality of human life and socioeconomic development [1,2]. China has become a society in which many people live in urban areas. In fact, nearly one half of the population (49.7% or 665.57 million people) lived in urbanized areas in 2010 [3]. The increased urbanization and the use of modern technologically agricultural practices, while increasing the supplies of material goods in the short term, may potentially undermine in the long run the environmental quality of the urban system at regional scales [4]. This may come about by excessive use and frequent contamination of surface and ground water, the production of greenhouse gases and other air pollutants, and land transformation that devastates biodiversity and ecosystem services [5]. Therefore, the protection of the Chinese urban ecological environment is a great challenge in the era of rapid economic development.
The urban LUCC and sustainability will be the focus of scientific research for a long time to come. This research, which is supported by a combination of geographical information system (GIS), remote sensing and spatiotemporal model, has made great progress. At the international level, the Urban Environmental Monitoring (UEM) project at Arizona State University, most recently known as the “100 Cities Project”, is well-known and represents a baseline effort to collect and analyze remotely sensed data for 100 urban centers worldwide. Eight cities were ultimately selected for more intensive study, they are: Chiang Mai, Thailand; Berlin, Germany; Canberra, Australia; Delhi, India; Lima, Peru; Malina, Philippines; Mexico City, Mexico; and Phoenix, USA [6]. In the past 20 years, the research was financed by the European Science Foundation and the scientific results published in a book entitled: “Remote Sensing and Urban Analysis” [7]. Scientists observed LUCC characteristics and process in some typical areas of the USA, India, Malaysia, Turkey, etc. and proposed some protecttion policies of land resources in response to rapid urbanization [8-13]. From the landscape perspective of land use changes, some achievements have been made in Netherlands, Japan, Estonia, Spain and Israel [14]. LUCC studies in China have also made great progress [15-20].
The metropolitan district of Changsha City, Zhuzhou City and Xiangtan City (Changzhutan region) in Central China is one of the fastest growing metropolitan areas in China where soil degradation and environment pollution has become severe due to increased economic activity. Therefore, socioeconomic development will be restricted. Economic growth have led to an unprecedented ruralto-urban migration which contributed greatly to the increased urbanization. According to the Hunan Province Statistical Yearbook 1990-2007, the population in the Changzhutan region increased from 11,647,800 persons in 1990 to 13,099,600 persons in 2007. The non-agriculture population increased from 2.723 million persons in 1990 to 7.743 million persons in 2007. The increase in the population growth rate was higher than that of cropland so that the cropland per capita declined from 0.074 ha in 1990 to 0.064 ha in 2007. The urbanization rate in 2007 for this region was close to 60%. The GDP for this region increased more than 16 times from 2.0344 × 10¹⁰ RMB yuan in 1990 to 3.46832 × 10¹¹ RMB yuan in 2007. The booming construction of infrastructure and industrial parks led to increased demand for rural-urban industrial land. The idea of integrating economic developments of the cities of Changsha, Zhuzhou, and Xiangtan came about in 1995. At that time, a plan was formulated by the government of Hunan Province to establish a Financial Centre called “Five Integrations in Three Cities”. As a result of the establishment of this center, a conceptual plan was developed in 1998 for a “Xiangjiang River Ecological Economy Zone”. Subsequently, a “Regional Development Plan for the Changzhutan region” was formulated in 2005 to promote regional integration. In September 2007, the Government of Hunan Province promulgated and implemented the “Regulations on Regional Planning for the Changzhutan City Group”. On December 14, 2007, the National Development and Reform Commission of China officially announced that the Changzhutan region will be listed as the fourth National Demonstration Area in which the “Dimorphous Community” Program should be adopted. This program is designed to improve the ecological condition of an area by constructing resource-saving and environmentally friendly urban community development measures. During the past few decades, considerable research has been conducted on LUCC and related urbanization problems. However, the Changzhutan region is still one of the least understood urban land eco-systems due to lack of interdisciplinary integration and immense complexity of human-nature interactions. To date, little information is available that explores quantitatively urban dynamic processes and models of driving forces of change for this region. Therefore, urban land use/cover change for the Changzhutan region, being a representative area of central China, must be further examined. The main purpose of this study was to quantify the historical land use change of the Changzhutan region in China during 1990- 2007 using selected spatiotemporal models. Specifically, we compare the temporal and spatial patterns of urbanization in the Changzhutan region and beyond, model the main driving forces in the Changzhutan region based on Principal Component Analysis (PCA), and conclude the paper with a discussion on approaches of sustainable development programs that are important in decision making and implementing land utilization policies for this region.
2. Materials and Methods
2.1. Study Area
The Changzhutan region (27˚50'N - 28˚11'N, 112˚54'E - 113˚10'E) is located in the northeast part of Hunan Province, China, has an area of 28,100 km2, and consists of the cities of Changsha, Zhuzhou, and Xiangtan (Figure 1). The Xiangjiang River runs through this region and the cities are located at the vertices of a triangle with respect to each other along this river and spaced about 45 kilometers from each other. This region is located in a transition zone in the midand south-subtropics and has a subtropical humid climate with monsoon periods. The mean annual temperature fluctuates between 16˚C and 18˚C and the mean annual precipitation is about 1400 mm. Rainfall is largely concentrated in the period from April to September, and accounts for 60% to 80% of the annual precipitation. Because the region has ample rainfall and a
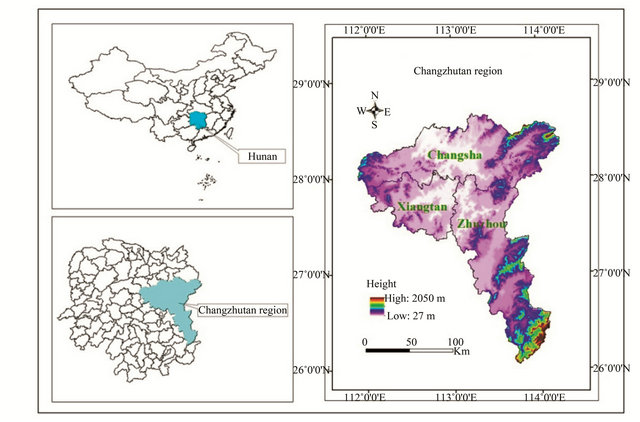
Figure 1. Location of study area in Hunan Province and China.
lot of sunshine it is favorable for crop growth. The geomorphology consists mainly of mountains, hills, footslopes, and plains [21]. Major crops are paddy rice, rape, and tea. The landscape is covered by forest of evergreen and deciduous broad-leave and mixed evergreen trees in which the lithocarpus glaber, Castanopsis sclerophylla + Cyclobalanopsis glauca, and Cinnamomum camphora species are representative communities. Cinnamomum camphora, Castanopsis sclerophylla, Liquidambar formosana, Ilex chinensis are commonly occurring types of vegetation [22]. A large part of the evergreen broad leave trees make it one of the most important forested headwater conservation areas of the Xiangjiang River basin. The annual runoff volume is 82.65 × 10⁸ m3 and the annual runoff depth is 550 - 850 mm/a. More than 70 rivers and streams make up the river system and Xiangjiang River is the most important river in the Changzhutan region. Widely distributed red soils and yellow soils (Udic Ferraisols or Luvisols in the Chinese Soil Taxonomy) cover large areas in the Changzhutan region. In 2009, its population was 13300000 and the gross domestic product (GDP) was 5.5 × 10¹¹ RMB yuan indicating that economic growth caused the urban expansion. It is expected that the implemention of the “Dimorphous Community” Program will promote social and economic development of the Changzhutan region.
2.2. Data Source and Land Use Classification System
The data was mainly obtained from the Chinese Resource and Environment Database, in which land use maps with scale of 1:100,000 were interpreted from Landsat Thematic Mapper (TM/ETM) images of 1989/ 1990, 1995/1996, 1999/2000 and 2007. These images are in this paper denoted as 1990, 1995, 2000 and 2007, respectively. The classification accuracy of the three former data sets was 92.92%, 98.40%, and 97.45%, respectively [16] and the 2007 data set was interpreted based on image and corrected according to land use map and Google Earth maps so its classification accuracy is close to 90%. Also, other data sets were included such as DEMs and the boundaries of the administrative regions. The data were assembled into the same coordinate system and the Albers projection parameter is Krassovsky ellipsoid with central meridian 105˚E, 1st standard parallel 25˚N, 2nd standard parallel 47˚N, false easting 0, false northing 0, and 0 latitude of projection’s origin. Land use was divided into five classes: cropland, forestland, grassland, open water bodies, and rural-urban industrial land.
2.3. Models
Land use changes can be described by the land use dynamic degree relationship that is given by the following mathematically expression [15]:
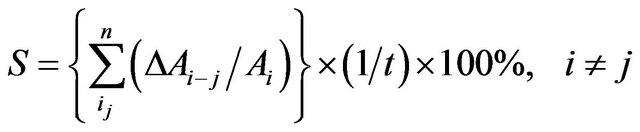 (1)
(1)
where S is the land use dynamic degree during the time interval t usually covering several years; Ai is the area of the i-th land use type at the beginning of the monitoring period; ΔAi − j is the area of the i-th type land use converted into the j-th type land use; and n is the total number of land use types. The land use dynamic degree is thus defined as the rate of change of the total land area that was converted into other types of land use. The dynamic expresses in a comprehensive manner the dynamic change in land use for a given region.
Differences in the land use intensity index were calculated by Equation (2) [23,24]:
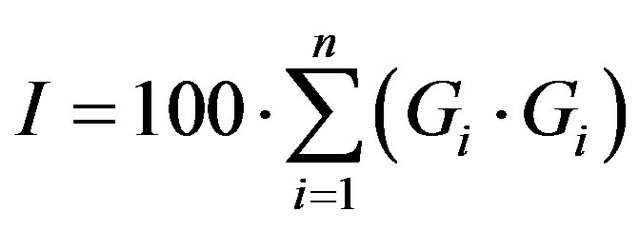 (2)
(2)
where I is the land comprehensive intensity index; Gi is a grade or quality index of the i-th land use type; Ci is the percentage of the area in the i-th land use type; and n is the number of land use grades. In this paper, a grade index system was used in which forestland, grassland and open water was assigned the factor value 1; cropland the factor value 2; and rural-urban industrial land the factor value 3. Land use can be ranked on the basis of its value economic or social to human beings [25].
The land use degree change parameter (ΔIb − a) represents the change in the land use intensity index and is given by:
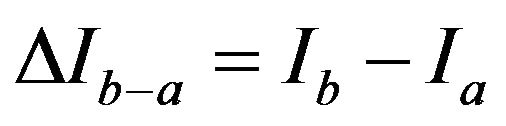 (3)
(3)
where Ib and Ia are the land use intensity indexes at times b and a, respectively. If ΔIb − a > 0, then land use is developing, if ΔIb − a < 0 then the land use is regressing. Thus the land use comprehensive intensity index reflects both magnitude and value of land use changes [26].
2.4. Principal Component Analysis for Driving Forces
Principal component analysis is a multivariate statistical analysis method based on the minimum original data loss and dimension reduction, making less integrated variable reflecting its multi-dimensional variable information [27,28]. Sixteen indicators were chosen in this analysis as independent variables to arrive at possible driving forces of land use change in the Changzhutan region. Specific rules such as comprehension and easy manipulation were followed in selecting the principal components. The sixteen indicators include: total population, the proportion of non-agricultural population, gross domestic product, second industrial output value, gross industrial output value, tertiary industry output value, urban investment in fixed assets, retail sales of social consumer goods, local financial revenue, local fiscal expenditure, disposable income of urban residents, built-up area, urban greening area, hospital beds, real estate investments, and crop land area. The original data of these 16 indicators were used to calculate a standardized index for processing with the SPSS 17.0 program. The equation is:
 (4)
(4)
where Xi' is the standardized index, Xi is the original data,  is the average of the original data, S is the standard deviation.
3. Results and Analysis
3.1. Temporal Changes of Land Use
The changes in land use in the Changzhutan region are summarized in Table 1 and Figure 2. The data indicated that land cover in the Changzhutan region mainly consisted of forestland and cropland which accounted for about 93% of the total land area. The data show that rural-urban industrial land and open water bodies increased, while forestland, cropland, and grassland decreased from 1990 to 2007. Rural-urban industrial land increased by 46,297 ha, followed by open water bodies with 775 ha. On the other hand, forestland decreased by 22,580 ha followed by cropland with 21,808 ha, and grassland with 5618 ha due to an appreciable increase in urban construction. Latter decreases suggest that the regional grain production and supply as well as the environmental quality had been adversely impacted.
The data indicate that urban expansion accounts for most of the land use/cover change of forestland, cropland, and grassland. The occurrence and distribution of rural-urban industrial land in the Changzhutan region changed from 1990 to 2007 as shown in Figure 3. The sprawling urban city areas, consisting of housing development, university expansions, Economic and Technological Development Zones, and Industry Parks, are dispersed among a large number of non-urban cropland and forestland, that potentially are suited for urban construction. It is expected that the continued expansion of the three cities will gradually lead to their consolidation into a metropolitan area.
3.2. Conversions of Different Land Use Types
Conversions were common among various land use types in the study area. Tables 2 and 3 summarize these conversions in the Changzhutan region between 1990-2000
Table 1. Land use changes in the Changzhutan region between 1990 and 2007.
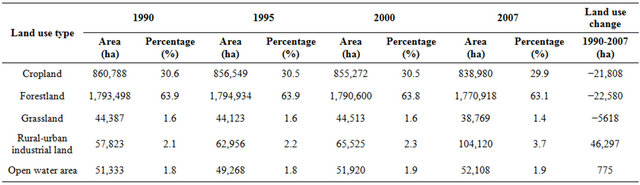
Table 2. Land use conversions between 1990 and 2000.
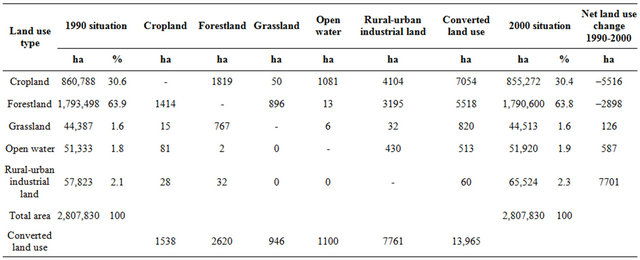
Table 3. Land use conversions between 2000 and 2007.

(early stage) and 2000-2007 (later stage), respectively. Table 2 shows that 58.2% of the cropland lost during the “early stage” was converted into rural-urban industrial land. The remaining part of the lost cropland was converted into forestland (25.8%) and open water areas (15.3%). Table 3 indicates that about 56.8% of the cropland lost during the “later stage” was converted into rural-urban industrial land. The remaining lost cropland
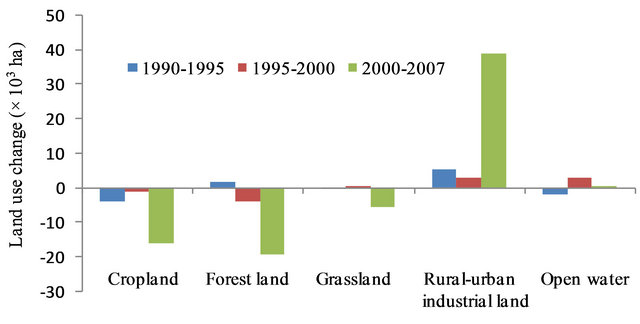
Figure 2. Net changes of land use in the Changzhutan region of Hunan Province.
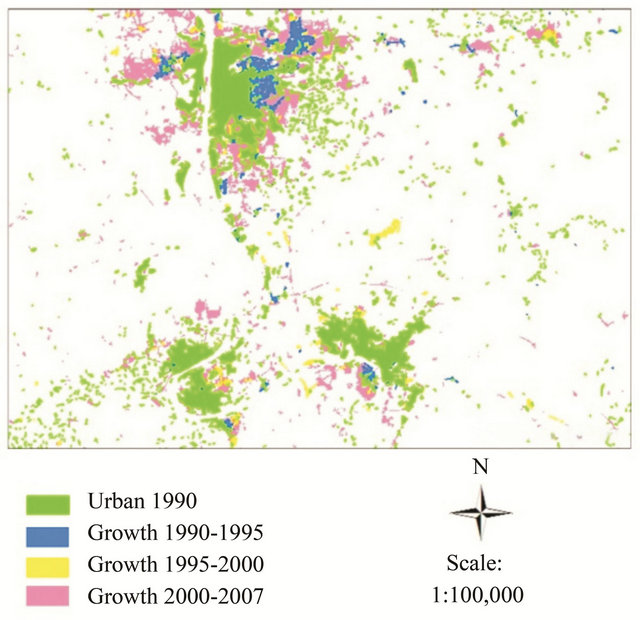
Figure 3. Urban expansion in Changsha, Zhuzhou and Xiangtan Cities in the Changzhutan region between 1990 and 2007. Not all study region are shown.
was converted into forestland (25.0%) and open water areas (17.0%). However, the cropland area that was converted into rural-urban industrial land during the “later stage” is 5.5 times that of the “early stage” which suggests that cropland loss accelerated over time. Much less rural-urban industrial land converted into cropland during the “early stage”. About 57.9% and 40.6% of the lost forestland was converted into rural-urban industrial land in the “early stage” (Table 2) and in the “later stage” (Table 3), respectively. Like for cropland, a large part of the forestland was also converted into rural-urban industrial land. One may conclude that the conversions among rural-urban industrial land, cropland, and forestland during these two periods were significant. These changes may have been influenced by policies of regional economic development, industrialization, and urbanization.
3.3. Dynamics of Land Use
To better understand the dynamics of land use changes, the dynamic degree was calculated for each of the three cities in the Changzhutan region using Equation (1). In general, the sequence of land use dynamic degree for cities in the Changzhutan region between 1990-2007 is Changsha > Xiangtan > Zhuzhou. Figure 4 indicates that Changsha City has the largest land use dynamic degree for the periods 1990-1995 and 2000-2007 followed by Xiangtan City and Zhuzhou City. The land use dynamic degree for the period 1995-2000 was about the same for the three cities. Changsha City is the capital of Hunan Province in the China. It has a larger urban area than the other cities in the Changzhutan region and is densely populated. Therefore, it has appreciable advantages in attracting funds and scientifically and technically trained personnel and thus has more opportunities for rapid economic development. In 2009, the GDP of Changsha City was 3.745 × 10¹¹ RMB yuan which is higher than that for Zhuzhou City (1.22 × 10¹¹ RMB yuan) and Xiangtan City (7.39 × 10¹⁰ RMB yuan). Therefore, the demand for urban land greatly increased and the land use dynamic degree of Changsha City was the largest in the region. Xiangtan promoted the development of a national economic development zone. For example, Jiuhua Economic Development Zone of Xiangtan City successfully demonstrated the upstart of more than 100 industries in 2003. Also, the Xiangtan municipal government formulated a policy that the land value of the Jiuhua Economic Development Zone would have the lowest price in the Changzhutan region in order to attract foreign capital and high-tech industries. Therefore, the moderate land use dynamic degree for Xiangtan was attributed to the rapid establishment of an industrial base. Zhuzhou has had historically an old industrial base and therefore land de-
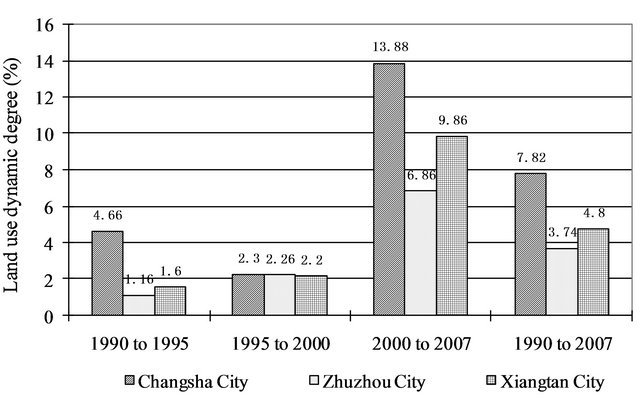
Figure 4. Land use dynamic degrees of three cities of Changzhutan region from 1990 to 2007.
velopment was less due to a stable industrial base. In addition, Zhuzhou is primarily covered by forest land, the dynamic degree was the smallest among all the cities. The Changzhutan region has experienced unusual changes which suggest a deterioration in the ecological environment.
3.4. Regional Differences in Change of Land Use Degree
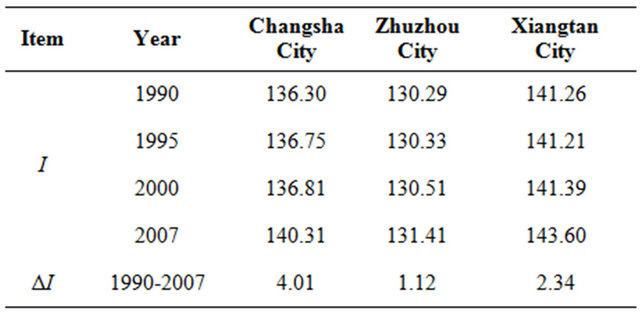
Table 4 summarizes the land use intensity index I and its changes ΔI for different cities in the study area between 1990-2007. A comparison of ΔI values for the three cities in the Changzhutan region indicates that Changsha City has the largest value of 4.01 followed by Xiangtan City. The relatively large values were attributed to the favorable physical geography, open policy, and large population density that favored the development of industry and tourism and promote farmland conversion into urban areas. In contrast, ΔI had the smallest value for Zhuzhou City because of restrictions on urban development given its old industrial base. ΔI values for Xiangtan City were moderate. The economic policy favored industrial production and led to the conversion into rural-urban Industrial land. In general, the greater the increase in the parameter ΔI, the greater the adverse effect on the eco-environment due to land use changes.
3.5. Driving Force Model of Urban Land Use Change
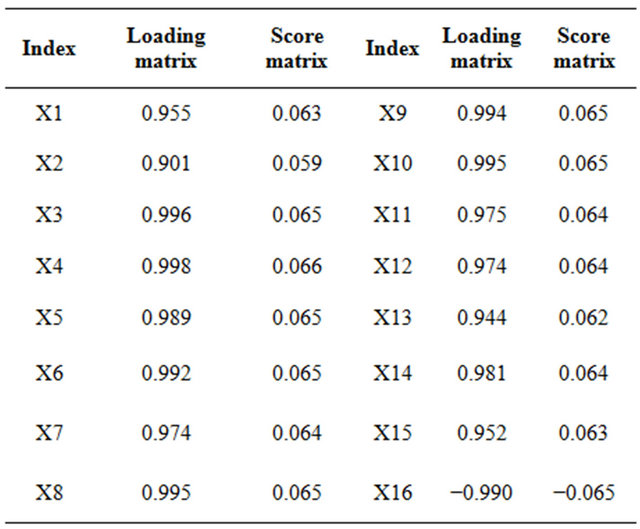
Economic conditions and population growth severely limited sustained development of the Changzhutan region. In order to better understand the impact on societal and economic developments in urbanization processes, the correlation matrix, principal component loading matrix, and score matrix of driving forces were calculated using the SPSS 17.0 program for the study period. Ta-
Table 4. Land use intensity index (I) and its change (ΔI) for cities in the Changzhutan region from 1990 to 2007.
bles 5 and 6 summarize the data for rural-urban Industrial land. Table 5 indicates that there was a strong positive correlation between all factors except for cropland (X16) which was negatively correlated with all other factors. Only one principal component was identified. The eigenvalue of this principal component was 15.232 and its effect accounted for 95% of the variation. Based on the analysis, the driving forces can be divided into three factors: population, economy, and infrastructure. The increase in non-agricultural population led to city growth. The trend is for the three cities in the Changzhutan region to become one metropolis in the future. Economic improvements and new industries requires quality land for development. Meanwhile economy prosperity and rapid development of tertiary industries, such as tourism resulted in population increases that accelerates further the infrastructure improvements and housing built-up.
The relationship between the various factors and rural-urban development was obtained from the score matrix given in Equation (5). By inserting the standard indexed value of each factor in Equation (5), the temporal change of the driving force comprehensive scores of the rural-urban industrial land could be generated (Figure 5).
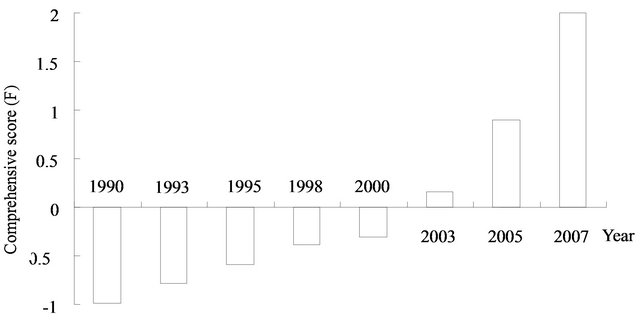
Figure 5. Temporal change of driving force comprehensive scores of the rural-urban industrial land.
Table 5. Correlation coefficient matrix for driving forces of rural-urban industrial land in the Changzhutan region.
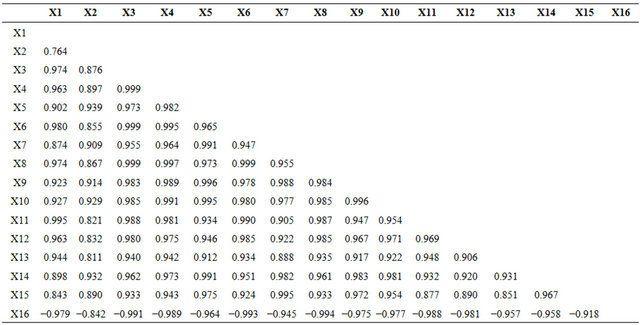
Table 6. Principal component loading matrix and score matrix.
The comprehensive scores of socioeconomic driving forces gradually increase with time. The socioeconomic factor is the main driving force for urban development and resultant land use in the Changzhutan region. And its influence on the urban-ecosystem has become stronger and stronger.
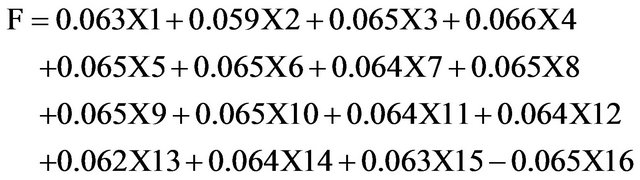 (5)
(5)
4. Discussion
4.1. Urbanization Patterns and Landscape Planning
The urbanization process of the Changzhutan region was analyzed using remote sensing data, GIS methods, and spatial models. The analysis shows that rural-urban industrial land increased while cropland, forestland and grassland decreased between 1990 and 2007. Approximately 57% of the lost cropland and about 50% of the lost forestland, respectively, were converted into ruralurban industrial land. The current urban growth model also indicates that this region as well as all of the coastal region of China is sustaining environmental damage that can, under the prevailing conditions, not be ecologically sustained [21]. Recognizing this fact, the Chinese leadership called in 2007 for a “Ecological Civilization” program, which is a new approach in China that was especially formulated by the senior Chinese political leadership to address ecological concerns related to urbanizetion. In this program sustainable development in addition to economic growth should be emphasized [29]. The Changzhutan region was selected in 2007 as a demonstration region for this program called “Dimorphous Community”.
The main spatiotemporal signature of urbanization in the Changzhutan region is the decrease of cropland, forestland, and grassland. Another distinctive characteristic for the region is the gradual consolidation or merging of the three cities into a metropolis. Each city has a growing suburban area with roads connected to each other. Urbanization of the Changzhutan region has been the result of socioeconomic development, thereby exacerbating eco-environment problems such as soil erosion, water quality degradation, deforestation, air pollution, habitat destruction, bio-diversity loss, hydrological changes, and urban “heat-island” effects [30]. Urbanization should not only be seen as the ultimate cause of environmental problems but also as an opportunity to promote regional and global ecological sustainability [31]. One way to solve these problems is through landscape ecological planning and designs that supports environmentally friendly and resource efficient developments that will improve the ecosystems in terms of functionality to meet human needs and requirements as well as biodiversity. In this approach, the emphasis for urban sustainability should be placed on the ecological infrastructure such as “greenbelts”. For instance, the widely distributed red soils (Udic Ferraisols or Luvisols in the Chinese Soil Taxonomy) in the Changzhutan has thick soil profiles. However, water-storage, and available water-storage capacity for plant growth is limited [32]. The present situation and conditions have lead to the progressive development of seasonal drought. To address this problem one might select favorable sites for constructing small water storage ponds where excess rain during the wet season can be stored for irrigation. These irrigation ponds could be similar to the “Tameike” in Japan, which not only solve effectively droughts in the dry summer season but also create a favorable ecosystem [33]. The Japanese landscape management approach with open water bodies reflects in effect also the Chinese philosophy of “Unity of Man with Nature”. Its multi-functionality in agriculture is comparable with the MIDORI (Eco-residential Houses of Natural Environment) ecological agricultural model of Japan that is designed to develop green homeland in a harmonious ecological relationship with land and water resources. This approach offers a sound ecological prospect of a viable productive agriculture [34]. Thus, the three cities could be separated by “greenbelts” with an ecologically agricultural emphasis and “ecological green hearts” e.g. forest parks, wetland parks, botanical gardens, and scenic spots. In short, the integration of landscape ecology approaches, based on sustainability science, provides an effective way for achieving urban sustainability.
4.2. Comparison among the Changzhutan Region and Beyond
The three cities in the Changzhutan region in China have experienced different dynamic changes in land use. Changsha City had the largest dynamic degree while Zhuzhou City has the smallest. A lower land use degree generally indicates a lower level of economic activity. Economic activity in Zhuzhou City was greater than that of Xiangtan City. However, policy and more recent developments have appreciable increased economic growth in Xiangtan City (Table 4).
Based on the continental landforms concepts, China can be divided into three zones: east, middle, west. The Changzhutan region is typically representative of the middle part of China. Xiamen City located in the coastal area is more representative of the eastern part of China [35]. The Liupan Mountains region (34˚14'N - 37˚04'N, 105˚09'E - 106˚58'E) is located in the southern part of Ningxia Hui Autonomous Region in China with a 16,775 km2 area that consist of Guyuan, Jingyuan, Pengyang, Xiji, and Longde and Haiyuan counties [36,37]. This Liupan Mountains region is representative of the western part of China. Figure 6 shows a summary of the land use dynamic degrees for these three parts of China for the period 1990-2007. The land use dynamic degree of Xiamen City has the largest value of 11.3, followed by the Changzhutan region with 5.76, and the Liupan Mountains region with 1.79 [38]. Xiamen, favorable located on the South China Sea, is economically developed and has experienced rapid urbanization. Its urbanization rate is 60% - 70%, while that of Liupan Mountains region is around 20% during the same period from 1990-2007. The GDP and financial revenue for Xiamen in the year 2000 were 5.01 × 10¹⁰ and 9.1 × 10⁹ RMB yuan, respectively, while those for the Liupan Mountains region were 2.17 × 10⁹ and 8.9 × 10⁷ RMB yuan for the same year.
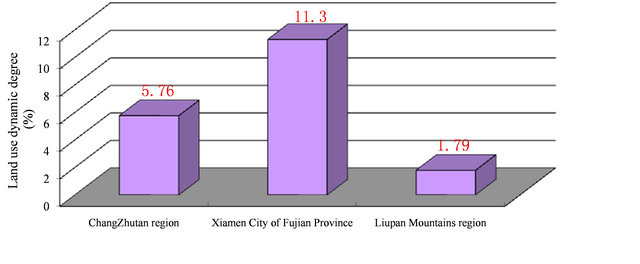
Figure 6. Land use dynamic degrees of represented region of east, middle and west part of China from 1990 to 2007.
The difference between these two regions reflects the gap in economic activity among the various parts of China that is also reflected in the land use dynamic degree. The middle part of China, represented by the Changzhutan region, is experiencing a similar urbanization process that happened in the eastern part of China more than ten years ago. The Changzhutan region should learn from the experience in the eastern part of China where economic development mainly relied on excessive exploitation of natural resources at the cost of eco-environmental damages. Therefore, the Changzhutan region should adopt the strategy of the “Dimorphous Community” Program in developing future urban sustainability.
5. Conclusions
This article discussed how in the Changzhutan region urban land use was experienced and how it underwent changes in order to enhance its effectiveness in promoting ecological balance during economic development. A quantitative analysis was made of the spatiotemporal changes of land use in the Changzhutan region of China using spatial models, GIS, and remote sensing methods and data in conjunction with socioeconomic variables. The Changzhutan region was found to have had rapid changes in land use. Urban land use increased by 46,297 ha between 1990-2007 to a total of 104,120 ha in 2007, which led to an appreciable reduction in other land uses primarily cropland (21,808 ha or 2.53%), forestland (22,580 ha or 1.26%), and grassland (5618 ha or 12.66%). Land use conversions were very common in the Changzhutan region in those years. The ecology of the cropland, forestland, and grassland that were converted into urban land use was adversely impacted because of environmental degradation due to drought, storm and flood, reduced water quality, and soil erosion. The change in land use was attributed to economic developments, population growth, infrastructure related construction activities, aided by ecologically adverse public policies.
Reasonable landscape ecology planning, population growth control, and the development of an ecology friendly agriculture are some of the approaches that should be adopted for a sustainable land use in the Changzhutan region. Much can be learned from the land resource development in eastern China. If the critical properties and landscape characteristics that control the LUCC can be identified in the Changzhutan region, then better approaches and methods can be developed that allow a sustainable land use which is ecologically viable and that at the same time provide a better understanding for addressing similar problems elsewhere.
6. Acknowledgements
This research was supported by program of the United States Department of Agriculture (Agreement Number: 58-6408-3-001FN) and the State Key Laboratory of Soil Erosion and Dryland Farming on the Loess Plateau, Institute of Water and Soil Conservation, Chinese Academy of Sciences and Ministry of Water Resources (No. 10,501-298). The authors greatly appreciate the help by Chinese Academy of Sciences Resource and Environment Science Data Center in providing partial land use data in the research project.
REFERENCES
- E. F. Lambin and H. J. Geist, “Land-Use and Land-Cover Change: Local Processes and Global Impacts,” SpringerVerlag, Berlin, 2006. doi:10.1007/3-540-32202-7
- P. A. Matson, W. J. Parton, A. G. Power and M. J. Swift, “Agricultural Intensification and Ecosystem Properties,” Science, Vol. 277, No. 5325, 1997, pp. 504-509. doi:10.1126/science.277.5325.504
- X. Z. Peng, “China’s Demographic History and Future Challenges,” Science, Vol. 333, No. 6042, 2011, pp. 581- 587. doi:10.1126/science.1209396
- J. A. Foley, R. DeFries, G. P. Asner, C. Barford, G. Bonan, S. R. Carpenter, et al., “Global Consequences of Land Use,” Science, Vol. 309, No. 5734, 2005, pp. 570- 574. doi:10.1126/science.1111772
- J. G. Wu, “Urban Sustainability: An Inevitable Goal of Landscape Research,” Landscapes Ecology, Vol. 25, No. 1, 2010, pp. 1-4. doi:10.1007/s10980-009-9444-7
- E. Banzhaf and M. Netzband, “Monitoring Urban Land Use Changes With Remote Sensing Techniques,” In: M. Richer and U. Weiland, Eds., Applied Urban Ecology: A Global Framework, Wiley-Blackwell Publishing Ltd., Chichester, 2012, pp. 18-32.
- J. Donnay, M. J. Barnsley and P. A. Longley, “Remote Sensing and Urban Analysis,” Taylor & Francis, London, 2001. doi:10.4324/9780203306062
- A. W. Thompson and L. S. Prokopy, “Tracking Urban Sprawl: Using Spatial Data to Inform Farmland Preservation Policy,” Land Use Policy, Vol. 26, No. 2, 2009, pp. 194-202. doi:10.1016/j.landusepol.2008.02.005
- A. M. Dewan and Y. Yamaguchi, “Land Use and Land Cover Change in Greater Dhaka, Bangladesh: Using Remote Sensing to Promote Sustainable Urbanization,” Applied Geography, Vol. 29, No. 3, 2009, pp. 390-401. doi:10.1016/j.apgeog.2008.12.005
- M. El-Raey, Y. Fouda and P. Gal, “GIS for Environmental Assessment of the Impacts of Urban Encroachment on Rosetta Region, Egypt,” Environmental Monitoring and Assessment, Vol. 60, No. 2, 2000, pp. 217-233. doi:10.1023/A:1006195006898
- A. S. Hadeel, M. T. Jabbar and X. L. Chen, “Environmental Change Monitoring in the Arid and Semi-arid Regions: A Case Study Al-Basrah Province, Iraq,” Environmental Monitoring and Assessment, Vol. 167, No. 1-4, 2010, pp. 371-385. doi:10.1007/s10661-009-1056-9
- S. Malaviya, M. Munsi, G. Oinam and P. K. Joshi, “Landscape Approach for Quantifying Land Use Land Cover Change (1972-2006) and Habitat Diversity in a Mining Area in Central India (Bokaro, Jharkhand),” Environmental Monitoring and Assessment, Vol. 170, No. 1- 4, 2010, pp. 215-229. doi:10.1007/s10661-009-1227-8
- S. Ö. Turan, A. İ. Kadioğullari and A. Gűnlű, “Spatial and Temporal Dynamics of Land Use Pattern Response to Urbanization in Kastamonu,” African Journal of Biotechnology, Vol. 9, No. 5, 2010, pp. 640-647.
- Ü. Mander and R. H. G. Jongman, “Landscape Perspectives of Land Use Changes,” WIT Press, Southampton, 2000.
- J. Y. Liu and A. Buhe, “Study on Spatial-temporal Feature of Modern Land Use Change in China: Using Remote Sensing Techniques,” Quaternary Sciences, Vol. 20, No. 3, 2000, pp. 229-239.
- J. Y. Liu, Z. X. Zhan and X. Z. Deng, “Spatio-Temporal Patterns and Driving Forces of Urban Land Expansion in China During the Economic Reform Era,” Ambio, Vol. 34, No. 6, 2005, pp. 444-449 .
- J. Y. Liu, Z. X. Zhan, X. L. Xu, W. H. Kuang, W. C. Zhou, S. W. Zhang, et al., “Spatial Patterns and Driving Forces of Land Use Change in China in the Early 21st Century,” Acta Geographica Sinica, Vol. 64, No. 12, 2009, pp. 1411-1420.
- C. Xu, M. S. Liu, C. Hong, T. Chi, S. Q. An and X. J. Yang, “Temporal Variation of Characteristic Scales in Urban Landscapes: An Insight into the Evolving Internal Structures of China’s Two Largest Cities,” Landscapes Ecology, Vol. 27, No. 7, 2012, pp. 1063-1074. doi:10.1007/s10980-012-9764-x
- J. Luo and Y. H. D. Wei, “Modeling Spatial Variations of Urban Growth Patterns in Chinese Cities: The Case of Nanjing,” Landscape and Urban Planning, Vol. 91, No. 2, 2009, pp. 51-64. doi:10.1016/j.landurbplan.2008.11.010
- J. S. Deng, K. Wang, Y. Hong and J. G. Qi, “SpatioTemporal Dynamics and Evolution of Land Use Change and Landscape Pattern in Response to Rapid Urbanization,” Landscape and Urban Planning, Vol. 92, No. 3-4, 2009, pp. 187-198. doi:10.1016/j.landurbplan.2009.05.001
- J. Y. She and C. H. Chen, “Research on Modern Forestry Eco-system of Rural-Urban Unification in the Region of Changzhutan,” Hunan University Press, Changsha, 2007.
- Y. J. Yan, M. Wang, Q. Yang and K. W. Liu, “Study on Zonal Vegetation Landscape Characteristics in Changsha-Zhuzhou-Xiangtan Region,” Forest Resources Management, No. 2, 2009, pp. 60-65.
- Y. B. Lai, X. Xia, J. A. Wang, L. Wang, Y. Y. Yu and C. Y. Yang, “Analysis of LUCC Pattern of Physical Region in NSTEC,” Progress in Earth Sciences, Vol. 17, No. 2, 2002, pp. 215-220.
- C. Y. He, H. L. Zhou, Z. T. Yu and Q. T. Zhang, “Regional Land Use/Cover Information Processing,” Resources Science, Vol. 24, No. 2, 2002, pp. 64-70.
- X. L. Wang and Y. H. Bao, “Study on the Methods of Land Use Dynamic Change Research,” Progress in Geography, Vol. 18, No. 1, 1999, pp. 81-87.
- S. Y. Wang, Z. X. Zhang, Q. B. Zhou and C. Y. Wang, “Study on Spatial-Temporal Features of Land Use/Land Cover Change Based on Technologies of RS and GIS,” Journal of Remote Sensing, Vol. 6, No. 3, 2002, pp. 223- 228.
- S. M. Kendall, “Multivariate Analysis,” Macmillan Publishing CO., INC., New York, 1980.
- J. H. Xu, “Mathematics Method in Modern Geography,” 2nd Edition, High Education Press, Beijing, 2006.
- K. J. Yu, “Ecological Infrastructure Leads the Way: The Negative Approach and Landscape Urbanism for Smart Preservation and Smart Growth,” In: M. Richer and U. Weiland, Eds., Applied Urban Ecology: A Global Framework, Wiley-Blackwell Publishing Ltd., Chichester, 2012, pp. 152-169.
- E. Kalnay and M. Cai, “Impact of Urbanization and Land-Use Change on Climate,” Nature, Vol. 423, No. 5, 2003, pp. 528-531. doi:10.1038/nature01675
- J. G. Wu, “Making the Case for Landscape Ecology: An Effective Approach to Urban Sustainability,” Landscapes Journal, Vol. 27, No. 1, 2008, pp. 41-50. doi:10.3368/lj.27.1.41
- B. Quan, J. F. Chen, H. J. Zhu and C. D. Guo, “Water Problem of Lateritic Red Soil and Its Management,” Soils, Vol. 36, No. 5, 2004, pp. 532-537.
- M. C. Nakahara, “Heritage of Land Development—Our Ancestors’ Achievements Engraved on this Island Country, Japan,” Shin Nogyodoboku Rekishi Kenkyu-Kai, Tokyo, 2004.
- B. Quan, B. C. Li and Q. C. Chen, “Introduction of MIDORI Ecological Agriculture Model of Japan and Its Enlightenment on Modern Ecological Agriculture Development on the Southern China,” Tropical Geography, Vol. 30, No. 1, 2010, pp. 50-56.
- B. Quan, J. F. Chen, H. L. Qiu, M. J. M. Römkens, X. Q. Yang, S. F. Jiang and B. C. Li, “Spatial-Temporal Pattern and Driving Forces of Land Use Changes in Xiamen,” Pedosphere, Vol. 16, No. 4, 2006, pp. 477-488. doi:10.1016/S1002-0160(06)60078-7
- B. Quan, M. J. M. Römkens, J. J. Tao, B. C. Li, C. K. Li and Q. C. Chen, “Spatial-Temporal Pattern and Population Driving Force of Land Use Change in Liupan Mountains Region, Southern Ningxia, China,” Chinese Geographical Science, Vol. 18, No. 4, 2008, pp. 323-330. doi:10.1007/s11769-008-0323-y
- B. Quan, M. J. M. Römkens, R. Li, F. Wang and J. Chen, “Effect of Land Use and Land Cover Change on Soil Erosion and the Spatio-Temporal Variation in Liupan Mountain Region, Southern Ningxia, China,” Frontiers of Environmental Science & Engineering in China, Vol. 5, No. 4, 2011, pp. 564-572. doi:10.1007/s11783-011-0348-9
- B. Quan, “Land Use Change in Northwest and Southeast China and Its Comparison,” China Environmental Press, Beijing, 2010.