Natural Science
Vol.5 No.6(2013), Article ID:32951,6 pages DOI:10.4236/ns.2013.56085
Temporal change assessment of agricultural land by Satellite Remote Sensing (SRS) technique
![]()
1Ain Zubaida Unit for Rehabilitation and Groundwater Research, King Abdulaziz University, Jeddah, KSA; *Corresponding Author: goharmahar@hotmail.com
2Department of Geography, Federal Urdu University of Art, Sciences and Technology, Karachi, Pakistan
Copyright © 2013 Gohar Ali Mahar et al. This is an open access article distributed under the Creative Commons Attribution License, which permits unrestricted use, distribution, and reproduction in any medium, provided the original work is properly cited.
Received 18 April 2013; revised 20 May 2013; accepted 27 May 2013
Keywords: Agriculture; Spatiotemporal; Satellite Remote Sensing (SRS); GIS; Landsat
ABSTRACT
Agriculture is the vital economic activity of rural society in nearly all of Pakistan. The WinderSonmiani area located at the Makran coast near the city of Hub in Pakistan is economically very promising. Cropping, horticulture, fruit farming and animal husbandry are the common land use activities in the area while fishing along the coast is an important economic activity. Owing to the use of the Satellite Remote Sensing technique (SRST), the triangular basin shape structure of the Winder area has been found to be spatially very promising for agricultural activities. Positive change in the use of agriculture land was detected from the Satellite images of different periods. Use of modern technology and incentives provided by the government have advanced improvement in agriculture.
1. INTRODUCTION
The spatial, temporal and spectral characteristics of the remote sensing data are effectively used in land use and land cover change mapping, hence helping in decision making for sustainable land resource management. Land use/land cover changes play a major role in the study of global change [1]. This paper is an attempt to define the spatial-temporal difference in the Winder area. This area is part of Balochistan, which is located between latitude 24˚53'N to 26˚42'N and longitude 65˚15'E to 67˚27'E (Figure 1). This area is physiographically known as the Porali basin that was developed by the alluvial deposits of the Porali River and its tributaries [2]. Rainfall is erratic and scanty [3] but a large catchment area provides enough water. Land is cultivated mainly by irrigation methods (pumping well system). Horticulture, rangeland and fish farming are common economic activities found there. Due to the area’s location, many industries were found nearby in a recent survey. The area is located near the coast and therefore fishing is one of the important economic activities observed. Almost all the people living near the coastal area are engaged in fishing activities.
The economy of the area studied is largely based upon the production of fruits, crops and the intake from fishes. Agricultural land use has been expanded in this area similar to the rest of the country [4]. Plantation facilities of the fruit farms and cultivation of crops by irrigation have been found to be important features. Use of rangeland for herded livestock is also very important. Beyond the limited farming in the east of the country fishing along the Arabian Sea coast is another type of income and sustenance for the local population. Conditions of economic activities are gradually improving but the region is still backward as compared to other parts of Pakistan.
Remote Sensing as a science has emerged as one of the most diversified subjects over the last four decades. Satellite Remote Sensing, with its unique capability of providing repetitive, dynamic and global coverage at high temporal and spatial resolution, is very useful for the analysis of changes taking place in the coastal areas [5]. The major advantage of GIS is that it allows identifying the spatial relationships between features and temporal changes within an area over time [6]. Experience has shown that many earth surface features of interest can be identified, mapped and studied on the basis of their spectral characteristics, although some features of interest may not be spectrally separable. To use Remote Sensing data effectively, one must know and understand the spectral characteristics of the particular features under investigation [7]. Remote Sensing data help in map-
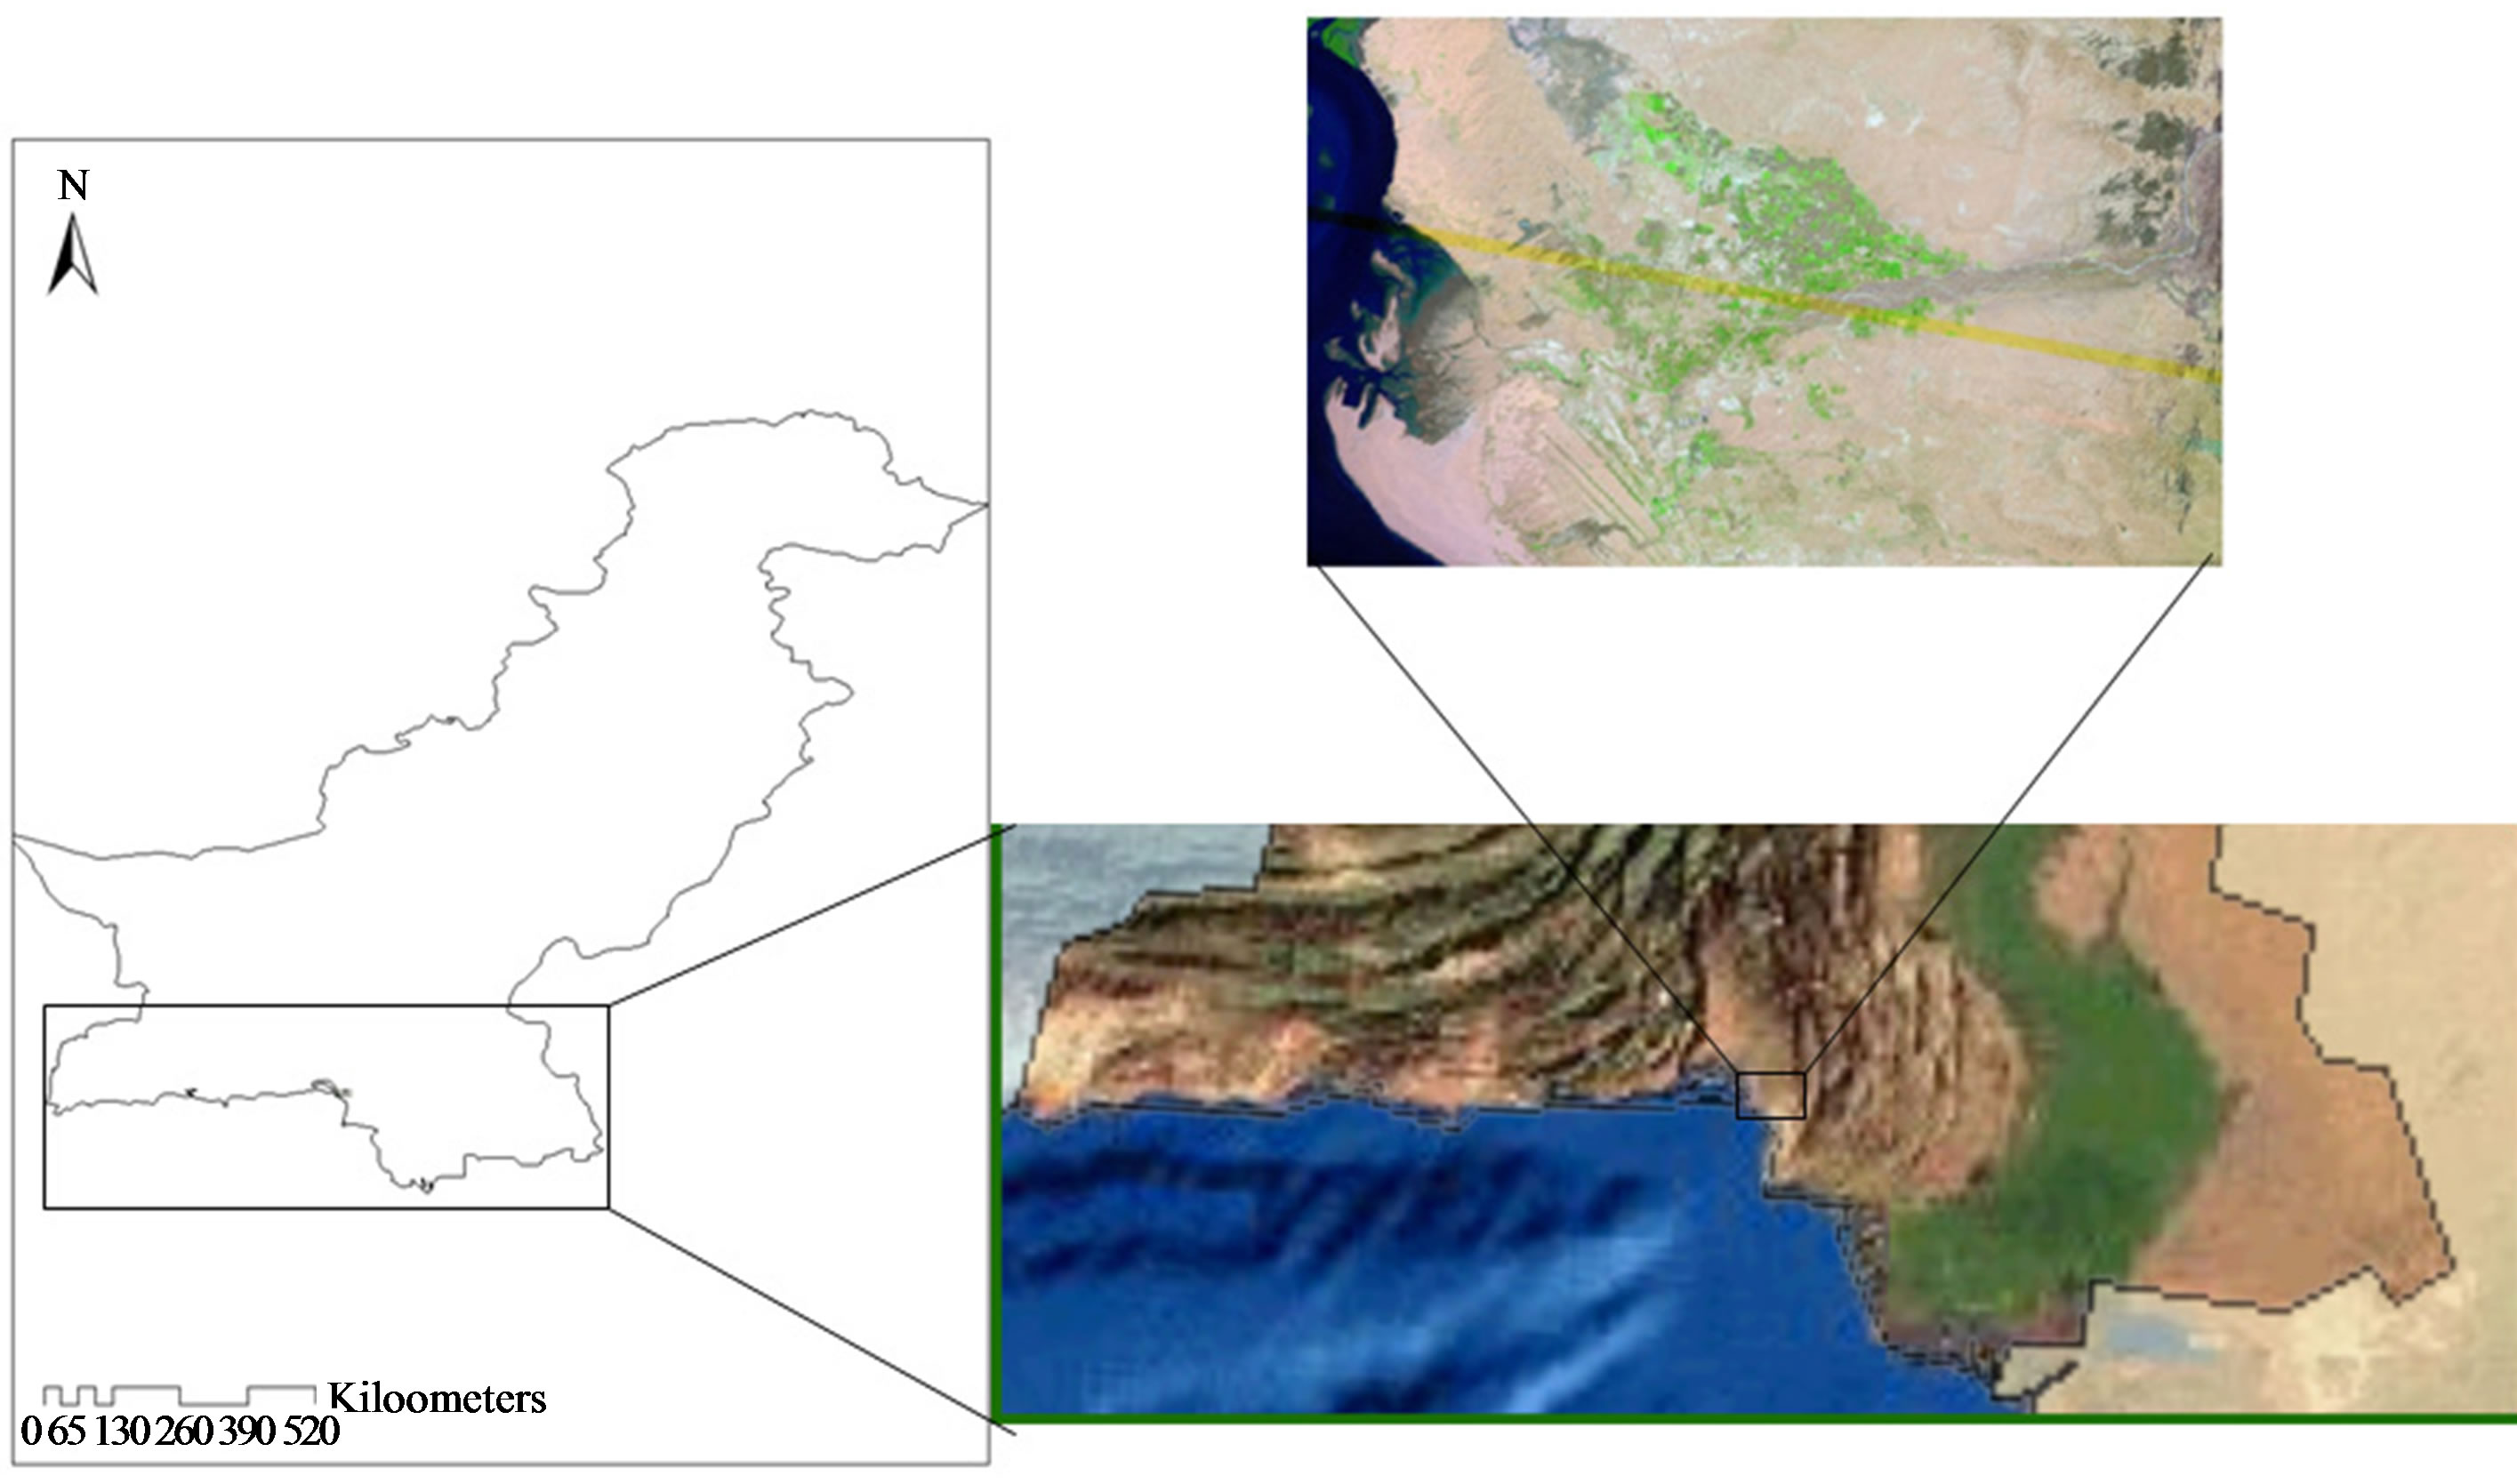
Figure 1. Aerial view and location of the study area.
ping land resources and management, especially in desert and mountainous areas where accessibility is limited [8]. Land cover and land use mapping are thus very important for evaluating the natural resources [9].
Satellite Remote Sensing, in conjunction with geographic information systems (GIS), has been widely applied and recognized as a powerful and effective tool in detecting land use and land cover change. It is also the suitable tool that extracts the satellite data and converts them into an attribute and spatial form and projects the required results in presentable shape [10-19].
The geographical location of Winder is important factor that could be viewed from many dimensions. Geographically this area is located near the south western margin of Balochistan. It is located about 90 km from the largest commercial city (Karachi) of the country. The location near the big city provides the market and employment that enhances the prosperity of the local population. Physiographically, this area is located in an alluvial basin which is called Porali Basin. Physiographic location along with the catchment areas and the alluvial basin provides the water resources. Proper resource exploitation and good management can boost the economy of the local community. Another important feature of the location is the proximity of the coast. The structural feature of the coast has a dual importance. It not only provides the supply for fishing but its special structure can provide the harbor. Use of the Miani Hor could be muiltidimension, i.e., sanctuary for mangroves, fish harbor or port. Long term planning and management of this area will have a decisive long term impact on the whole region.
2. METHODOLOGY
This study is carried out to evaluate the change in agricultural land. The Satellite Remote Sensing (SRS) technique is used to detect relevant changes. With this technique satellite images of different dates have been processed to detect the temporal difference. The following three images have been collected to evaluate the spatio-temporal changes (Figure 2):
• Landsat MSS image of 1978;
• Landsat ETM image of 2000;
• SPOT 5 image, 2008.
These images of three periods were used for image processing and analysis. The first step was the pre-processing of the original images. Initially, the images have been geo-referenced by using the Datum WGS 1984 and the Universal Transverse Mercator (UTM) projection in a projected coordinated system with first order transformation and re-sampled by the method of nearest neighborhood for display. After this operation, subsets for the study area were extracted from original full scene images.
In the second step three bands were selected for each image. Bands 1, 2 and 4 were selected from a Landsat MSS image and Bands 2, 3 and 5 were selected from Landsat ETM. A SPOT image collected was already composed of three bands 1, 2 and 3. The segregated bands of the each image have been composed into False Color Composite (FCC) image in .img format. Standard deviation stretching was applied from each data set.
Land use classes are typically mapped from available satellites data through the process of supervised digital image classification [20,21]. Supervised classifications of images have been processed with the help of ground truthing information and digital topographic maps of the study area. For the accuracy and assessment more than 55 locations have been marked as identified objects from the field by using Global Positioning System (GPS). The

Figure 2. Figure shows the steps carried out in satellite Remote Sensing Technique.
area has been simply classified into three categories to achieve the targeted objective. Images have been categorized into cultivated area, rangeland and silt & sand.
Use of the Geographical Information System (GIS) with the application of computer aided technology was also useful in this study. With the help of this tool the selected and classified images were used for the mapping of the study area. All these images collectively provided the detailed information. Topographic map of 1:50,000 scale were also taken in consideration for correlation studies. Themes of the maps were based on categories of classified images because the main objective was to calculate the area from them. The area of the selected classes was calculated by using the Visual Basic Application (VBA) in Arc GIS 9.3. The software used for data compilation is Arc GIS 9.3, Erdas Imagine 8.7, Adop Photoshop and Excel.
3. AGRICULTURE IN WINDER
Land use survey was conducted for retrieving the relevant grass root level data of the study area and ground truth survey was conducted for verification of objects identified on images. Location, physiography, climatic conditions and vegetation collectively define this area as very promising for land use activities. The development of land use activities in this area depends on indigenous resources. Therefore traditional types of land use activities were observed during the survey in question. During a concurrent field survey of the study area many types of land use activities were observed.
1) Irrigated cropping;
2) Fruit farming;
3) Rangeland.
Irrigated fields are the smallest but most productive areas used for crop farming. Water is lifted from a well or supplied by a pump to the field through a series of gravity-fed channels. Many electrically-powered pumps were seen at survey sites on the edges of villages with electricity supplied by the government.
Fruit farming is one of the major prominent features found at Winder. It is also one of the most productive economic activities, because it provides a reasonable return to the farming community. Guavas, Bananas, Papayas, Mangoes, Sapodilas and Dates are commonly produced.
Grazing and Browsing of livestock is a common feature of rural society. Breading of farm animals is the basic but dominant profession in the rural society of Balochistan, especially in our study area. The Porali basin is a very productive area and about more than half of its land is used as range land. Grazing and browsing of herded livestock were commonly seen during the survey. Herders mostly went to graze their animals in the proximity of irrigated land, so that they could perform their work within a day.
4. RESULTS AND DISCUSSION
The town of Winder is located near the coast of Miani. We can see in the satellite view of the study area (Figure 1) that cultivated area is irrigated by the Winder River. This river is developed by contributories flow from the catchment areas in the north-east of the study area, where Piaro and More Ranges are located, while the Pub range is located on the east. The eastern, north-eastern and south-eastern parts of the study area are covered by small ranges while the western and southern parts are bordered by the Arabian Sea. Many features are seen in the coastal area, where the Winder River is emptied into the sea and forms an estuarine delta. The North and south of the delta are covered by sand dunes. Some patches of the mangrove vegetation are also found near the coast. The rest of the area is covered by range land. The plain area is part of the Porali basin which is formed by the Porali River and its tributaries which are drained into the Miani Hor [22].
The satellite views of the study area (Figure 1) show the land classes of the Winder basin. Figures 3-5 show the classified images of periods 1978, 2000 and 2008 respectively. Range land, cultivated area, sand and silt are the main characteristics of the study area.
The main objective of the study was to calculate the change of cultivated land area during the years 1978, 2000 and 2008 and thus evaluate the temporal difference during the periods mentioned. In 1978, 4146 acres of land were under cultivation while in 2000 it had been increased to 17,952 acres and that further increased to 23,846 acres in 2008 (Table 1). Initially, in 1978, 2.54% of the whole area was under cultivation which increased to 10.74% (about four times) of the earlier period in 2000 and to about 11.51% increase as observed in 2008.
The adverse effect were seen on the range land that was covered by 96,883 acres in 1978 and 85,750 acres in
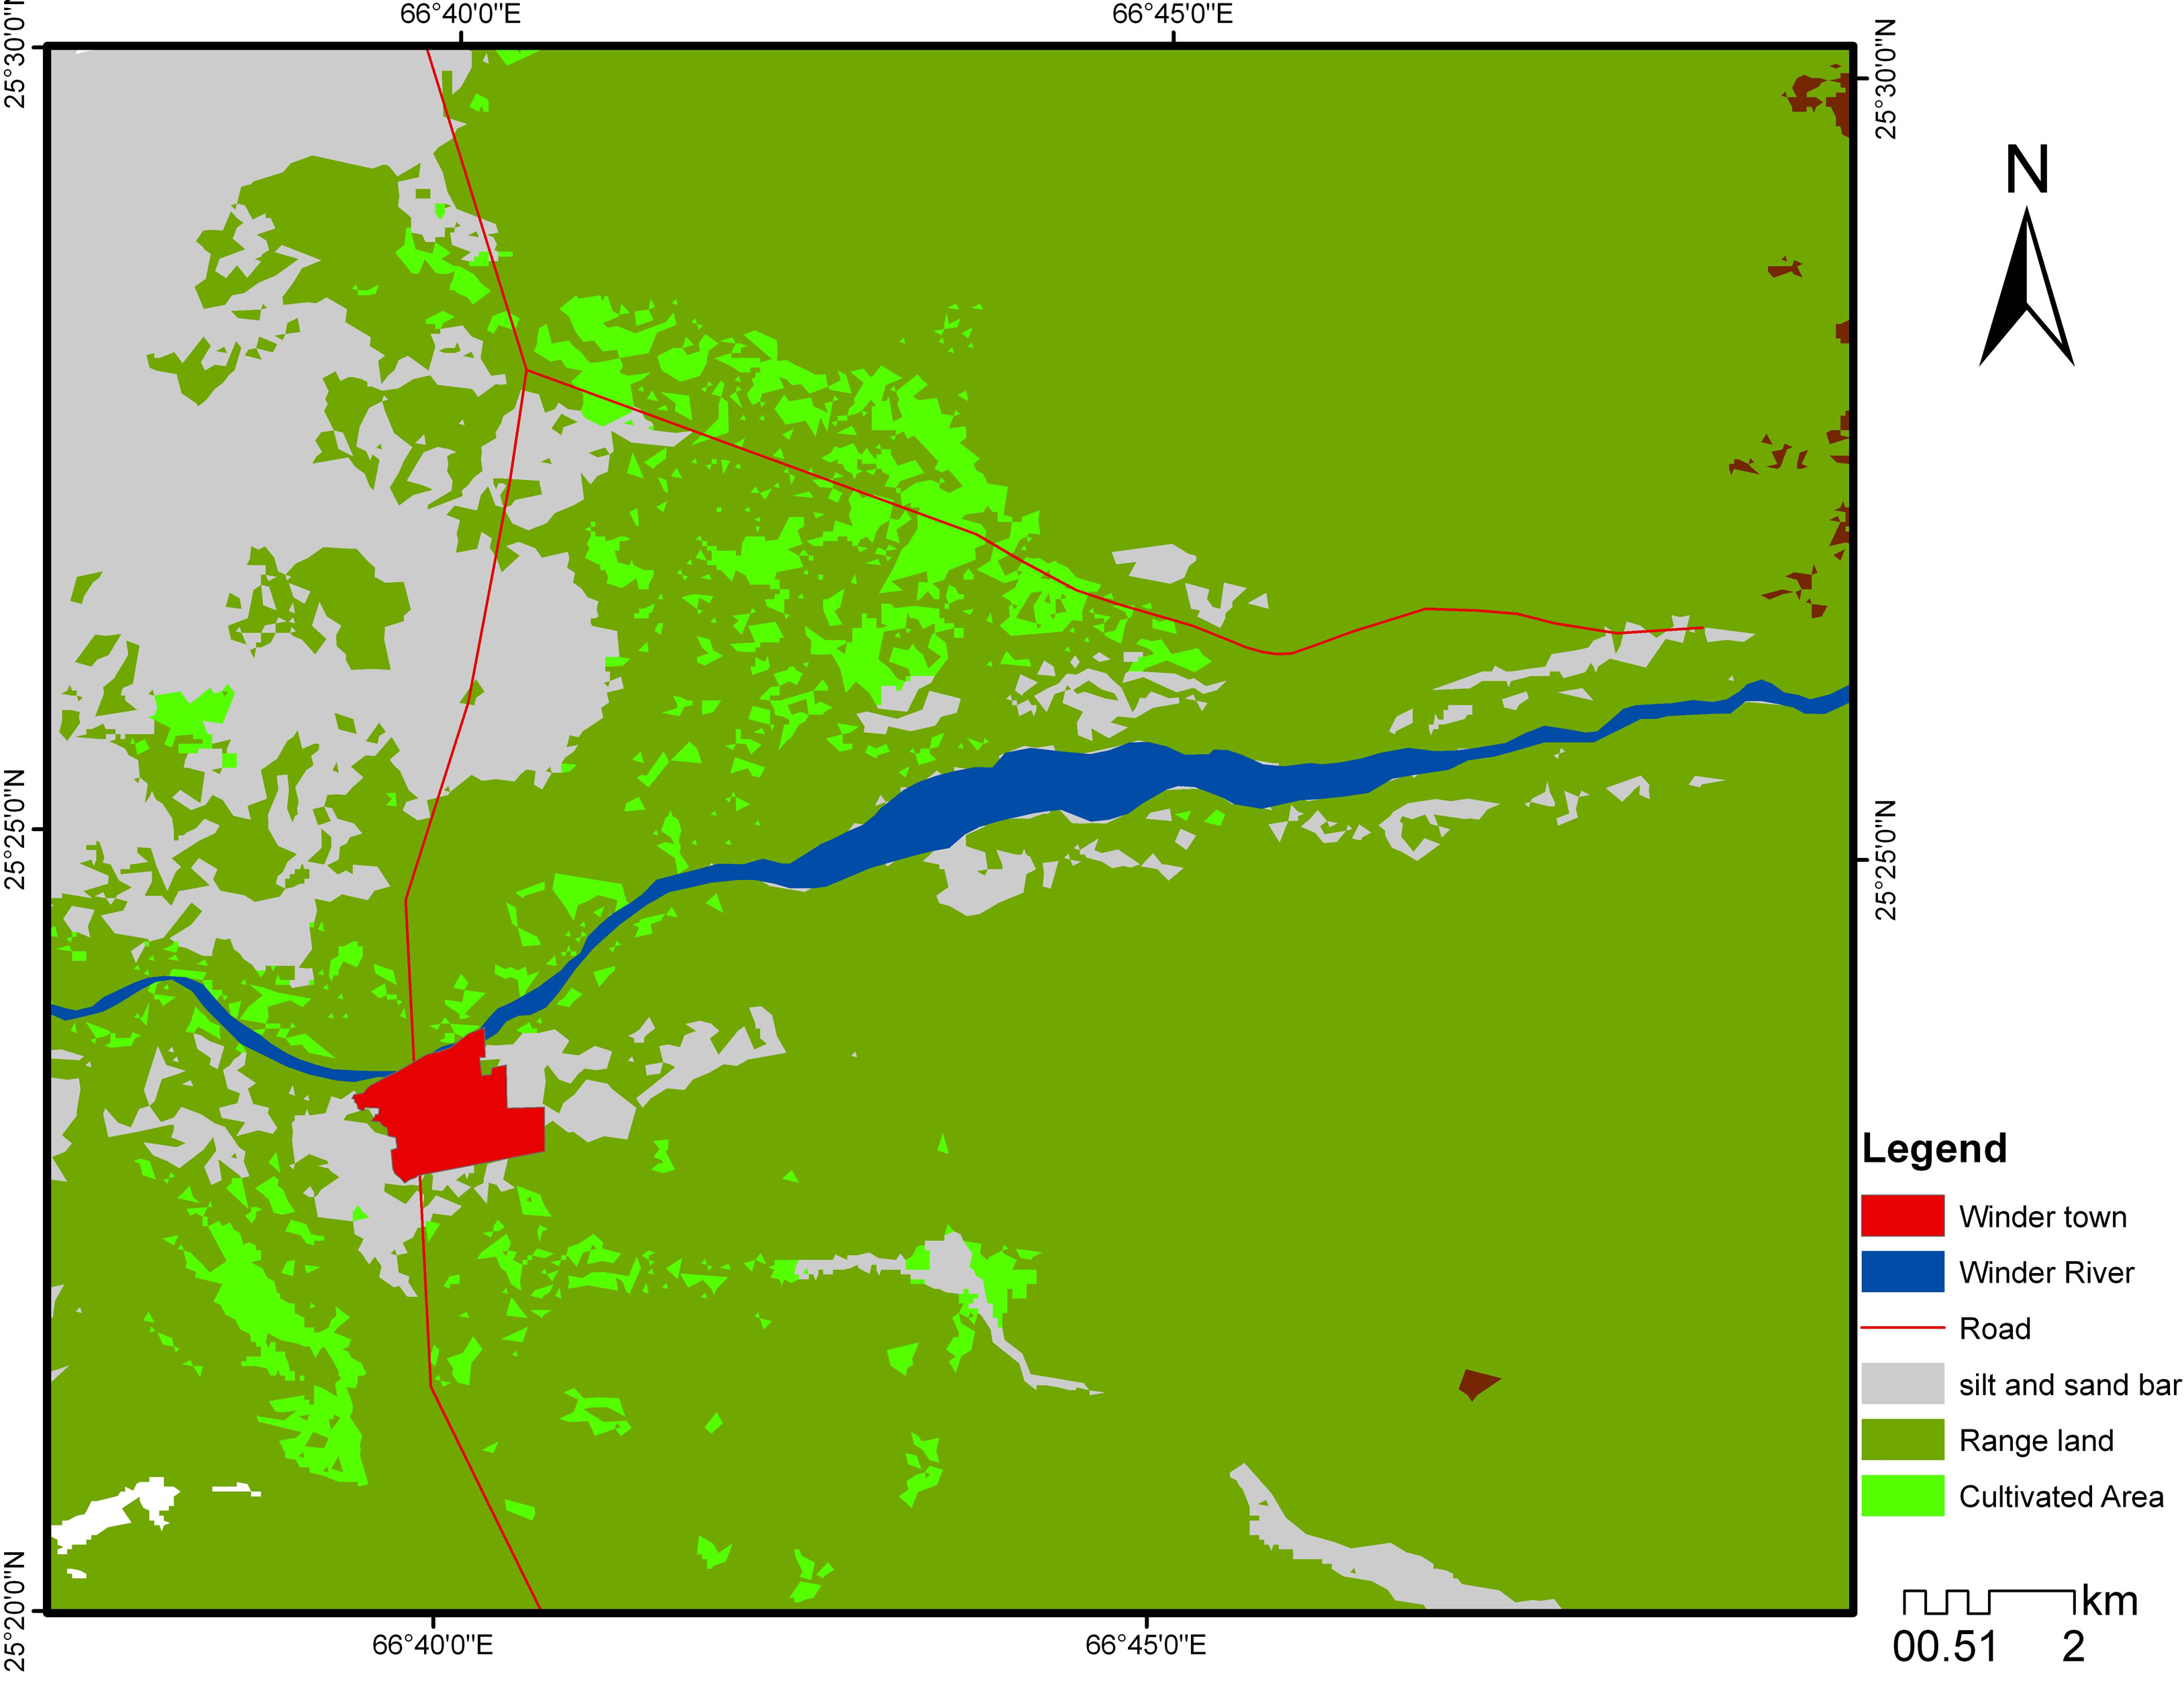
Figure 3. Figure shows the classified image developed from Land sat MSS dated 1972.
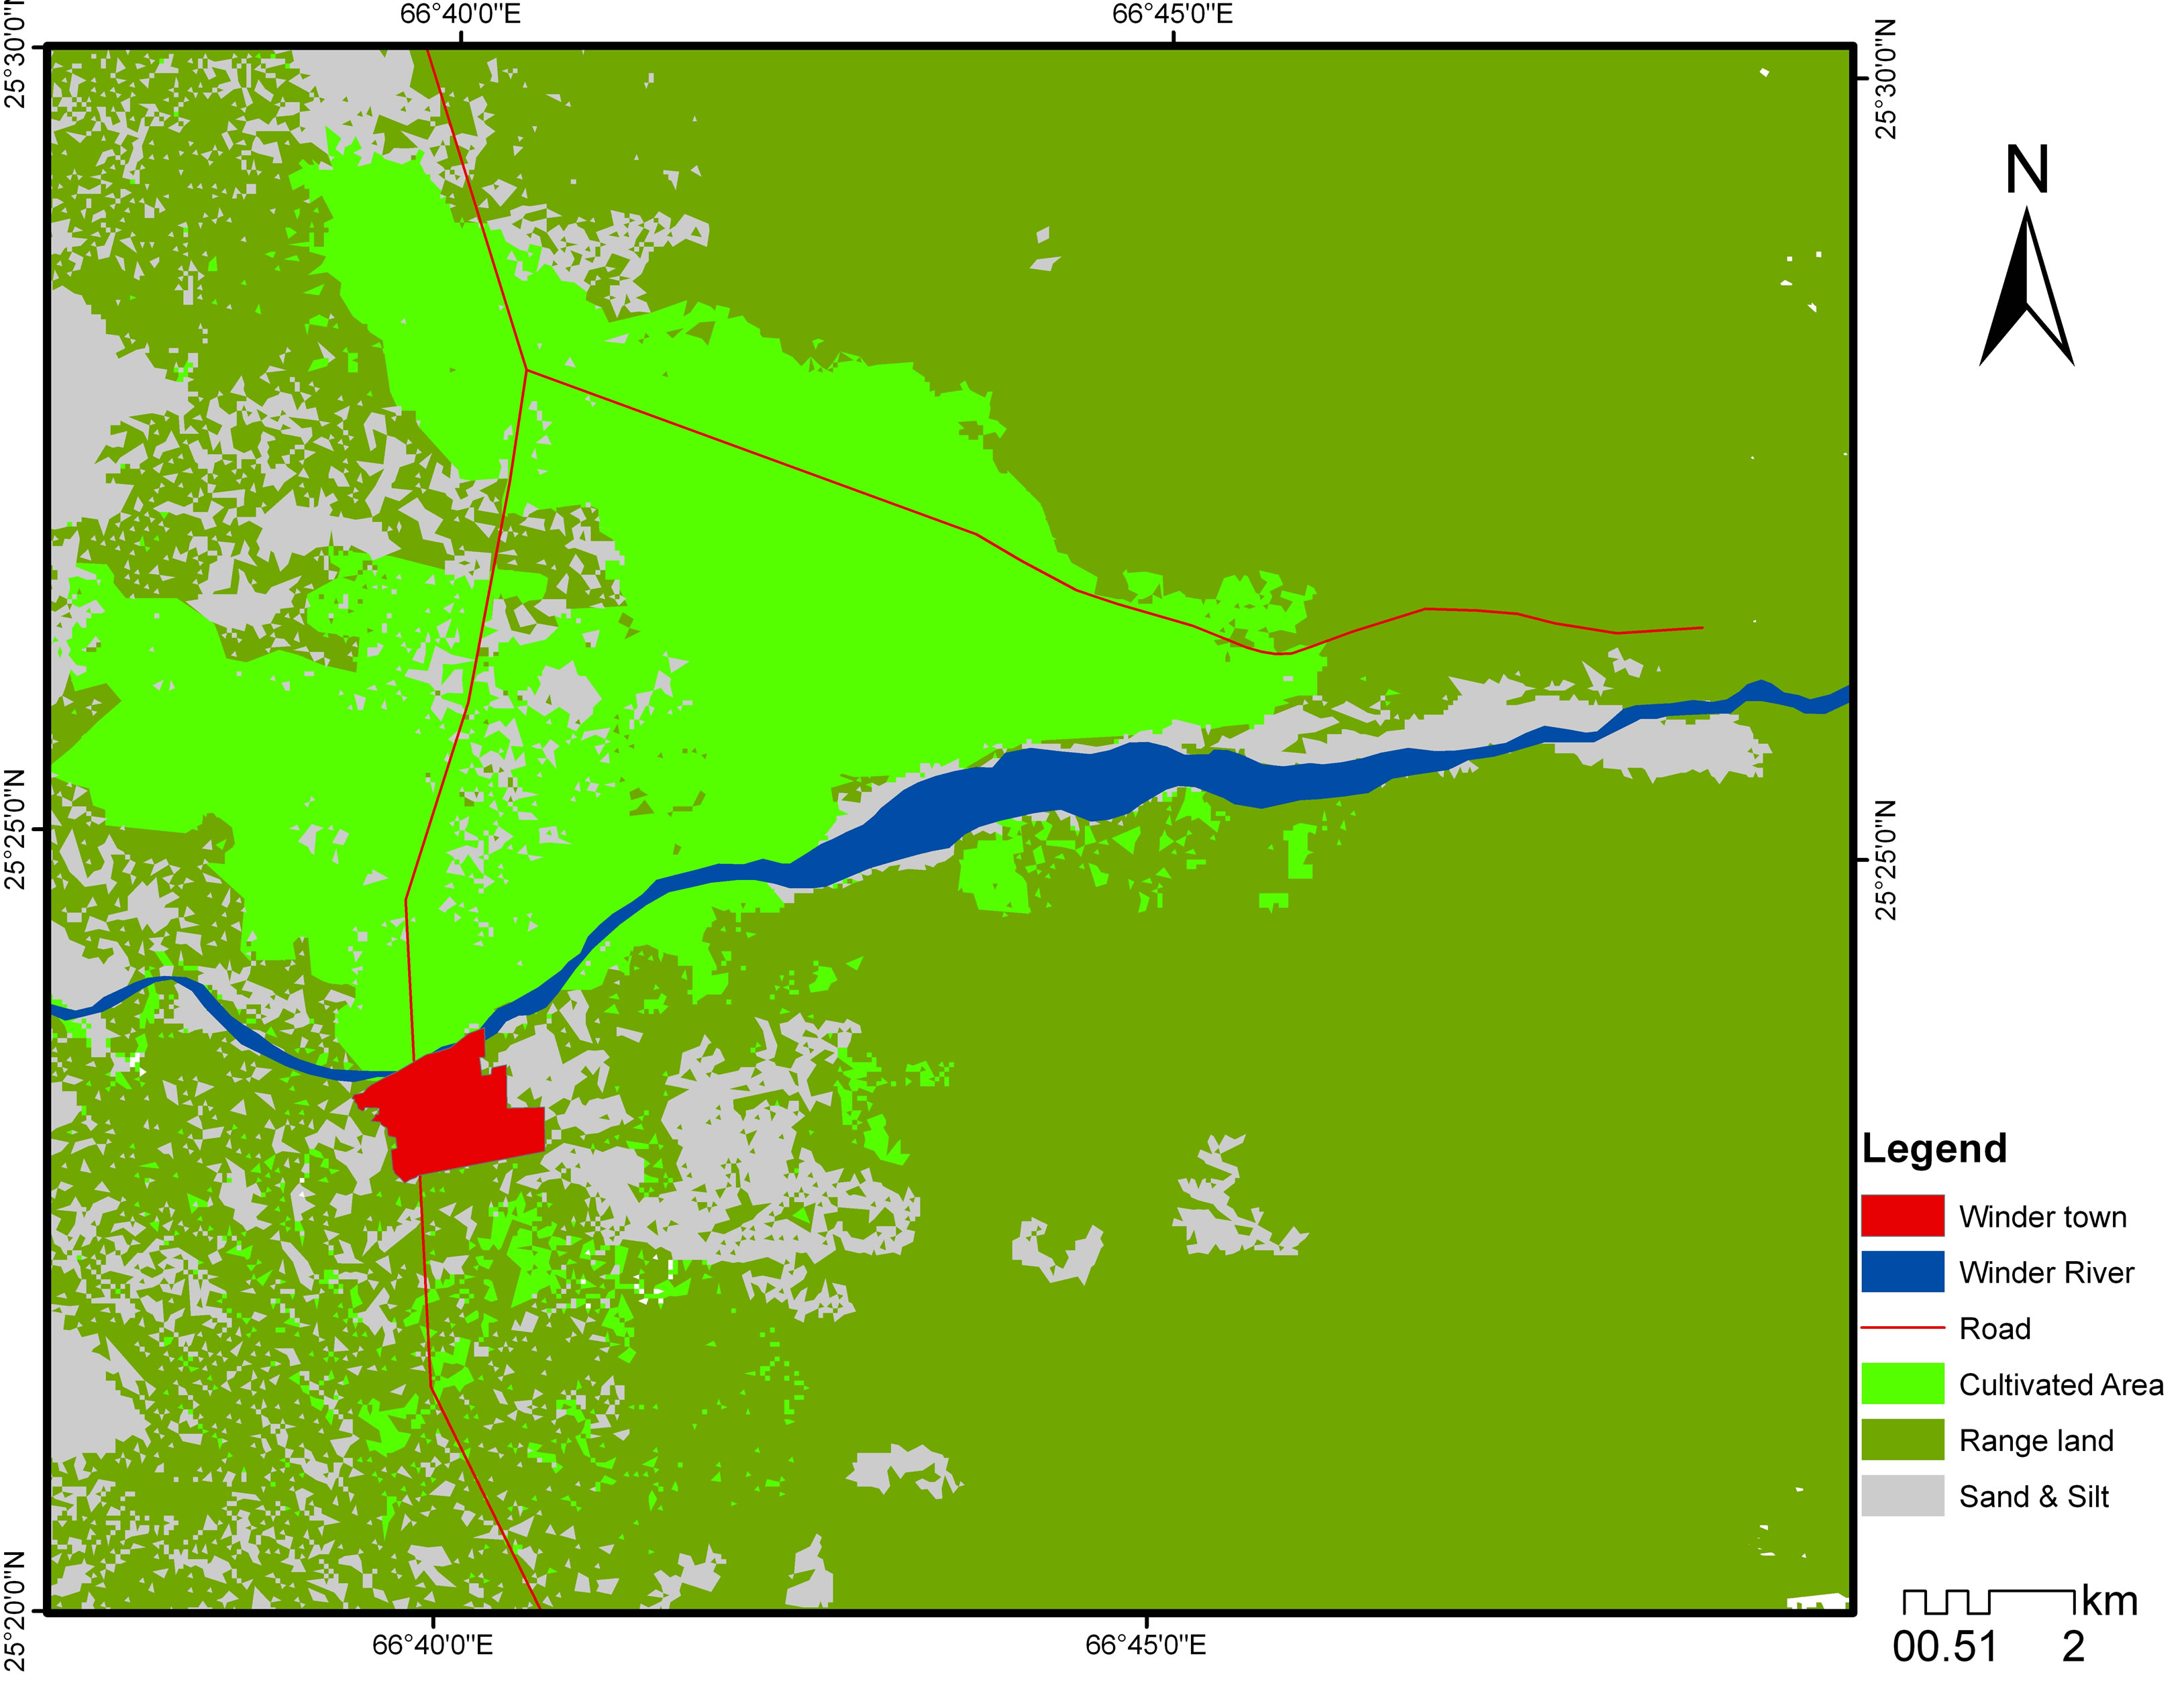
Figure 4. Figure shows the classified image developed from Land sat ETM dated 2000.
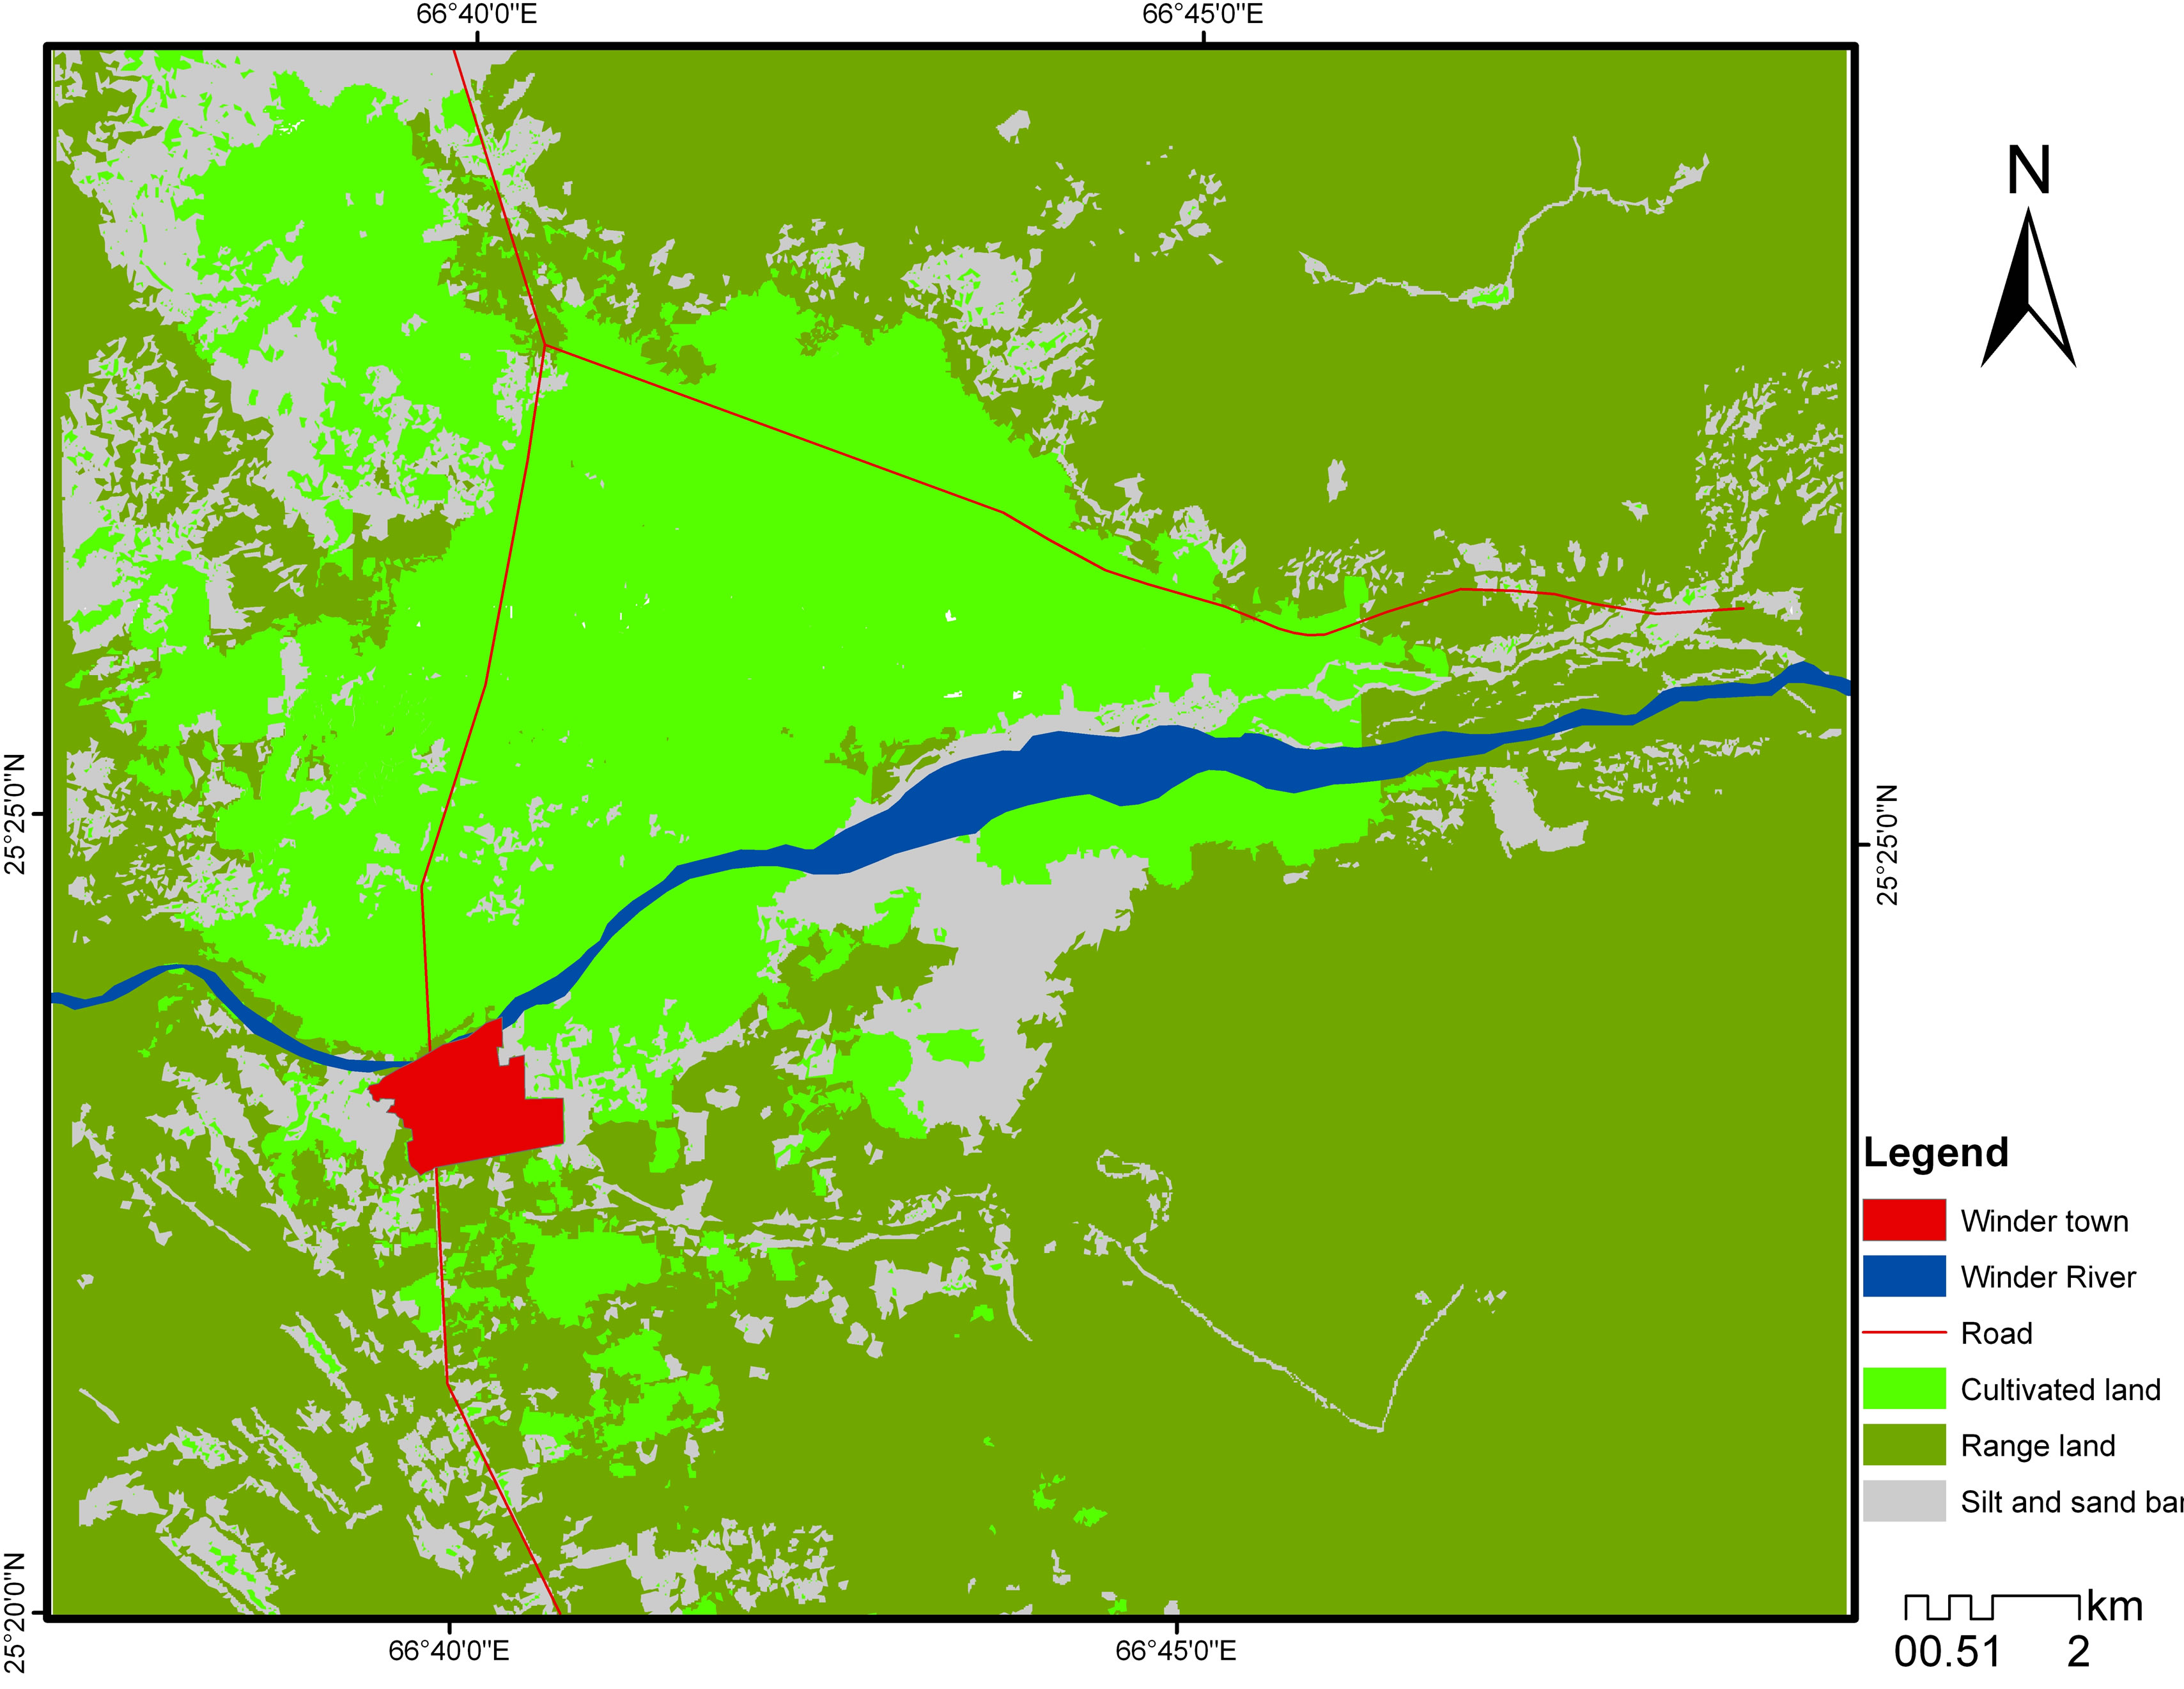
Figure 5. Figure shows the classified image developed from SPOT dated 2008.
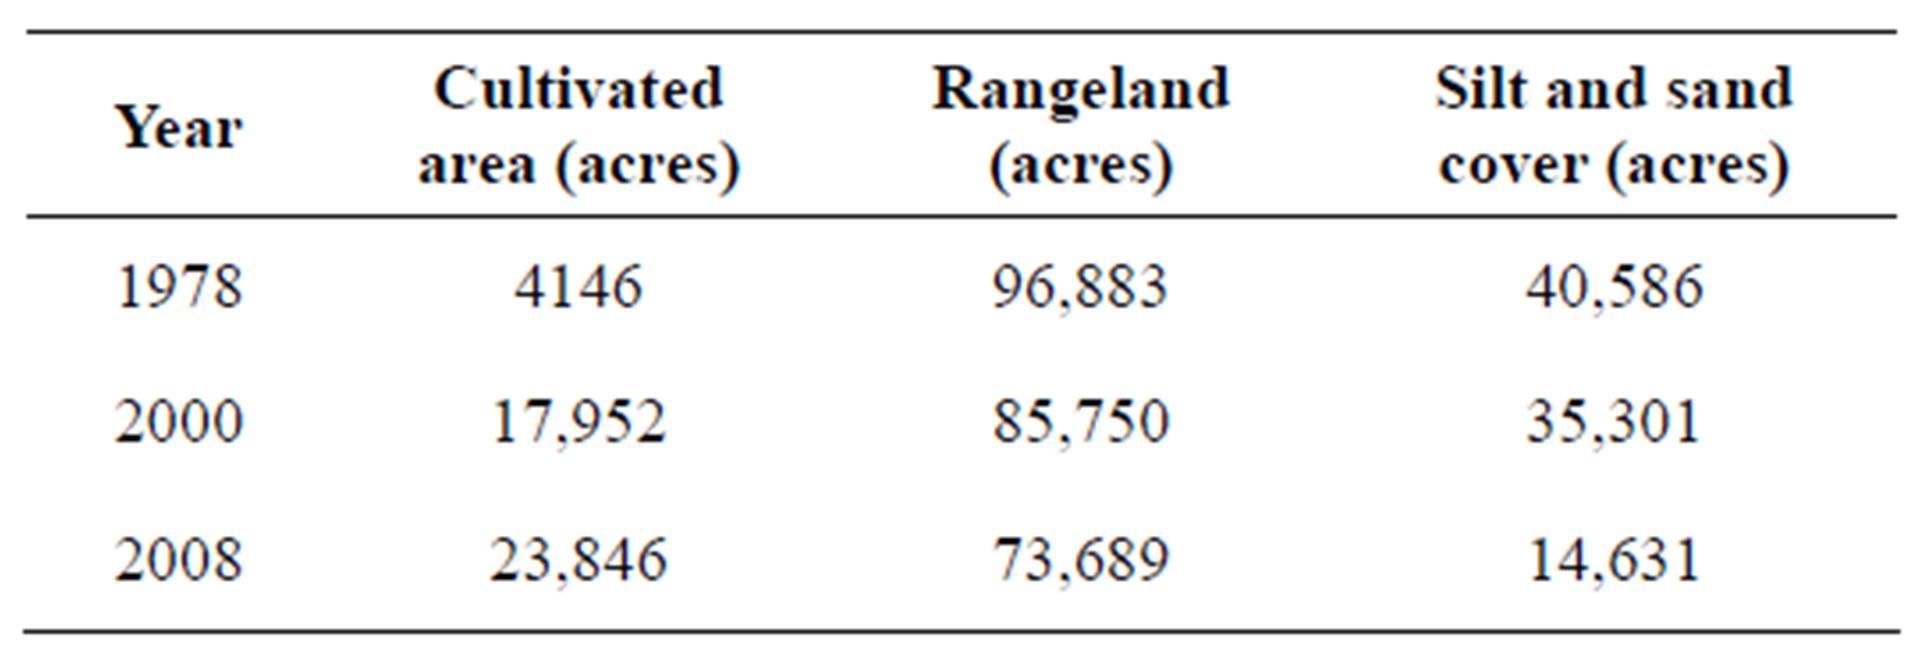
Table 1. Varying statistics of Winder land use related to its area in acres.
2000 and 73,689 acres in 2008, which means that 60.27% of the study area was covered by range land in 1978 which decreased to 53.36% in 2000 and further decreased to 48.56% in 2008. It is concluded that 8.97% of the cultivated area has increased and 11.71% of the range land decreased, which has almost been replaced by cultivated land.
In this study, the spatiotemporal difference in agricultural land use has been determined. The SRS technique was used to evaluate the difference in agriculture land use during different time periods. The study area was divided into three main classes. The spatiotemporal difference in cultivated areas in the last 30 years seems to be encouraging from the results. About 20,000 acres of land for cultivation has increased during this period, while the range land area has decreased by about 2000 acres and the area covered by silt and sand has continuously decreased as it is being replaced by cultivated land.
REFERENCES
- Al Mashagbah, A., Al-Adamat, R. and Al-Amoush, H. (2012) GIS and remote sensing to investigate urban growth in Mafraq City/Jordan between 1987 and 2010. Journal of Geographic Information System, 4, 377-382. doi:10.4236/jgis.2012.44043
- Spate, O.H.K. (1956) India and Pakistan. Methuen, London.
- Khan, J.A. (1993) The climate of Pakistan. Rahber Publishers, Karachi.
- Alizai, M.Y. (1998) Unused agricultural land of Pakistan and its spatial distribution. In: Israr-ud-Din, Ed., Studies in Pakistan Geography, University of Peshawar, Peshawar.
- Siddiqui, M.N., Jamil, Z., Aziz, A. and Ahmed, J. (1993) Application of satellite data to the study and mapping of land accretion and erosion in the coastal areas of Pakistan. Proceeding of Pak-US Conference on the Arabian Sea Living Marine Resources and the Environment, Karachi, 1993, 555-573.
- Vinayaraj, P., Johnson, G., Udhaba Dora, G., Sajiv Philip, C., Sanil Kumar, V. and Gowthaman, R. (2011) Quantitative estimation of coastal changes along selected locations of Karnataka, India: A GIS and remote sensing approach. International Journal of Geosciences, 2, 385-393. doi:10.4236/ijg.2011.24041
- Panah, S.K.A. and Goossens, R. (2001) Relationship between the landsat TM, MSS DATA, and soil salinity. Journal of Agriculture Science and Technology, 3, 21-31.
- Panah, S.K.A. (2004) Behavior of landsat thematic mapper wavebands on Lut Desert (Iran). Journal Agriculture Science and Technology, 6, 31-40.
- Panah, S.K.A., et al. (2001) Use of TM thermal band for land cover and land use mapping in two different environmental conditions of Iran. Journal Agriculture Science and Technology, 3, 27-36.
- Ehlers, M., Jadkowski, M.A., Howard, R.R. and Brostuen, D.E. (1990) Application of SPOT data for regional growth analysis and local planning. Photogrammetric Engineering & Remote Sensing, 56, 175-180.
- Meaille, R.L. (1990) Wald, using geographic information system and satellite imagery within a numerical simulation of regional urban growth. International Journal of Geographic Information System, 4, 445-456. doi:10.1080/02693799008941558
- Treitz, P.M., Howard, P.J. and Gong, P. (1992) Application of satellite and GIS technologies for land-cover and land-use mapping at the rural-urban fringe: A case study. Photogrammetric Engineering & Remote Sensing, 58, 439-448.
- Westmoreland, S. and Stow, D.A. (1992) Category identification of changed land-use polygons in an integrated image processing geographic information system. Photogrammetric Engineering & Remote Sensing, 58, 1593- 1599.
- Harris, P.M. and Ventura, S.J. (1995) The integration of geographic data with remotely sensed imagery to improve classification in an urban area. Photogrammetric Engineering & Remote Sensing, 61, 993-998.
- Yeh, A.G.O. and Li, X. (1996) Urban growth management in the Pearl River Delta—An integrated remote sensing and GIS approach. The ITC Journal, 1, 77-85.
- Yeh, A.G.O. and Li, X. (1997) An integrated remote sensing-GIS approach in the monitoring and evaluation of rapid urban growth for sustainable development in the Pearl River Delta, China. International Planning Studies, 2, 193-210. doi:10.1080/13563479708721678
- Yeh, A.G.O. and Li, X. (1999) Economic development and agricultural land loss in the Pearl River Delta, China. Habitat International, 23, 373-390. doi:10.1016/S0197-3975(99)00013-2
- Weng, Q. (2001) A remote sensing-GIS evaluation of urban expansion and its impact on surface temperature in the Zhujiang Delta, China. International Journal of Remote Sensing, 22, 1999-2014.
- Weng, Q. (2002) Land use change analysis in the Zhujiang Delta of China using satellite remote sensing, GIS and stochastic modeling. Journal of Environmental and Management, 64, 273-284. doi:10.1006/jema.2001.0509
- Cambell, J.B. (1987) Introduction to remote sensing. Guilford Press, New York.
- Thomas, I.L., Ching, M.P. and Benning, V.M. (1987) A review article of multi-channel indices of class reparability. International Journal of Remote Sensing, 8, 331-350. doi:10.1080/01431168708948645
- Ahsanullah (1974) Landform and drainage basins in Karachi region. In: Master Plan for Karachi Metropolitan Region, Karachi Development Authority, Karachi.