Natural Science
Vol.5 No.1(2013), Article ID:26556,9 pages DOI:10.4236/ns.2013.51004
Novel strategy to diagnose and grade hepatocellular carcinoma
![]()
1Department of Pathology, King Edward Medical University, Lahore, Pakistan; #Corresponding Author: mehboob.riffat@gmail.com
2Center for Research in Molecular Medicine, University of Lahore, Lahore, Pakistan
Received 31 October 2012; revised 30 November 2012; accepted 14 December 2012
Keywords: P53; AgNOR; Hepatocellular Carcinoma; Cirrhosis; Immunohistochemistry
ABSTRACT
Hepatocellular carcinoma (HCC) is among the most common malignancies worldwide, particularly in South and South East Asia. Unfortunately due to lack of appropriate facilities and awareness only limited information is available about its early diagnosis. Aim of the present study was to determine the efficacy of p53 by immunohistochemistry and Argyrophilicnucleolar organizer regions (AgNORs) in diagnosis of HCC and cirrhosis of liver. A total of 100 liver biopsies were studied, it included 20 cases of HCC, 60 cases of cirrhosis of the liver and 20 cases of normal liver from autopsy specimens as a control. Out of 20 cases of HCC, 15 were positive for p53 stain and 5 were negative. None of the 60 cases of cirrhosis or 20 with normal histology revealed p53 expression. A statistically significant (p < 0.001) difference was observed between mean AgNOR counts of normal (1.57 +/− 0.13), cirrhotic (4.70 +/− 0.66) and HCC tissues (14.96 +/− 1.18). In contrast the mean AgNOR count of biopsies with alcoholic cirrhosis (1.57 +/− 1.62) was significantly less (p < 0.001) than post-hepatitic cirrhosis and was similar to that of normal liver tissue. AgNORs differentiates post-hepatitic and alcoholic cirrhosis. HCV and HBV were found to be the main causative agents in HCC and Cirrhosis of liver. Mean age of HCC patients was slightly higher than liver cirrhosis patients. It is concluded that p53 and AgNORs can act as a good adjuvant to histology in diagnosing liver diseases. It helps in differentiation from well differentiated to moderately and to poorly differentiated HCC.
1. INTRODUCTION
Tumors and pseudotumors of the liver are a heterogeneous group of neoplasm which includes 60% of malignant tumors [1]. Hepatocellular carcinoma (HCC) is one of the ten most common malignant tumors worldwide [2]. Its incidence varies considerably with the geographic location because of the difference in major contributing factors [3]. HCC is prevalent in Asia particularly in South-East Asia and Southern Africa [4]. Annual mortality rate of HCC is approximately 650,000; among these two third live in Asia [5]. Recently, there is also rising incidence of HCC in United States, Canada and Southern Europe [6,7]. Mongolia is one of the countries with highest incidence of 54.1 cases per 100,000 people worldwide [8], since 1982 [9]. Contributing risk factors for the development of HCC include male sex [10], older age [10]; obesity, diabetes, heavy alcohol consumption and smoking; Hepatitis B/C (HBV/HCV) infections [11] and clinical factors (cirrhosis, elevated alpha-fetoprotein (AFP) and alanine aminotransferase (ALT) [12].
Medical history, physical examination and enzymology fail to give positive results. Testing for Alphafetoprotein (AFP) serum levels and imaging techniques are useful tool for early detection and diagnosis [9,13]. But even then it’s not possible to make accurate distinction between benign and malignant lesions [14]. Most suspicious liver nodules are approached by means of fine needle aspiration biopsy or cytology [15]. However, hyperplastic liver cell nodules, liver cell adenoma and welldifferentiated hepatocellular carcinoma cannot be differentiated with accuracy in aspiration smears there by necessitating proper histological examination [16].
Liver biopsy is an important diagnostic procedure world over. It helps in initial morphological diagnosis of hepatocellular carcinoma and distinguishes hepatocellular carcinoma from suspected metastatic neoplasm [17]. Immunohistochemically studies are also possible to distinguish hepatocellular carcinoma from non-neoplastic lesions [18] and HCC from metastatic neoplasm when each is poorly differentiated. Histochemical and immunohistochemical analysis of malignant tissue is one approach used to screen for the presence of malignancy [19], staining of Argyrophilic Nucleolar Organizer Regions (AgNORs) is another valuable technique to differentiate between well differentiated and poorly differentiated tumors of varying histogenesis [20].
P53 acts as a tumor suppressor gene in two ways both reversible (arrest in G1 phase of cell cycle) and irreversible (apoptosis). It mediates important cellular functions such as cell cycle regulation, apoptosis, DNA repair and senescence under normal physiological conditions but is downregulated in several malignancies including HCC [21]. p53 is located in the short arm of chromosome 17 [22], which, encodes for 53 KDa cell regulator nuclear phosphoprotein [23]. p53 plays an important growth controlling role in stressed cells induced by oncogenic assault and DNA damage caused by genetic factors, X-rays or drugs. It will increase the expression of p53 and arrest the cells in cell cycle until the damage is repaired [24]. Alteration to the p53 gene allows cells without appropriate DNA repair to progress along the S-phase, leading to the propagation of genetic alteration [25].
Nucleolar organiser regions (NORs) are loops of DNA that are responsible for ribosomal RNA (rRNA) transcription. They are located in the nucleoli of cells and in the chromosomes 13 - 15 and 21, 22 in association with proteins [26]. As rRNA molecules are the main sites of protein synthesis, it follows that the number of NORs in each cell nucleus reflects cellular activity [27]. The number and size of AgNORs can be assessed following staining of tissues or cells with silver stains [28]. AgNORs correlate with the proliferative activity of neoplasms. Increased AgNOR counts may reflect increased proliferative activity of cells [29].
AgNOR increasingly applied in histopathology research following suggestions that there may be a possible association between high AgNOR counts and malignant transformation [29]. It is interesting to hypothesize, therefore, that the numbers, the shape, and the distribution of AgNORs within the nucleus might be of potential use in predicting behavior in different carcinomas [30]. In this study, we investigated the usefulness of the AgNOR technique in assessing the diagnostic value in HCC and to differentiate from well differentiated to poorly differentiated carcinoma.
The present work was carried out to study p53 and AgNOR as a tumor maker in the diagnosis of malignancies of the liver and to see the silver staining of nucleolar organizer regions in cirrhosis of the liver and hepatocellular carcinoma.
2. MATERIAL AND METHODS
2.1. Sampling and Data Collection
The present study included 100 liver biopsies, 80 liver biopsies of patients with clinical suspicion of cirrhosis and/or hepatocellular carcinoma and 20 autopsy specimens without any history of liver disease were taken as control. The specimens were collected from Sir Ganga Ram Hospital and Mayo Hospital Lahore. Patients were included in the study irrespective of age and sex (Table 1). Main etiological factors for HCC and cirrhosis in our study were HCV and HBV infection and other factors included alcohol consumption, diabetes and obesity (Table 2). Most of the patients suffering from cirrhosis of the liver presented with chronic liver disease (CLD) and some with hepato splenomegaly while patients with heaptocellular carcinoma presented mostly with chronic liver disease as well as mass abdomen (Figure 1). Written informed consent (in Urdu and English) was obtained from all patients (or the relative) before the biopsy was taken. This study was in accordance with the Declaration of Helsinki. Approval for the study was obtained from the review board of ethical committee of the University, Lahore [31]. The biopsy in this study included needle core biopsy, wedge biopsy and fine needle aspiration biopsy. Properly labeled needle core and wedge biopsies were received in 10% buffered formalin from the wards along with the relevant clinical data, whereas ultrasound guided fine needle aspiration biopsies were got done from radiology department of Sir Ganga Ram Hospital Lahore.
2.2. Tissue Processing
Tissues were processed in an automatic processor for 22 hours according to the following scheme. The sections after placing in ascending grades of alcohol, i.e. 70%, 90% and absolute alcohol for 3 hours each, were given four washings of absolute alcohol, first two for one hour each and next two for two hours each. The tissues were then given two changes of xylene for 2 hours each. The tissues were then placed in wax bath for 3 hours to complete the tissue processing. Embedding of tissues was done in paraffin wax using L-shaped metal moulds. Each block was cut into multiple sections of 4 µm thickness on a rotary microtome. Sections were taken on glass slide using APES (3-ammino propyltriethoxysilane) as adhesive. Minimum of nine to twelve slides were prepared from each block. All the slides were divided into three batches and were stained for Haematoxylin-Eosin, p53 and AgNOR.
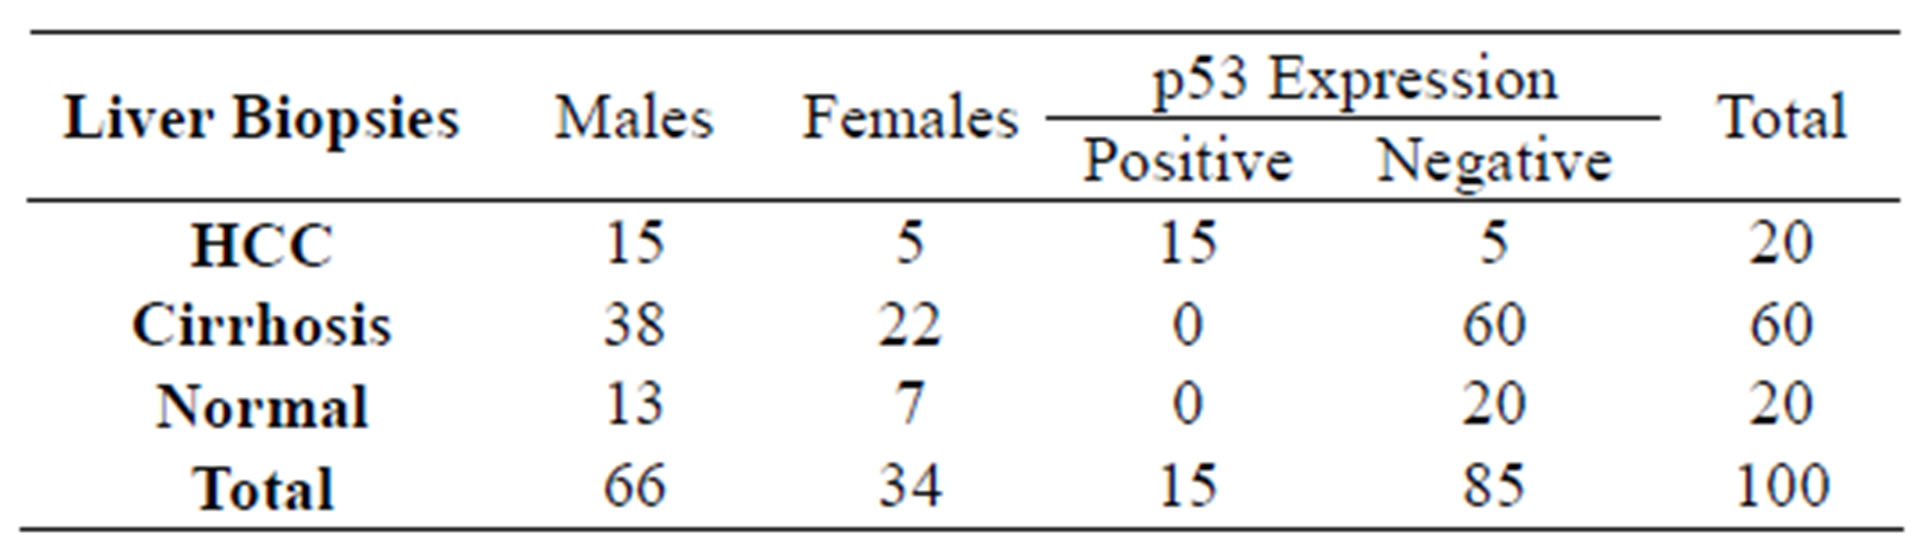
Table 1. Demographic and Immunohistochemical expression of p53 in different liver biopsies.
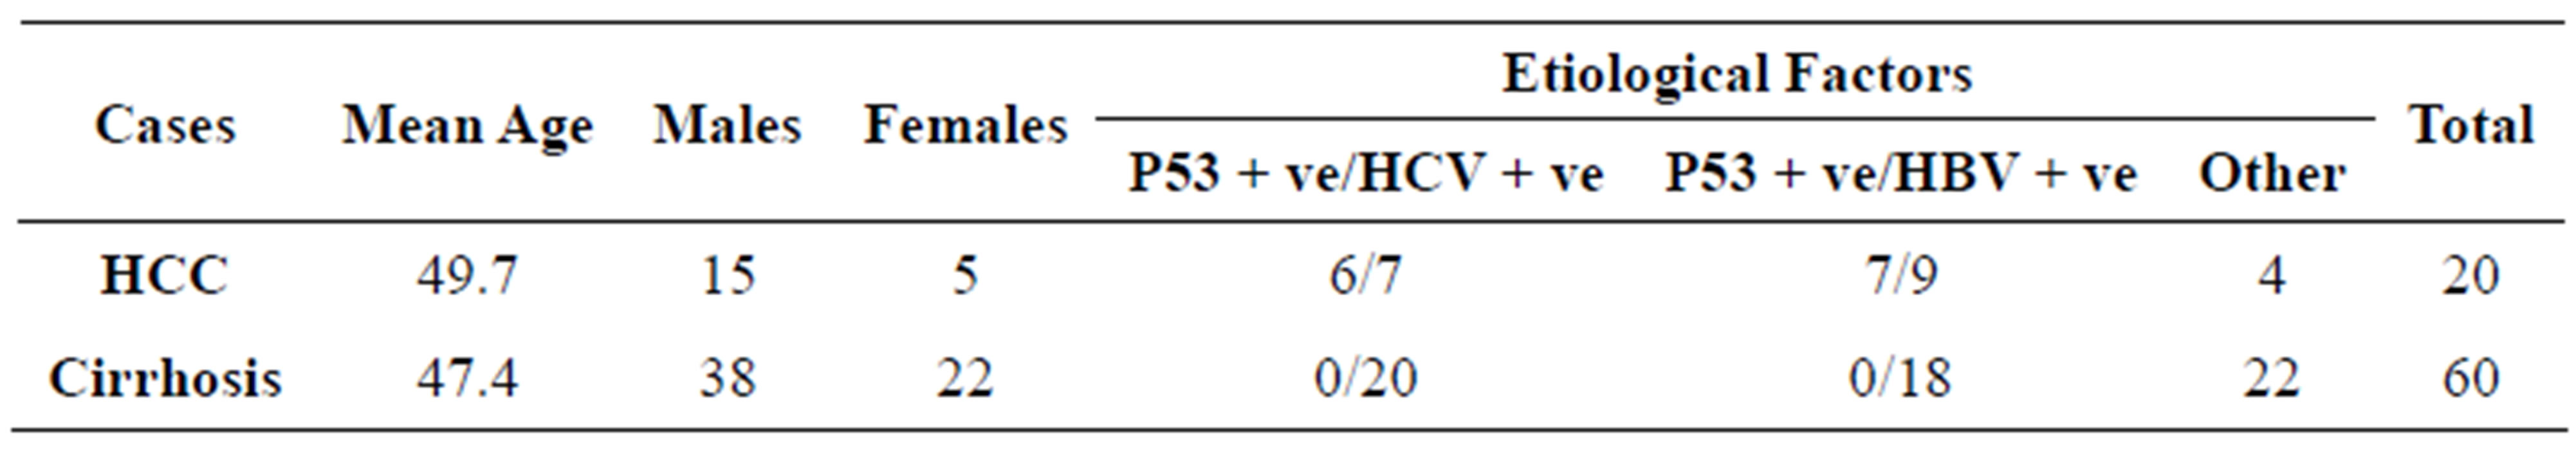
Table 2. Clinical data and etiological factors of patients with HCC and cirrhosis of the liver.
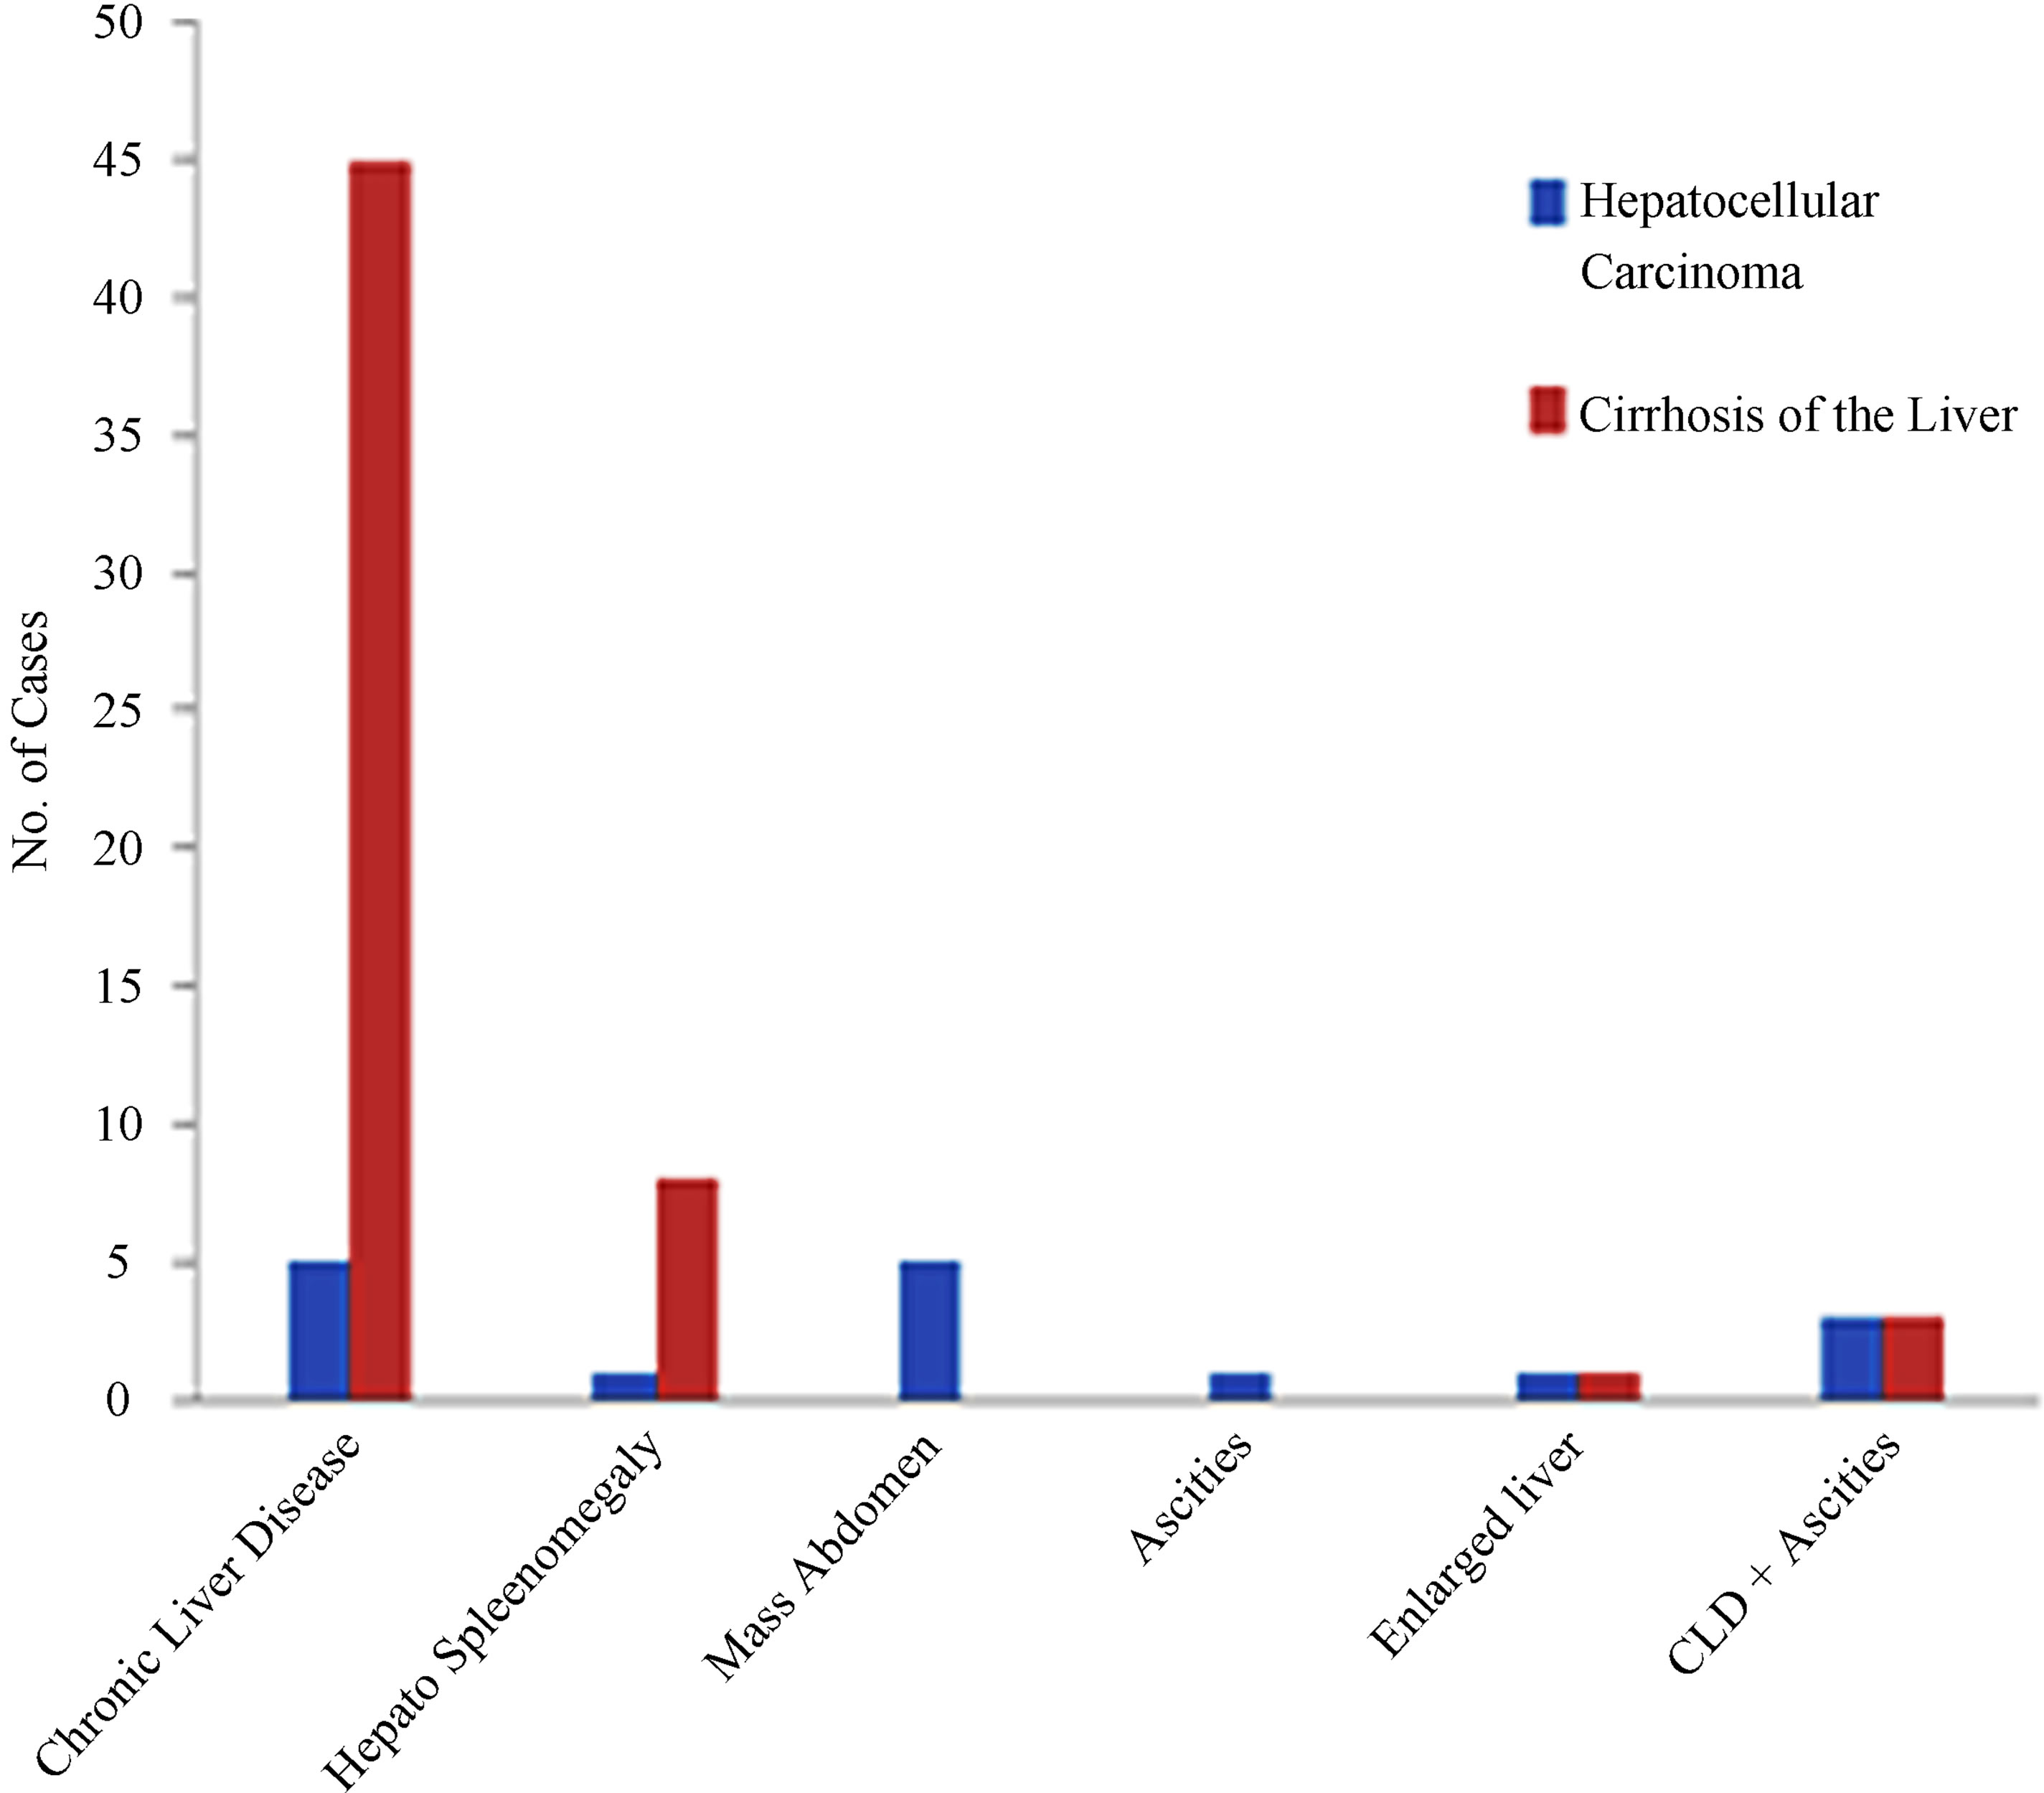
Figure 1. Clinical presentation in cases of hepatocellular carcinoma and cirrhosis of the liver.
2.3. Immunohistochemistry for p53
The immunohistochemical staining was done with p53 protein (DO-7), avidin-biotin conjugated, Kit (Novocastra Laboratories Ltd.) by strictly following the protocol provided in the kit by the manufacturer. In avidin-biotin complex (ABC) method, complex of avidin and biotin tracer, which contain free avidin binding sites, is applied to the biotinylated antibody. The primary antibody labeled with biotin is detected by its binding to avidin which itself is labeled with immunoperoxidase.
The sections were de-paraffinized and rehydrated to distilled water. 1600 ml 0.01 M citrate buffered solution (pH 6.0) was brought to boil in a stainless steel pressure cooker using a hot plate to cover but lid was not locked. The slides were positioned into the metal staining racks and lowered into the pressure cooker ensuring that the slides were immersed in the TBS. When the pressure indicator valve had risen (after about 4 minutes) the slides were incubated for 1 minute. The pressure cooker was removed from heat source and run under cold water with lid on. When the small valve sinked, lid was opened and slides were removed and placed immediately in distilled water. The slides were washed in TBS for 5 minutes, placed in 1.5% Hydrogenperoxide for 10 minutes and washed in distilled water twice for 5 minutes, followed by washing in TBS twice for 5 minutes. The slides were placed in normal serum for 20 minutes. They were covered with primary anti-body for 60 minutes at 37˚C and then washed in TBS twice for 5 minutes. The slides were then incubated in secondary anti-body for 30 minutes and washed in TBS twice for 5 minutes. After this the slides were incubated in AB Complex for 30 minutes, washed in TBS twice for 5 minutes and incubated in DAB solution at room temperature for 2 to 4 minutes. Then the slides were washed in water twice for 5 minutes, counter stained with haematoxylin and washed in running tap water for 5 minutes. The slides were then placed in staining jar containing 95% ethanol for approximately 2 minutes. This step was repeated by using a fresh jar of 95% ethanol, placed the slides in a staining jar of absolute ethanol for 2 minutes and repeated with fresh jar of absolute ethanol. Now, the slides were placed in staining jar containing xylene for 2 minutes and were repeated with fresh jar of xylene. The slides were then mounted with DPX and covered with cover slips.
2.4. Argyrophilicnucleolar Organizer Regions (AgNORs) Staining
For AgNOR staining, the slides were dewaxed in the oven at 60˚C for 15 minutes, rinsed in xylene twice for 3 minutes and then absolute ethanol twice for 2 minutes. The slides were post-fixed in an acetic-ethanol mixture (1:3) for 30 minutes at room temperature, washed with 6 changes of distilled water in a coplin jar and placed in the working staining solution in an inverted position. After incubation for 37 minutes at room temperature, the slides were washed in 6 changes of distilled water, rinsed in 5% sodium thiosulphate for 3 minutes. Then again washed in distilled water dehydrated through graded alcohol, cleared in xylene and mounted in DPX.
The AgNOR dots in 100 randomly selected hepatocytes were counted using a ×100 oil immersion objective and ×10 eye-piece (Total magnification: ×1000). To minimize the intraobserver counting error, a second count of theAgNORdots was made without knowing the previous count. The interval between the first and second counts was at least 2 weeks. The mean number of AgNORs per cell was calculated [32] taking both these counts into consideration. During the counting a green filter was used. This resulted in lesser aberration around the NORs in tissue sections. Moreover, the NOR margins appeared clearer. Total AgNOR dots, both intra and extra-nucleolar, were counted [32]. Bile ductular, vascular, inflammatory and Kupffer cells were not included in the enumeration procedure. The grading of size variation and distribution of AgNORs was performed by following the criteria used by Ahsan et al. (1991-1992) as shown in Table 3. AgNOR proliferation index (pAgNOR) was calculated as percentage of cells with 5 or more AgNOR dots.
Carboxyl groups of intranucleolar non-histone proteins are involved in the AgNOR reactions. These groups initially bind to silver ions, causing the reduction of the ions to the metal. Brown microscopic nuclei of metallic silver are formed which then act as foci for the further deposition of silver drawn from the less electronegative sulphydry groups of these non-histone proteins. The sulphydryl groups cause the development of the microdeposits of silver into the characteristic black dost visible at low microscopic magnification [33]. Post-fixation in acetic acid-ethanol mixture is thought to increase the permeability of cells, thus facilitating the penetration of staining solution [34].
To assess the diagnostic variables and calculate the optimal cut points of variables. Sensitivity, specificity, Positive Predictive Value (PPV) and Negative Predictive Value (NPV) were calculated at significant (p < 0.05) level.
2.5. Results and Discussion
In present study 15 cases of HCC out of 20 were positive for p53 immunostaining, 5 were negative. None of the 60 cases with cirrhosis of the liver or of the 20 with normal histology had increased p53 expression (Table 1). Out of 20 HCC cases (15 males and 5 females), 6 were associated with cirrhosis. The maximum number of patients was in the age group of 50 to 69 years. Amongst the 60 cases of cirrhosis 38 were males and 22 were females: maximum number of patients was in 50 to 59 years age group. Male predominance was seen in the present study which is in accordance with the previous studies [10]. In the present study mean age of patients with hepatocellular carcinoma was 49.7 years and of cirrhosis patients was 47.4 years (Table 2). Our findings are comparable with those reported earlier [15,35]. 7 HCC patients which were positive for HCV were of younger age group (40 and less than 40 years) and 6 out of these were positive for p53 staining, 7 out of 9 patients with HBV positive were positive for p53 stain (Table 2). p53 is the most commonly mutated gene in human neoplasia [36]. Such mutations usually result in a gene product consisting of defective p53 protein with prolonged half life. It enables detection through immunohistochemical methods [37]. We in the present study followed this method of grading AgNOR size and distribution as shown in Tables 3 and 4. It was found that AgNOR size and distribution was of significantly higher grade (p < 0.001) in HCC than in cirrhosis and in normal liver (Figure 2 and Figures 5(B) and (E); Tables 4 and 5).
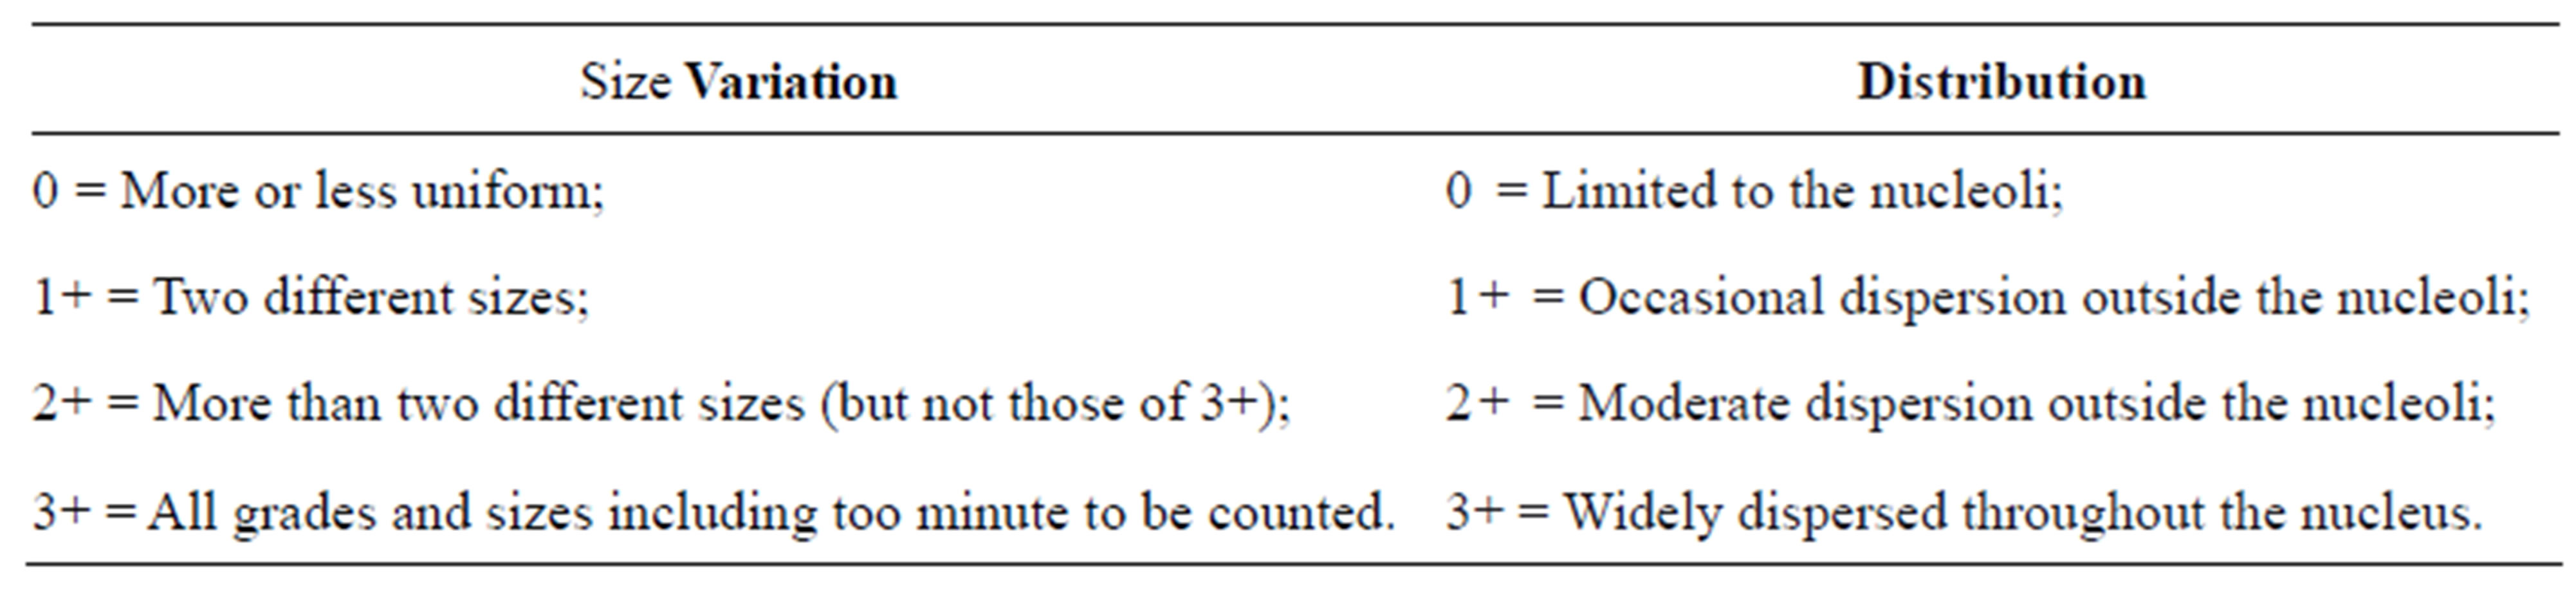
Table 3. Grading of size variation and distribution of AgNORs.
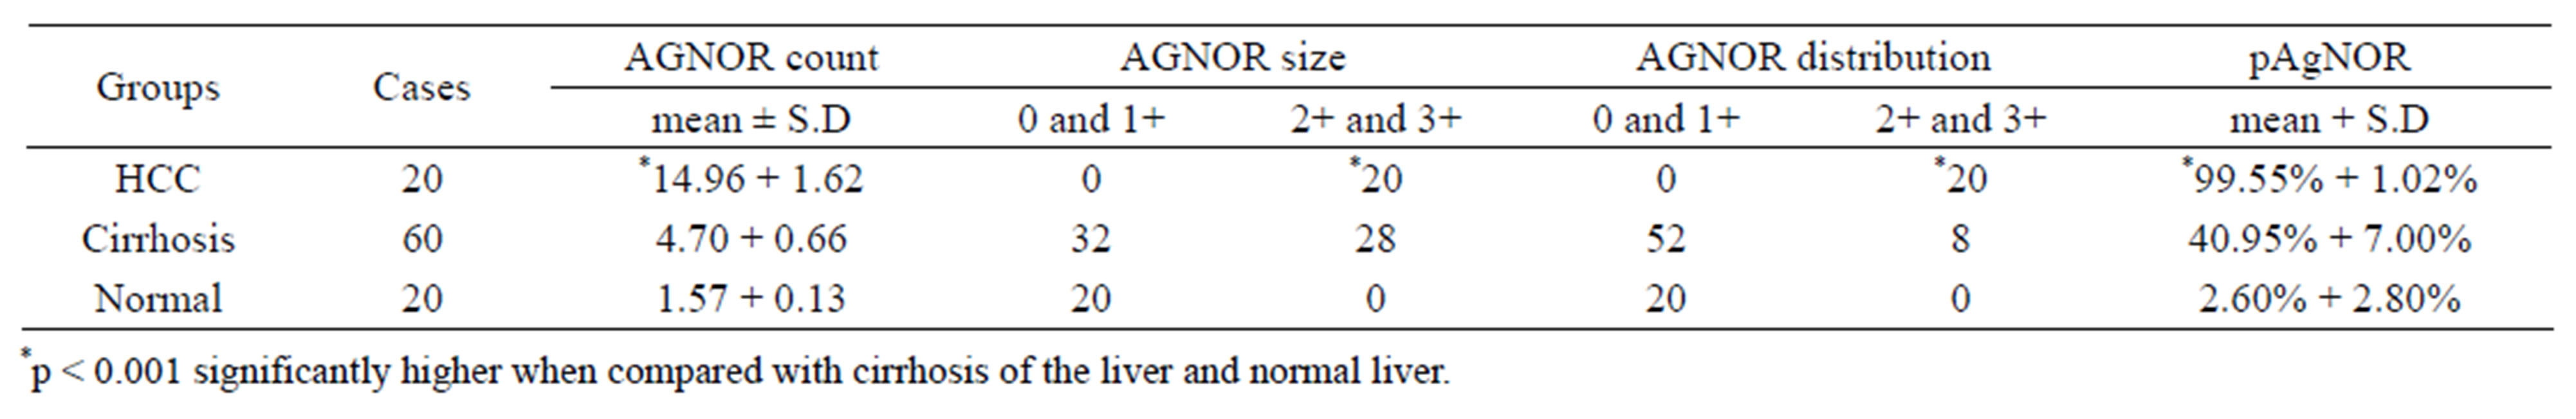
Table 4. Comparison of mean AgNOR count, size and distribution in hepatocellular carcinoma, cirrhosis of the liver and normal liver.
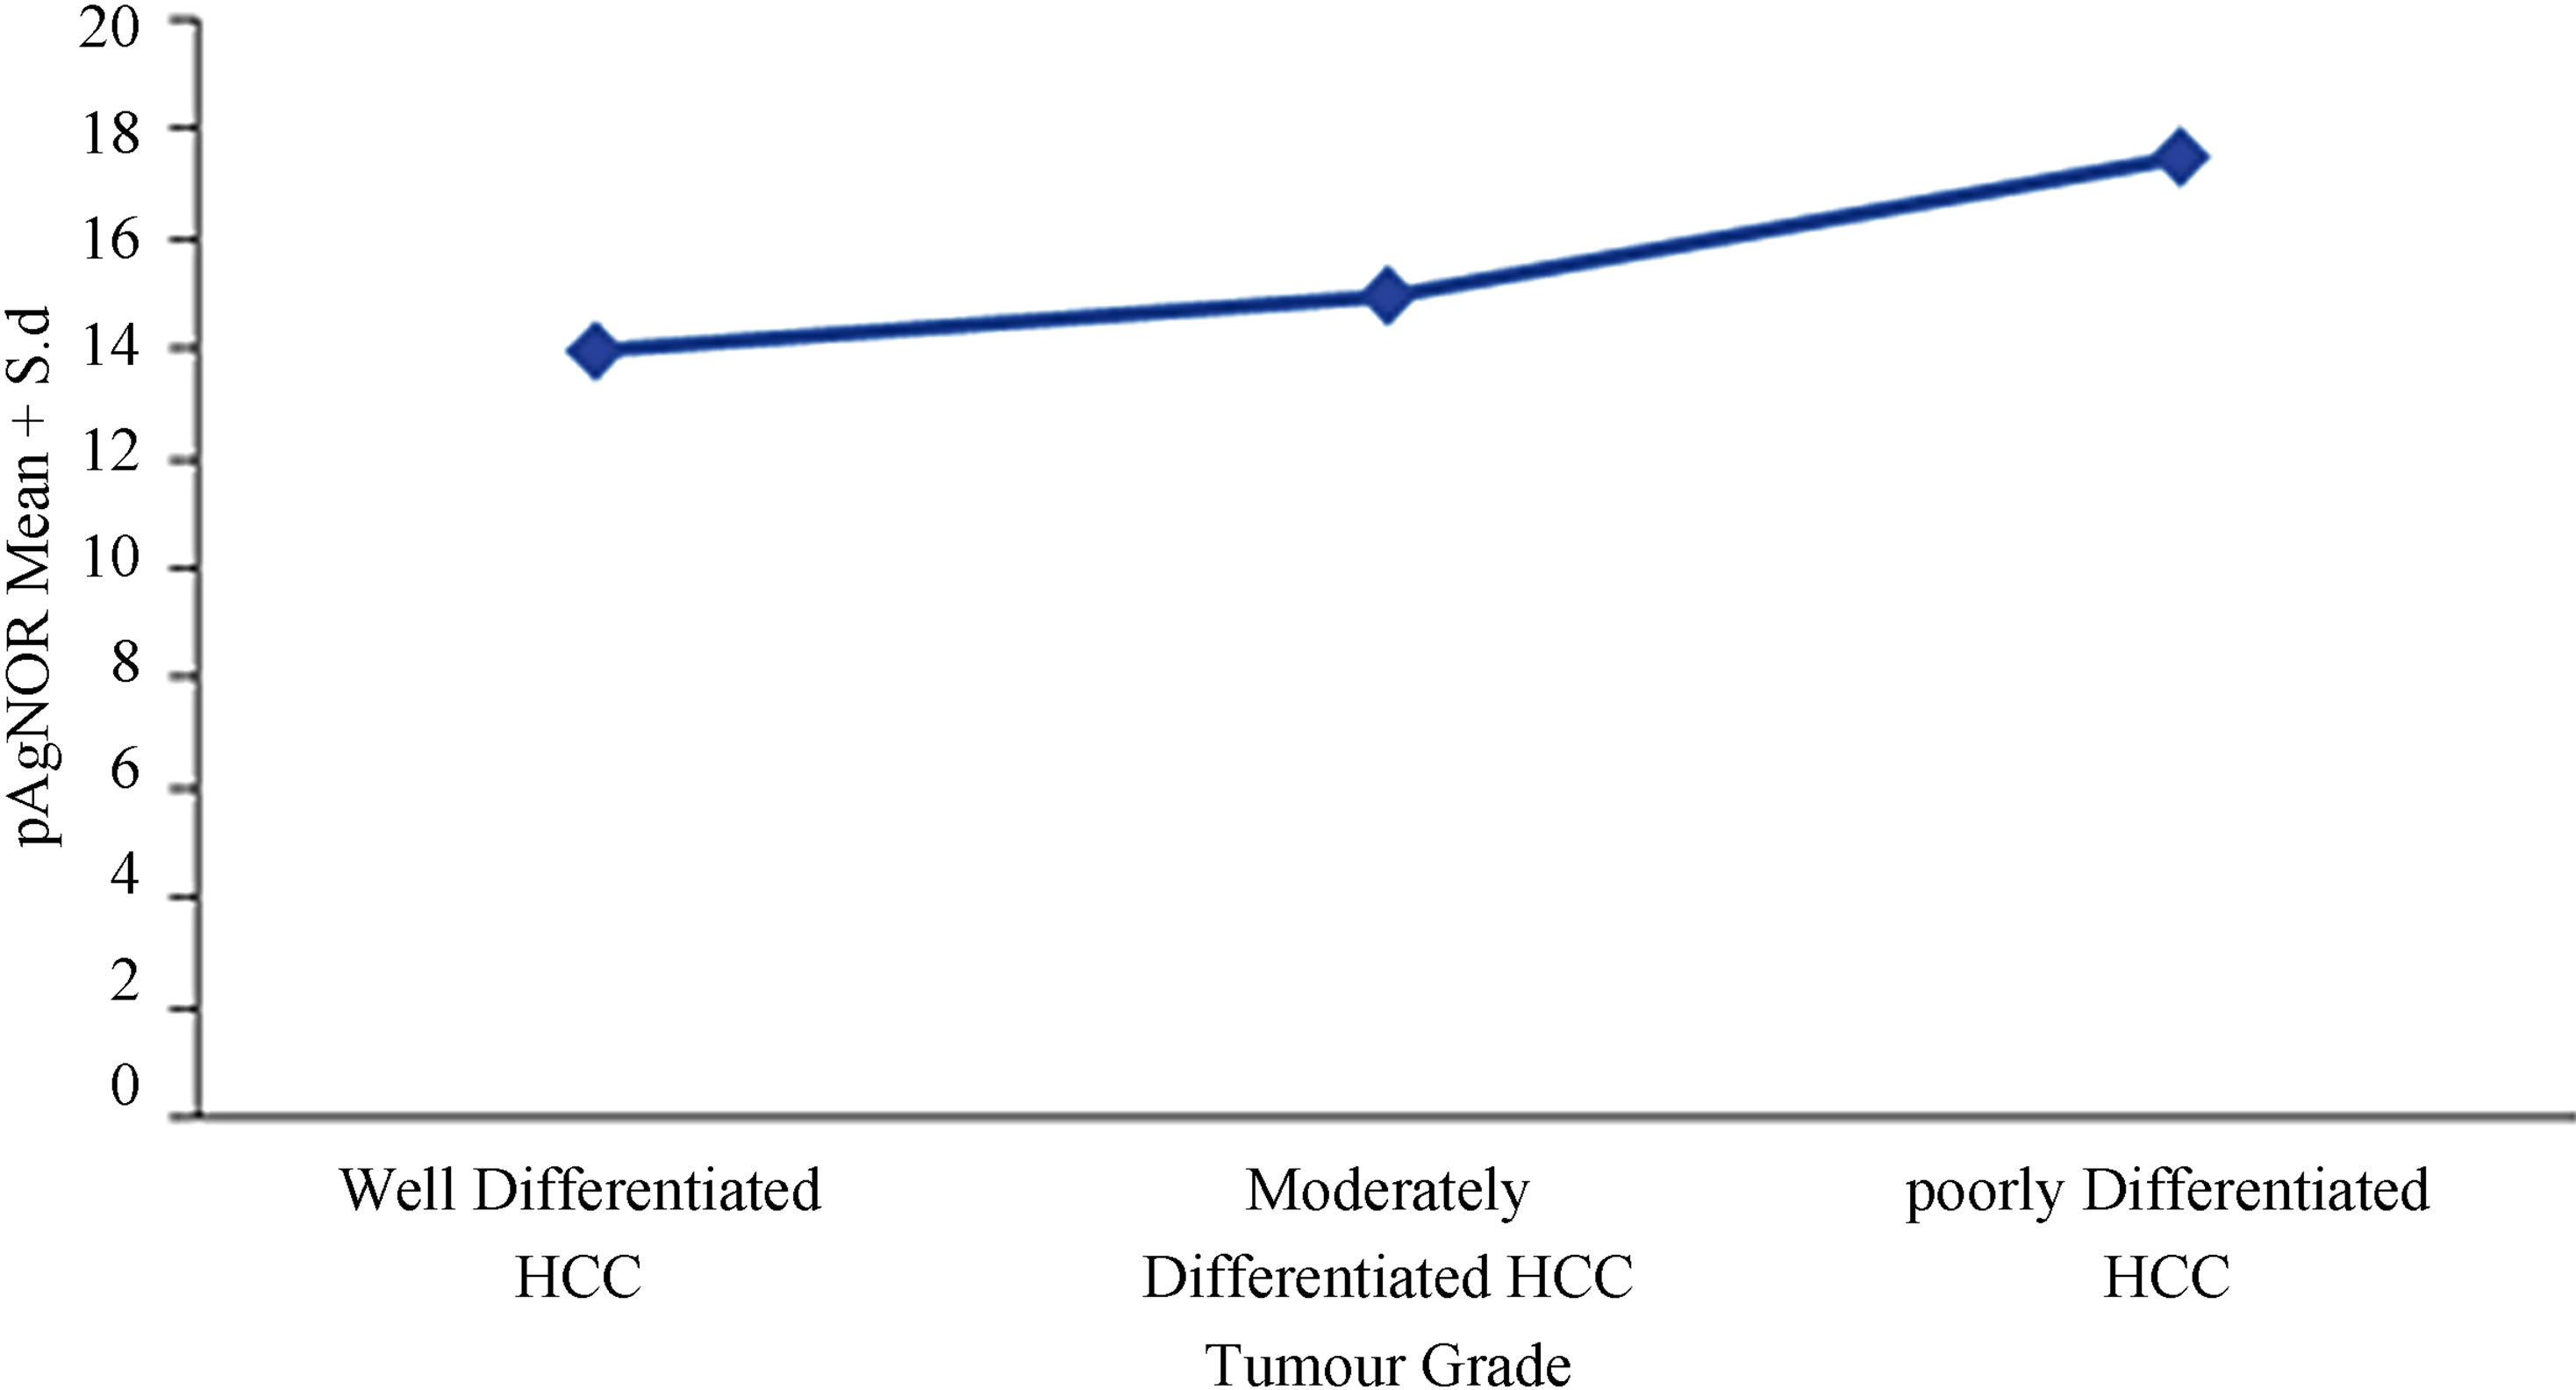
Figure 2. Comparison of pAgNOR count according to the grade of Hepatocellular carcinoma.
Normal histology of liver on H&E and negative p53 immunostain is shown in Figures 3(A) and (B) comprising of liver lobules with portal triad and central vein. Cirrhosis of the liver with H&E stain (Figure 5(A)), with prominent cirrhotic nodules surrounded by fibrous septa, negative for p53 (Figure 5(B)) and less number of AgNOR dots is shown (Figure 5(C)). Figure 4 indicates section of liver with HCC with H&E stain and p53 immunostain. Figure 4(A) shows section with H&E stain, 4B-D are stained with p53; 4B with weak p53 expression, 4C with intermediate positivity for p53, 4D with strong p53 expression.
In the present study mean AgNOR count was 14.96 ± 1.62 for HCC, 4.70 ± 0.66 for cirrhosis of the liver and 1.57 ± 0.13 for normal liver. The difference observed in the three groups was highly significant (p < 0.001) (Table 4). Among the HCC the mean AgNOR count increased as differentiation decreased. Mean AgNOR count in well differentiated HCC (13.20) was significantly low (p < 0.001) than the mean count (14.96) of moderately differentiated hepatocellular carcinoma. This in turn was lower than that of poorly differentiated HCC (17.88).
AgNOR size and distribution were of higher grade in HCC (p < 0.001) than in cirrhosis (Figures 5(B) and (E); Tables 4 and 5). These in turn were of high grade in cirrhosis than in normal liver. Similarly AgNOR proliferation index (pAgNOR) increased steadily from normal
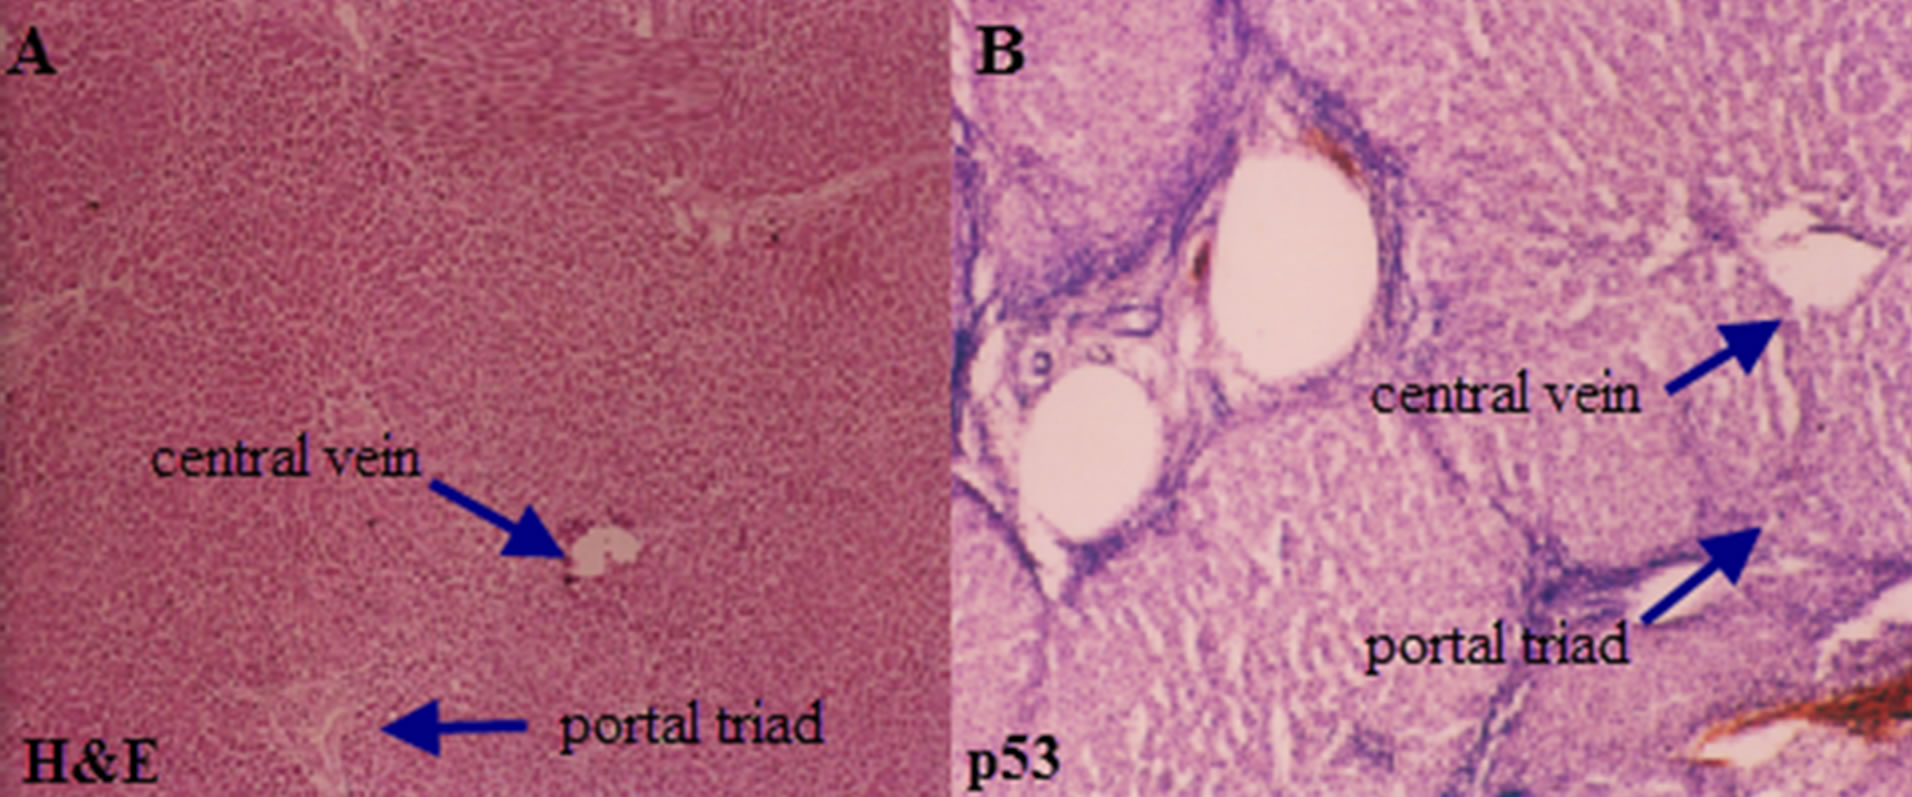
Figure 3. Photomicrograph of a section of liver showing normal histology of the liver with arrows indicating central vein and portal triad (A) H&E 10×; (B) p53 negative immunostain.
liver through cirrhosis to HCC (p < 0.001). It also increased with the grade of HCC. The pAgNOR in moderately differentiated HCC was significantly higher (p < 0.05) than pAgNOR of well differentiated HCC (Figures 5(B) and (E); Table 4).
With the specificity of 100% and sensitivity of 81.25%, 100% positive predictive values and negative predictive values of 95.24%, p53 immunohistochemistry provide an easy way to study the role of mutant p53 in liver carcinogenesis and very convenient tool to assess fluctuations of this oncoprotein in the transformation process from liver cirrhosis to hepatocellular carcinoma (Table 6).
p53 immunohistochemistry was done to assess the pathogenetic role of mutant p53 in regenerative and neo-
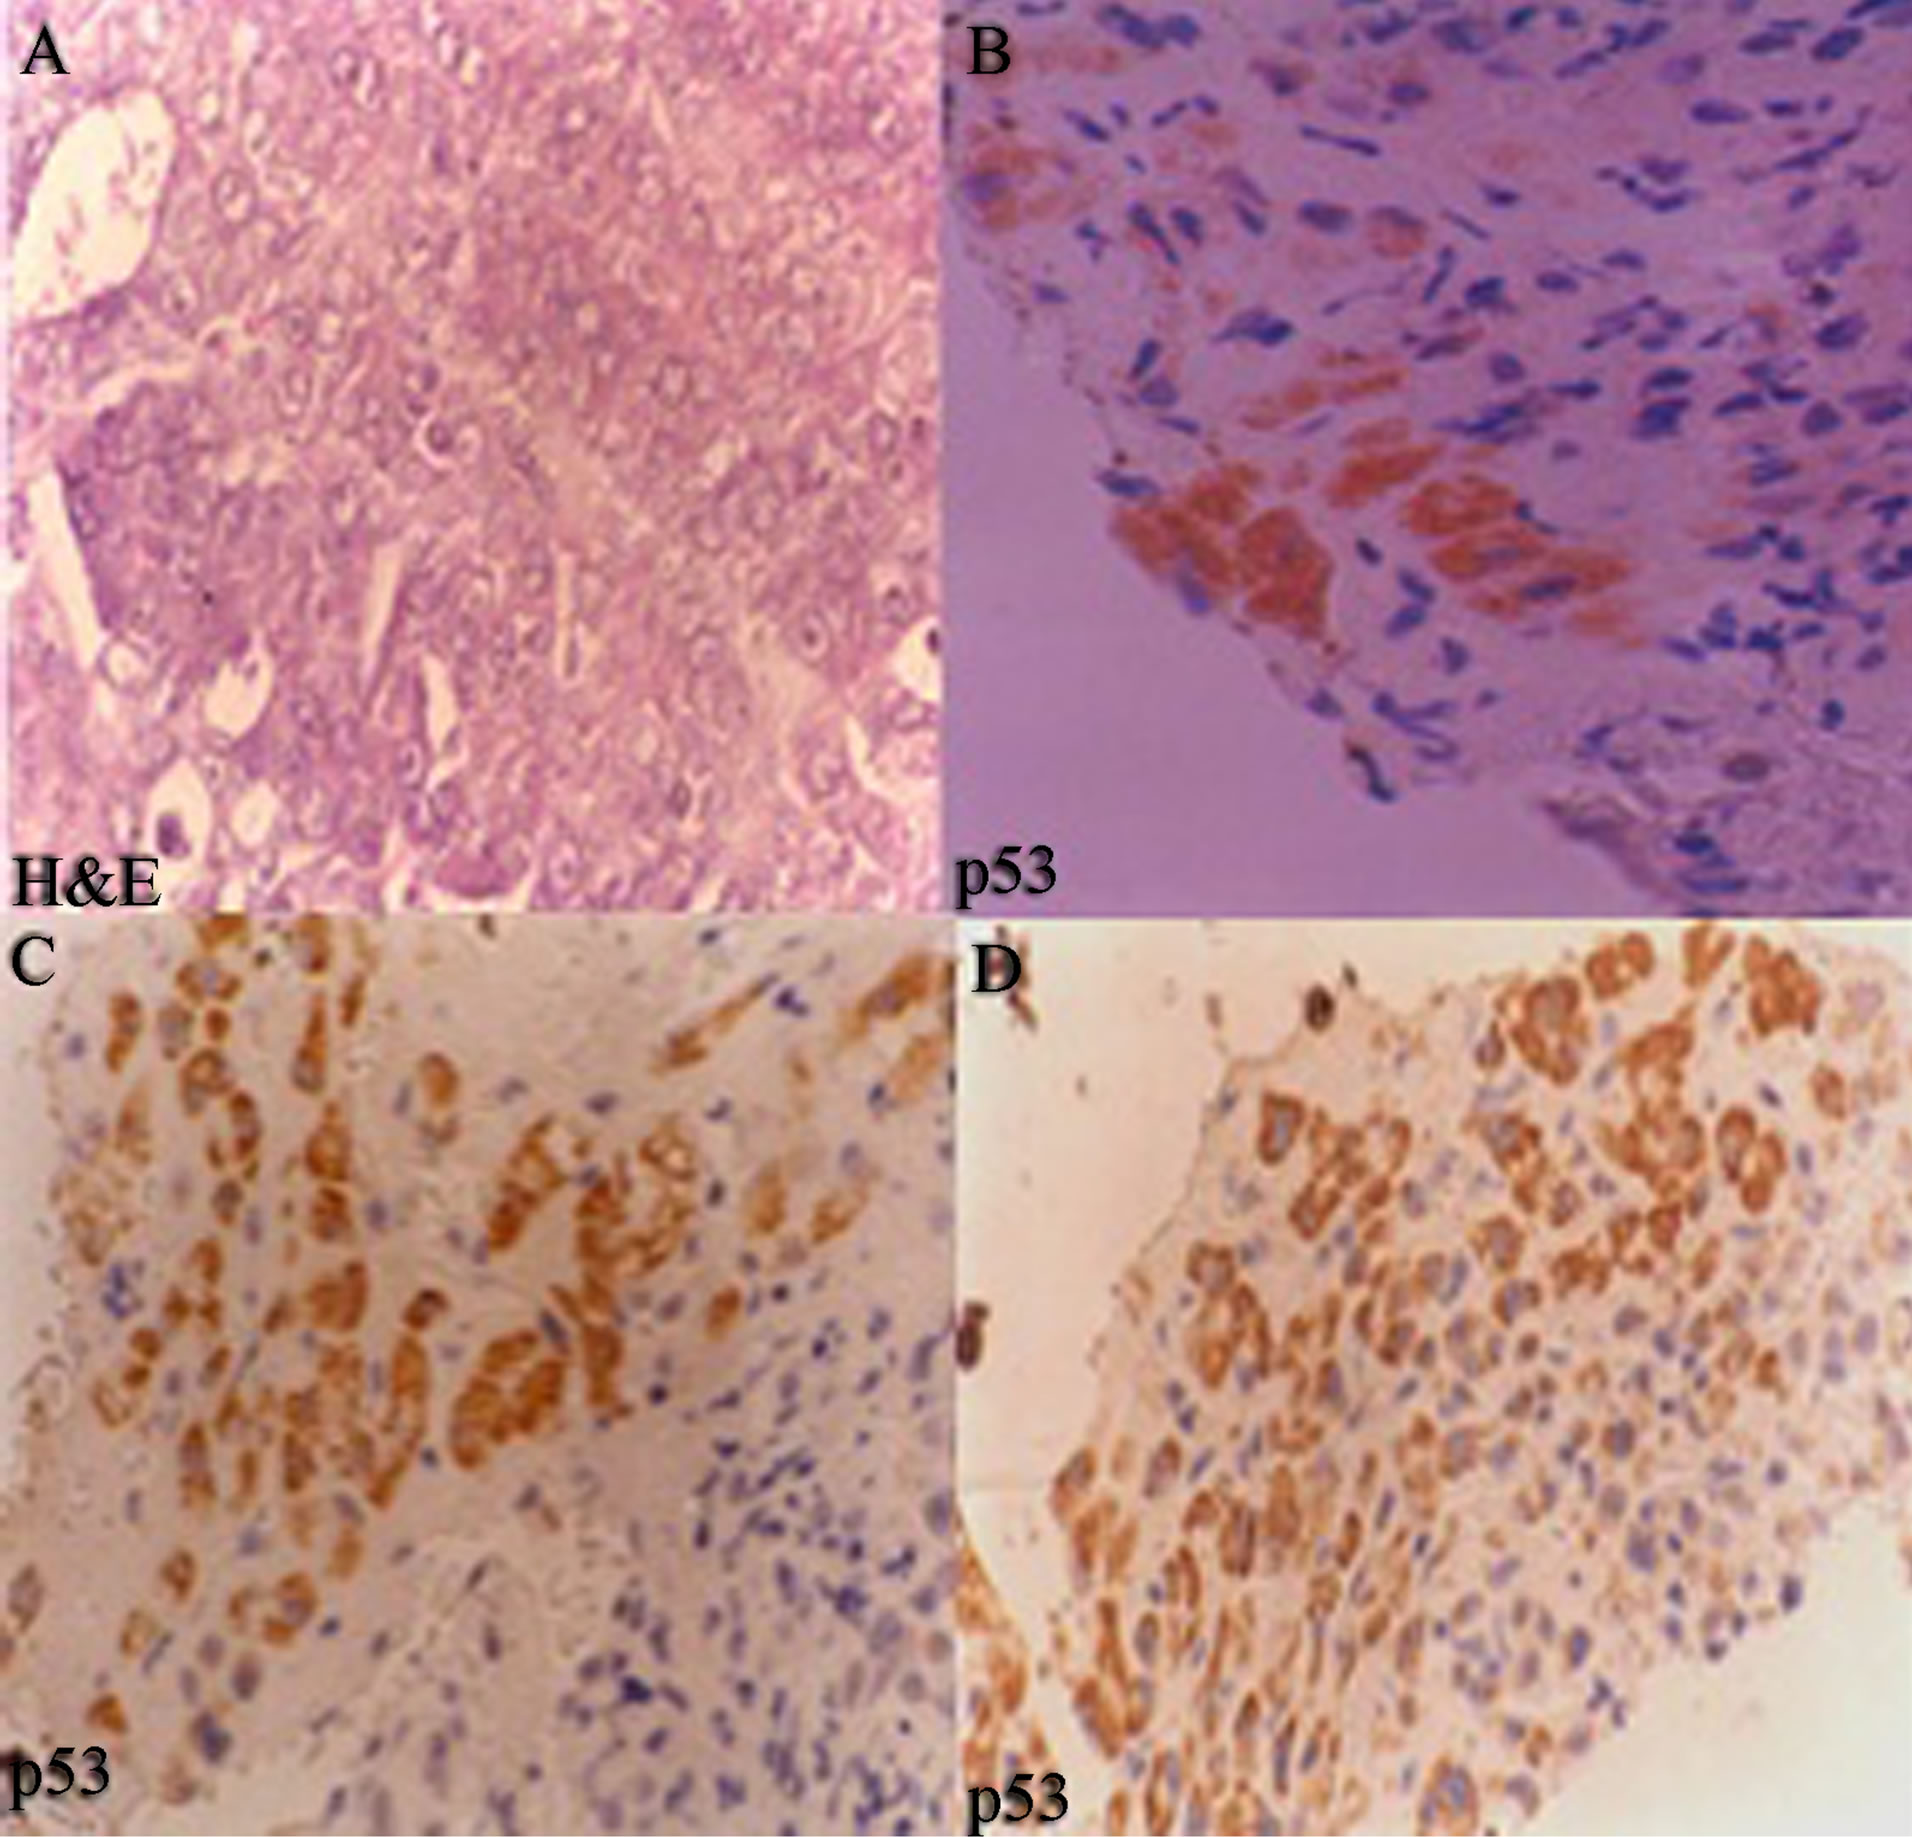
Figure 4. Section of hepatocellular carcinoma (40×) (A) H&E stain; (B) well differentiated HCC, weak p53 expression; (C) Moderately differentiated HCC, with intermediate p53 positivity (×1600); and (D) poorly differentiated HCC, strong p53 expression (×1600). Positivity increases as aggressiveness of carcinoma increases.
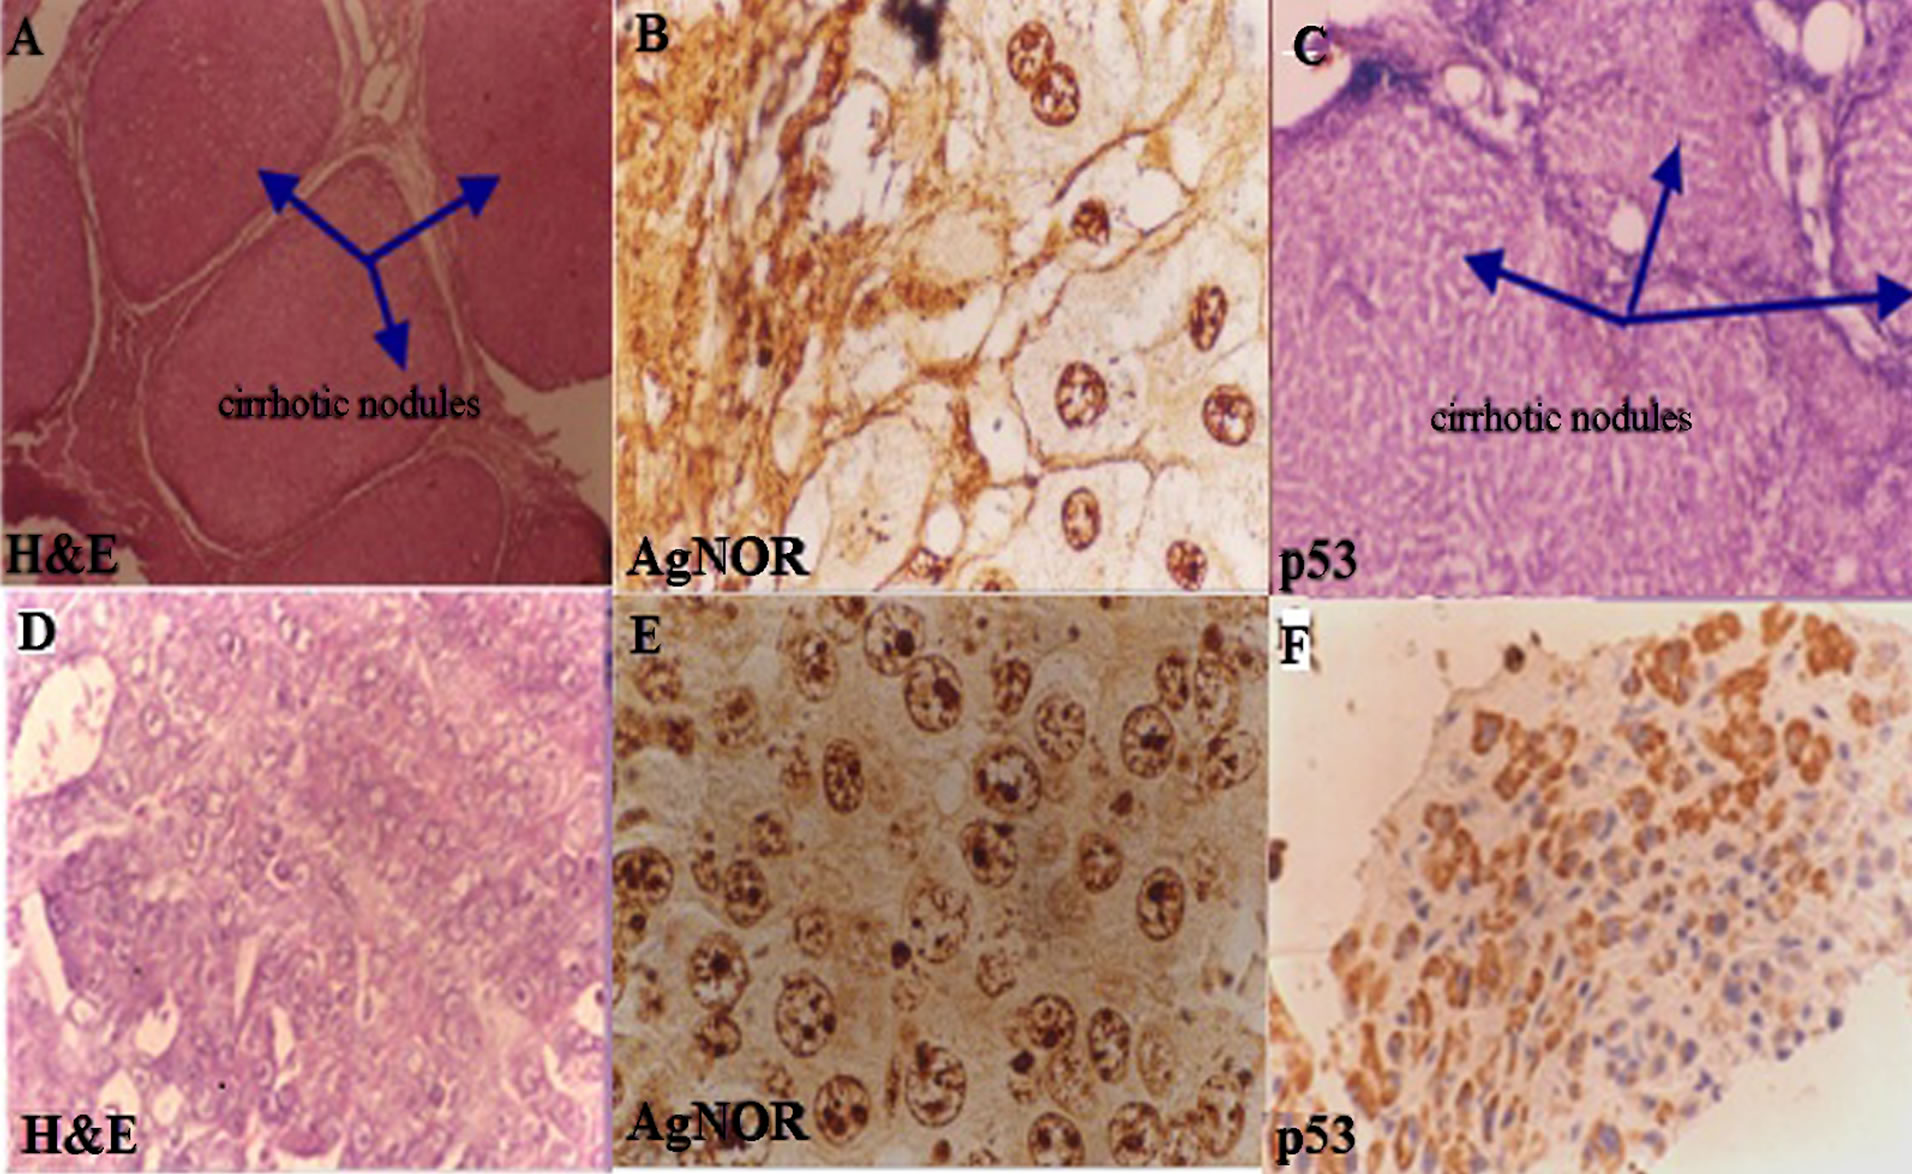
Figure 5. (A)-(C) show tissue sections of liver cirrhosis with prominent fibrous septa surrounding the cirrhotic nodules, stained with: H&E (×160), AgNOR and p53 respectively; (A) is stained with H&E; (B) hepatocytes show 4 to 5 AgNOR (AgNOR stain ×4000) dots and (C) is p53 immunostain negative; (D)-(F) show tissue sections of hepatocellular carcinoma with H&E, AgNOR (4000×) and p53 immunostain. In (E) most hepatocytes show more AgNOR dots in HCC and F also shows more positivity for p53.
plastic liver disease by distinguishing between malignant tumor and morphologically similar benign processes [38]. The results of the current study were comparable with that of Ojanguren [39]. They reported that there was no immunohistochemical evidence of mutant p53 expression in any of the cases of cirrhosis of the liver (except for one instance associated with HCC) adenoma or focal nodular hyperplasia. In contrast p53 was detected in 32.5% of HCC and was positively related with tumor grade.
Raedle et al. [40], had detected auto antibodies to p53 in 3 out of 7 patients with HCC, but out of 140 patients without malignancy, none was positive for p53 autoantibodies. Ojanguren et al. [41] by using the same kit as in present study reported that 14 out of 62 cases of HCC etc positive for p53 immunoreactivityand seemed to correlate with tumor grade. Their staining results were lower than other studies. This is because of the fact that they did not carry out antigen retrieval method in the staining procedure. Moreover, they considered the case as positive case for p53 immunohistochemistry when more than 20% of tumor cells were stained by p53 immunostain. On the other hand, most of the studies label the case positive when 5% of the cells are positive for p53 expression [18]. In the present study the criteria for positive p53 immunostaining was again 5% or more than 5% of stained cells.
Wee et al. [42] in their study documented the expression of p53 in 16 out of 46 cases of HCC. There was no definite correlation between p53 positivity, tumor size, histological grade and vascular invasion. Livni et al. [18] reported that eight of the 12 patients with p53 positive HCC cells had p53 over-expression in the non-tumor hepatocytes within regenerative nodules adjacent to HCC tissue. Three of 21 cirrhotic livers without a detectable tumor had increased p53 expression in the regenerative nodules. None of the 12 patients with chronic active hepatitis without cirrhosis or the 13 with a normal liver histology had increased p53 expression.
p53 over expression in some cirrhotic livers and in non-tumor livers of patients with hepatocellular carcinoma may indicate a normal p53 gene response to cellular stress. Darnton [43] reported that the concentration of the wild type p53 gene product rises rapidly in the cells after DNA damage, such as that caused by ultraviolet light, ionizing radiation or following cellular stress such
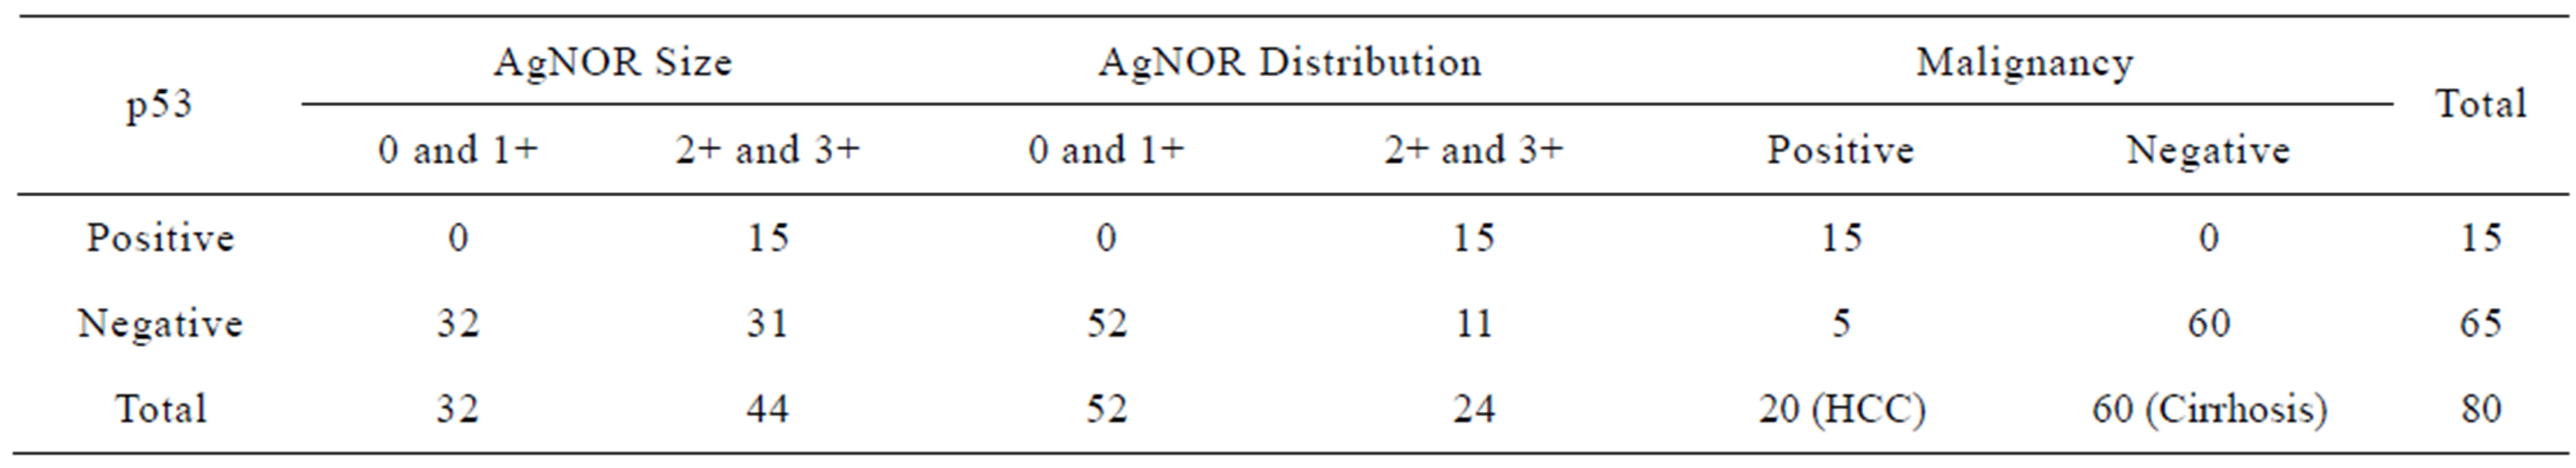
Table 5. Comparison of p53 positive and negative cases with AgNOR size, distribution and malignancy in liver diseases (*p < 0.001).
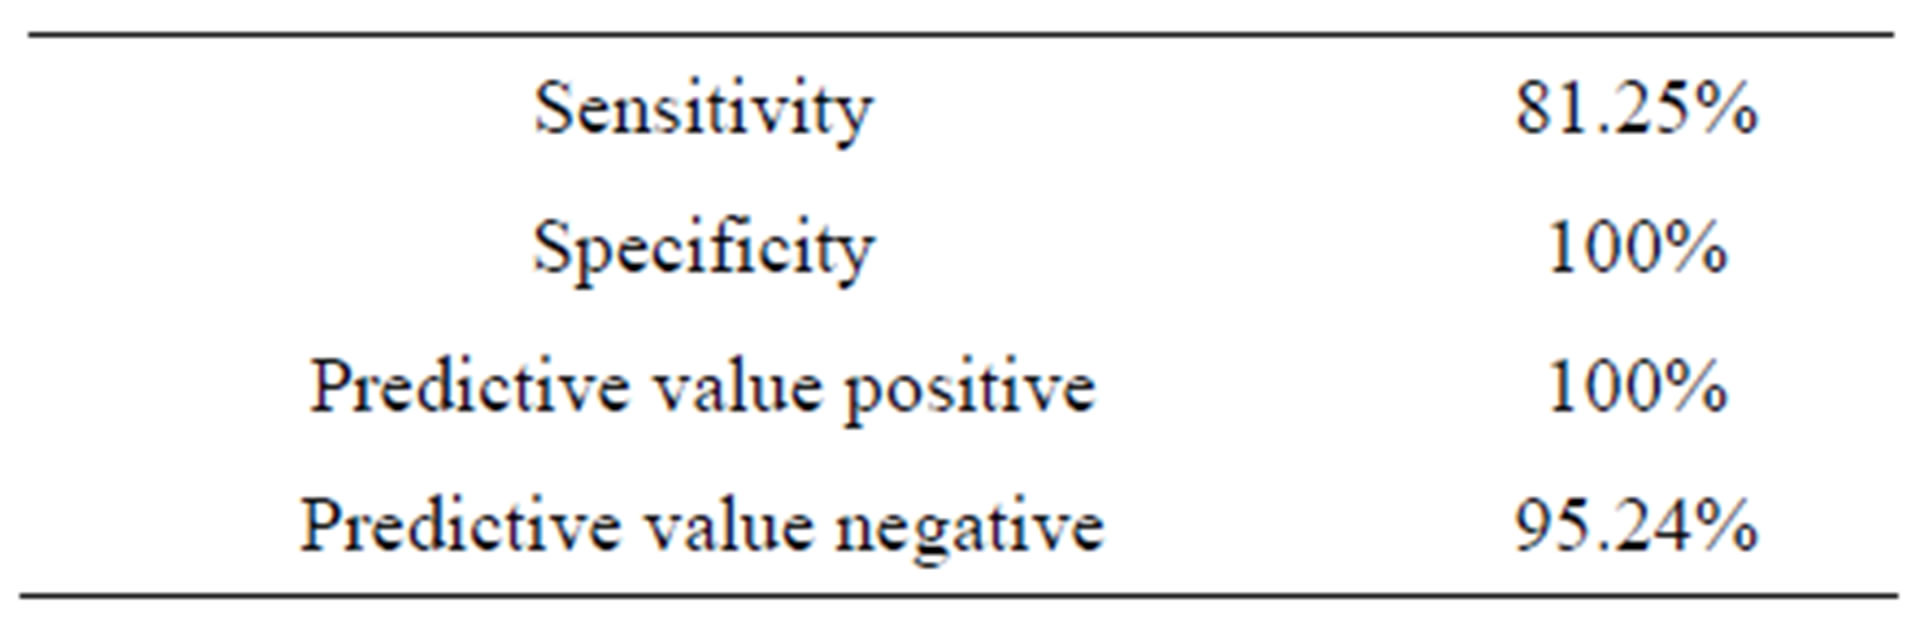
Table 6. Diagnostic value of p53 in liver diseases.
as hypoxia. Mutations seemed to show a clear correlation with the grade of differentiation of the tumor, and therefore with its biological behavior and aggressiveness.
HCC development is not a single step process and includes gradual changes in gene expression resulting in increased proliferation and ultimately liver cancer [44]. Therapeutic effects of p53 due to its increased expression are carried by two ways; apoptosis of tumor cells by inhibiting cell proliferation and renders HCC more sensitive to chemotherapeutic agents [45]. Hsia et al. [46] performed immunohistochemistry and sequencing analysis to detect p53 mutations in HCC and concluded that immunohistochemistry detected most mutations that were detected by sequencing with the specificity of 73% and sensitivity of 94%.
In liver diseases it has been reported that AgNOR scores for HCC were significantly higher than those for benign and borderline lesions; the scores increased with histologic tumor grade [30]. In some patients with HCC statellite nodules and/or a vascular invasion cannot be detected by imaging diagnostic procedure. Therefore, AgNOR in the biopsy specimens prove to be useful measures to assess the aggressiveness of the HCC [47]. AgNOR counts have been studied in breast carcinoma, but the results have been conflicting. Some studies have demonstrated that quantitative analysis of AgNORs yields a prognostic factor in breast cancer [48].
The mean number of AgNOR per hepatocyte in the present study was found to be high. In comparison, Crocker and McGovern [49] recorded a mean AgNOR count per heptocytes of 7.46 in HCC. These counts are lower than in present study. The difference in section thickness appears to be the most likely factor responsible because when 4 micrometers thick sections were used by Dervan et al. [50] in breast carcinoma, the mean AgNOR per cell was found to be higher than counts made on thin sections. A similar significant difference (p < 0.001) was found between the mean AgNOR score of the normal and pathological biopsies and between the non neoplastic and the carcinomatous lesions [47]. Small sizes, large numbers and scattered distribution of AgNORsare characteristic of malignant tumor cells while large sized, small number and clustereddistribution of AgNORsare characteristic of benign tumor cells [51].
A well-defined inverse relationship was observed between AgNOR number and their sizes [49]. Variation in the number as well as differences in the distribution pattern of AgNOR granules were found among different type of tumor [52]. Similarly, the differences between benign and malignant NORs in terms of their size, number and distributions inside the nucleus were striking [53]. Small sizes, large numbers and scattered distribution of AgNORs were characteristic of malignant tumor cells while large sized, small number and clustered distribution of AgNORs were characteristic of benign tumor cells [51,54]. The above mentioned studies have pointed out the importance of AgNOR size and distribution in malignancies. The number and morphological features of AgNOR are thought to reflect the cellular proliferative activity and grade of malignancy [55]. In liver diseases, it has been reported that AgNOR scores for hepatocellular carcinoma were significantly higher than those for benign and border line lesion; the score increased with histologic tumour grade [56].
AgNOR is specially beneficial when the material is insufficient [30]. Application of AgNOR staining to conventionally fixed and processed paraffin sections has made this technique a useful tool in diagnosis of human malignancies [48]. There was growing evidence to suggest that the number of intranuclear NORs visible are indicative of proliferative activity of the tissue being examined [54]. AgNOR enumeration along with morphological parameters is a good predictor of both ploidy and proliferation index having a prognostic relevance.
3. CONCLUSION
We conclude that, p53 and NORs are a novel target for therapeutic intervention and development of new anticancer drugs. Immunohistochemistry helps in studying mutant p53 gene role and alteration of expression in liver cancer and progression of liver cirrhosis to HCC. The immunohistochemical detection of p53 and NOR is a simple, cost effective and widely available technique. It is an efficient and inexpensive diagnostic test for early detection of hepatocellular carcinoma and can potentially improve the prognosis of patients.
4. ACKNOWLEDGEMENTS
Authors acknowledge Mr. Tehseen Ahmad for providing technical assistance in the preparation of tissue sections and helping with staining procedures.
REFERENCES
- Brugieres, L., Branchereau, S. and Laithier, V. (2012) Paediatric malignant liver tumours. Bulletin du Cancer, 99, 219-228.
- Salhab, M. and Canelo, R. (2011) An overview of evidence-based management of hepatocellular carcinoma: A meta-analysis. Journal of Cancer Research and Therapeutics, 7, 463-475. doi:10.4103/0973-1482.92023
- Michielsen, P.P., Francque, S.M. and van Dongen, J.L. (2005) Viral hepatitis and hepatocellular carcinoma. World Journal of Surgical Oncology, 3, 27. doi:10.1186/1477-7819-3-27
- Parkin, D.M., et al. (2005) Global cancer statistics, 2002. CA: A Cancer Journal for Clinicians, 55, 74-108. doi:10.3322/canjclin.55.2.74
- Farrell, G.C., Yuen, M.F., Amarapurkar, D.N., Chutaputti, A., Fan, J.G., Hou, J.L., Han, K.H., Kao, J.H., Lim, S.G., Mohamed, R., Sollano, J. and Ueno, Y. (2010) Prevention of hepatocellular carcinoma in the Asia-Pacific region: Consensus statements. Journal of Gastroenterology and Hepatology, 25, 657-663.
- Altekruse, S.F., McGlynn, K.A. and Reichman, M.E. (2009) Hepatocellular carcinoma incidence, mortality, and survival trends in the United States from 1975 to 2005. Journal of Clinical Oncology, 27, 1485-1491. doi:10.1200/JCO.2008.20.7753
- Capocaccia, R., et al. (2007) Hepatocellular carcinoma: Trends of incidence and survival in Europe and the United States at the end of the 20th century. American Journal of Gastroenterology, 102, 1661-1670.
- Baatarkhuu, O., et al. (2011) Current situation of hepatocellular carcinoma in Mongolia. Oncology, 81, 148-151. doi:10.1159/000333278
- Oyunsuren, T., et al. (2006) Hepatocellular carcinoma and its early detection by AFP testing in Mongolia. Asian Pacific Journal of Cancer Prevention, 7, 460-462.
- Yuen, M.F., Hou, J.L. and Chutaputti, A. (2009) Hepatocellular carcinoma in the Asia-Pacific region. Journal of Gastroenterology and Hepatology, 24, 346-353. doi:10.1111/j.1440-1746.2009.05784.x
- Marrero, C.R. and Marrero, J.A. (2007) Viral hepatitis and hepatocellular carcinoma. Archives of Medical Research, 38, 612-620. doi:10.1016/j.arcmed.2006.09.004
- Nguyen, V.T., Law, M.G. and Dore, G.J. (2009) Hepatitis B-related hepatocellular carcinoma: Epidemiological characteristics and disease burden. Journal of Viral Hepatitis, 16, 453-463. doi:10.1111/j.1365-2893.2009.01117.x
- Tarantino, G. (2007) Utility of sonography in diagnosing hepatocellular carcinoma. American Journal of Roentgenology, 188, 494-495.
- Soresi, M., et al. (2003) Usefulness of alpha-fetoprotein in the diagnosis of hepatocellular carcinoma. Anticancer Research, 23, 1747-1753.
- Giardina, M.G., et al. (1998) Serum alpha-L-fucosidase activity and early detection of hepatocellular carcinoma: A prospective study of patients with cirrhosis. Cancer, 83, 2468-2474. doi:10.1002/(SICI)1097-0142(19981215)83:12<2468::AID-CNCR9>3.0.CO;2-Y
- Ansari, N.A. and Derias, N.W. (1997) Fine needle aspiration cytology. Journal of Clinical Pathology, 50, 541-543. doi:10.1136/jcp.50.7.541
- Wee, A. (2005) Fine needle aspiration biopsy of the liver: Algorithmic approach and current issues in the diagnosis of hepatocellular carcinoma. Cytojournal, 2, 7. doi:10.1186/1742-6413-2-7
- Livni, N., et al. (1995) p53 expression in patients with cirrhosis with and without hepatocellular carcinoma. Cancer, 75, 2420-2426. doi:10.1002/1097-0142(19950515)75:10<2420::AID-CNCR2820751006>3.0.CO;2-6
- Oiwa, H., et al. (1995) Growth pattern and p53 overexpression in patients with early gastric cancer. Cancer, 75, 1454-1459. doi:10.1002/1097-0142(19950315)75:6+<1454::AID-CNCR2820751511>3.0.CO;2-G
- Crocker, J. (1990) AgNORs and follicular lymphomas. Journal of Clinical Pathology, 43, 964-965. doi:10.1136/jcp.43.11.964
- Nayak, S.K., Panesar, P.S. and Kumar, H. (2011) Nongenotoxic p53-activators and their significance as antitumor therapy of future. Current Medicinal Chemistry, 18, 1038-1049. doi:10.2174/092986711794940833
- Scheistroen, M., et al. (1999) p53 protein expression in squamous cell carcinoma of the vulva. Cancer, 85, 1133- 1138. doi:10.1002/(SICI)1097-0142(19990301)85:5<1133::AID-CNCR17>3.0.CO;2-T
- Cheng, L., et al. (1999) p53 protein overexpression is associated with increased cell proliferation in patients with locally recurrent prostate carcinoma after radiation therapy. Cancer, 85, 1293-1299. doi:10.1002/(SICI)1097-0142(19990315)85:6<1293::AID-CNCR11>3.0.CO;2-O
- Chen, F., Wang, W. and El-Deiry, W.S. (2010) Current strategies to target p53 in cancer. Biochemical Pharmacology, 80, 724-730. doi:10.1016/j.bcp.2010.04.031
- Garcia, J.F., et al. (1997) p53 expression in CMV-infected cells: Association with the alternative expression of the p53 transactivated genes p21/WAF1 and MDM2. Histopathology, 30, 120-125. doi:10.1046/j.1365-2559.1997.d01-577.x
- Sivridis, E. and Sims, B. (1990) Nucleolar organiser regions: New prognostic variable in breast carcinomas. Journal of Clinical Pathology, 43, 390-392. doi:10.1136/jcp.43.5.390
- Smith, P.J., et al. (1988) The effect of a series of fixatives on the AgNOR technique. Journal of Pathology, 155, 109-112. doi:10.1002/path.1711550206
- Beresford, M.J., Wilson, G.D. and Makris, A. (2006) Meas- uring proliferation in breast cancer: Practicalities and applications. Breast Cancer Research, 8, 216. doi:10.1186/bcr1618
- Karki, S., Jha, A. and Sayami, G. (2012) The role of argyrophilic nucleolar organizer region (AgNoR) study in cytological evalution of fluids, especially for detection of malignancy. Kathmandu University Medical Journal (KUMJ), 10, 44-47.
- Siddiqui, M.S., et al. (1999) Assessment of nucleolar organizer regions (NORs) in proliferative conditions of the liver. Pathology Research and Practice, 195, 421-426. doi:10.1016/S0344-0338(99)80016-8
- WMA (2010) World Medical Association Declaration of Helsinki: Ethical principles for medical research involving human subjects. http://www.wma.net/e/policy/b3.htm
- Trere, D. (2000) AgNOR staining and quantification. Micron, 31, 127-131. doi:10.1016/S0968-4328(99)00069-4
- Crocker, J. (1996) Molecular and biochemical aspects of interphase nucleolar organiser regions. Journal of Clinical Pathology, 49, M8-M11. doi:10.1136/mp.49.1.M8
- Chiu, K.Y., Loke, S.L. and Wong, K.K. (1989) Improved silver technique for showing nucleolar organiser regions in paraffin wax sections. Journal of Clinical Pathology, 42, 992-994. doi:10.1136/jcp.42.9.992
- Chiaramonte, M., et al. (1999) Rate of incidence of heaptocellular carcinoma in patients with compensated viral cirrhosis. Cancer, 85, 2132-2137. doi:10.1002/(SICI)1097-0142(19990515)85:10<2132::AID-CNCR6>3.0.CO;2-H
- Roa, I., et al. (1997) p53 tumour suppressor gene protein expression in early and advanced gallbladder carcinoma. Histopathology, 31, 226-230. doi:10.1046/j.1365-2559.1997.2420850.x
- Hogmo, A., et al. (1998) Nuclear DNA content and p53 overexpression in stage I squamous cell carcinoma of the tongue compared with advanced tongue carcinomas. Molecular Pathology, 51, 268-272. doi:10.1136/mp.51.5.268
- Yaziji, H., et al. (1996) Role of p53 immunohistochemistry in differentiating reactive gliosis from malignant astrocytic lesions. American Journal of Surgical Pathology, 20, 1086-1090. doi:10.1097/00000478-199609000-00006
- Ojanguren, I., et al. (1995) p53 immunoreactivity in heap- tocellular adenoma, focal nodular hyperplasia, cirrhosis and hepatocellular carcinoma. Histopathology, 26, 63-68. doi:10.1111/j.1365-2559.1995.tb00622.x
- Raedle, J., et al. (1995) Alpha-fetoprotein and p53 autoantibodies in patients with chronic hepatitis C. Digestive Diseases and Sciences, 40, 2587-2594. doi:10.1007/BF02220446
- Ojanguren, I., et al. (1996) p53 immunoreaction in heaptocellular carcinoma and its relationship to etiologic factors. A fine needle aspiration study. Acta Cytologica, 40, 1148-1153. doi:10.1159/000333973
- Wee, A., et al. (1994) Fine needle aspiration biopsy of hepatocellular carcinoma. Diagnostic dilemma at the ends of the spectrum. Acta Cytologica, 38, 347-354.
- Darnton, S.J. and Jenner, K. (1998) Microwave irradiation lowers immunohistological detection thresholds for p53 protein in squamous epithelium from non-neoplastic oesophagus. The Journal of Pathology, 185, 334-335. doi:10.1002/(SICI)1096-9896(199807)185:3<334::AID-PATH36>3.0.CO;2-0
- Iakova, P., Timchenko, L. and Timchenko, N.A. (2011) Intracellular signaling and hepatocellular carcinoma. Seminars in Cancer Biology, 21, 28-34. doi:10.1016/j.semcancer.2010.09.001
- Guan, Y.S., et al. (2007) p53 gene in treatment of hepatic carcinoma: status quo. World Journal of Gastroenterology, 13, 985-992.
- Hsia, C.C., et al. (2000) Correlation of immunohistochemical staining and mutations of p53 in human hepatocellular carcinoma. Oncology Reports, 7, 353-356.
- Derenzini, M., et al. (1993) Is high AgNOR quantity in hepatocytes associated with increased risk of hepatocellular carcinoma in chronic liver disease? Journal of Clinical Pathology, 46, 727-729. doi:10.1136/jcp.46.8.727
- Aubele, M., Auer, G. and Jutting, U. (1994) Prognostic value of AgNORs in breast cancer. Zentralblatt für Pathologie, 140, 55-60.
- Crocker, J. and McGovern, J. (1988) Nucleolar organiser regions in normal, cirrhotic, and carcinomatous livers. Journal of Clinical Pathology, 41, 1044-1048. doi:10.1136/jcp.41.10.1044
- Dervan, P.A., et al. (1989) Breast carcinoma kinetics. Argyrophilic nucleolar organizer region counts correlate with Ki67 scores. American Journal of Clinical Pathology, 92, 401-407.
- Raymond, W.A. and Leong, A.S. (1989) Nucleolar organizer regions relate to growth fractions in human breast carcinoma. Human Pathology, 20, 741-746. doi:10.1016/0046-8177(89)90066-X
- Ascoli, V., et al. (1990) Nucleolar organizer regions in the fine needle aspirates of lung tumours. Cytopathology, 1, 277-286. doi:10.1111/j.1365-2303.1990.tb00361.x
- Allen, J.P. and Gallimore, A.P. (1992) Nucleolar organizer regions in benign and malignant glandular lesions of the cervix. The Journal of Pathology, 166, 153-156. doi:10.1002/path.1711660211
- Pich, A., Margaria, E. and Chiusa, L. (2002) Significance of the AgNOR in tumor pathology. Pathologica, 94, 2-9.
- Yu, C.C., et al. (1992) A comparison of proliferating cell nuclear antigen (PCNA) immunostaining, nucleolar organizer region (AgNOR) staining, and histological grading in gastrointestinal stromal tumours. The Journal of Pathology, 166, 147-152. doi:10.1002/path.1711660210
- Shiro, T., et al. (1993) A correlation of argyrophilic nucleolar organizer regions with stages of hepatocellular carcinoma. Cancer, 71, 44-49. doi:10.1002/1097-0142(19930101)71:1<44::AID-CNCR2820710108>3.0.CO;2-L
NOTES
*Shahida Parveen and Riffat Mehboob are joint first authors.