Engineering
Vol.09 No.02(2017), Article ID:74407,29 pages
10.4236/eng.2017.92007
Bond Durability of Carbon-Microfiber-Reinforced Alkali-Activated High-Temperature Cement Adhering to Carbon Steel
Toshifumi Sugama, Tatiana Pyatina
Brookhaven National Laboratory, Sustainable Energy Technologies Department, Upton, NY, USA

Copyright © 2017 by authors and Scientific Research Publishing Inc.
This work is licensed under the Creative Commons Attribution International License (CC BY 4.0).
http://creativecommons.org/licenses/by/4.0/


Received: November 6, 2016; Accepted: February 24, 2017; Published: February 27, 2017
ABSTRACT
The study aims at evaluating the bond durability of a carbon microfiber (CMF)-reinforced alkali-activating calcium aluminate cement (CAC)/fly ash F (FAF) blend cementitious material adhering to carbon steel (CS) under stresses induced by a 350˚C heat-25˚C water cooling cycle. This cementitious material/CS joint sample was originally prepared in an autoclave at 300˚C under a pressure of 8.3 MPa. For comparison, two reference geothermal well cements, Class G modified with silica (G) and calciumaluminum phosphate (CaP), were employed as well reinforced with CMF. In the CAC/FAF blending cement systems, the CAC-derived cementitious reaction products preferentially adhered to CS surfaces, rather than that of FAF-related reaction products. CMF played a pivotal role in creating tough interfacial bond structure of cement layer adhering to CS. The bond toughness also was supported by the crystalline cementitious reaction products including sodalite, brownmillerite, and hedenbergite as major phases, and aragonite, boehmite, and garronite as minor ones. The brownmillerite as an interfacial reaction product between cement and CS promoted the chemical bonding of the cement to CS, while the other phases served in providing the attractive bonding of the cement to CS. The post-stress-test joint samples revealed the formation of additional brown- millerite, aragonite, and garronite, in particular brownmillerite as the major one. The combination of chemical bonding and self-advancing adherence behavior of the cement was essential for creating a better interfacial bond structure. A similar interfacial bond structure was observed with CaP. The crystalline phase composition of the autoclaved cement revealed apatite, zeolite, and ferrowyllieite as major reaction products, and aragonite and al-katoite as the minor ones. Ferrowyllieite was identified as cement/CS interfacial reaction product contributing to the chemical bond of cement, while the other phases aided in providing the attractive bond of cement. After a stress test, two phases, ferrowyllieite and aragonite, promoted the self-advancing adherence of cement to CS. However, the effectiveness of these phases in improving adherence performance of cement was less than that of CAC/FAF blend cement, reflecting the fact that the bond durability of CAC/FAF blend cement was far better than that of the CaP. In contrast, the autoclaved silica-modified G cement consisting of xonotlite, and 0.9 nm-to-bermorite and riversideite, with calcite as the crystalline reaction products, had no significant effect on improving the shear bond strength and the bond’s toughness. No interaction product with CS was found in the cement adhering to CS. After a stress test, the calcite phase acted only to promote the self-advancing adherence of cement, but its extent was minimal compared with that of the other cements, thereby resulting in poor bond durability.
Keywords:
Carbon Microfibers, Calcium Aluminate Cement, Fly Ash, Thermal Shock

1. Introduction
One of the principal challenges in ensuring the integrity of geothermal wells is the stability and integrity of the cement sheath surrounding the carbon-steel casings during conditions of thermal shock. In installing conventional hydrothermal wells, considerable attention is paid to the initial operation of the production wells because a very hot geo-fluid in reservoir comes up through the production casing to the cement located in surface region that is at a relatively mild temperature of about 80˚C to 100˚C. The temperature of the casing adhering to the cement may rapidly rise by several hundred degrees. Such a large thermal gradient caused by the fast heating effect of the production geo-fluid generates undesirable thermal tensional stress in the interfacial boundary regions between the casing and cement; it is evident in terms of thermal shock (TS) to the cement sheath, so increasing the likelihood of potential failures, such as its disbanding from the casing’s surface, and also creating cracks that may entail the well’s catastrophic failure. Differences in temperature between the injection-fluids and the production-heat-carrier fluids further may impose constant TS on the cement. In enhanced geothermal systems (EGSs), the cement experiences additional thermal stress during the stimulation process when large volumes of cold water are injected through the hot wells to create a connected network structure of multi-fractures, which can extract geothermal-heat energy. In this case, the injection of cold water causes the shrinkage of the casing, raising concerns that axial-internal casing generates tensile stress; contrariwise, when this injecting operation is completed, the temperature of the casing increases, leading to its expansion that changes from tensile stress into compressive stress. Thus, such repeated exchanges from tensile ↔ compressive-induced stress in the casing are detrimental to integrity of cement sheath, so establishing a potential risk for failure of the cement’s bonding and the disbandment of cement from the casing’s surface [1] [2] [3] .
To deal with this issue, our previous work was devoted to developing thermal shock-resistant cements withstanding possibly large variations in temperature. In this work, focus centered on evaluating the potential of sodium metasilicate (SMS)-activated calcium aluminate cement (CAC)/Class F fly ash [fly ash F, (FAF)] blend for use as a thermal shock-resistant cement (TSRC) [4] [5] . At the hydrothermal temperatures of 200˚C and 300˚C, this cement formed three major crystalline phases, 1) hydro-garnet including katoite [Ca3Al(OH)6] and hydrogrossular [Ca3Al2Si2(OH)4], 2) fledspar minerals, including dmisteinbergite and anorthite [CaAl2Si2O8], 3) hydro-ceramic including analcime [NaAl(Si2O6)(H2O)] calcium A-type zeolite [Linde A, Ca6(AlSiO4)13∙30H2O], hydroxysodalite [Na4Al3Si3O12(OH)], and Na-P-type zeolite (Na3Al3Si5O16∙6H2O), and 4) hydro-Al oxide including gibbsite [Al(OH)3] and boehmite (γ-AlOOH). These phases were responsible for its good thermal- and hydrothermal-stabilities at >300˚C, and the retention of compressive strength of >6.89 MPa after five superheating-cooling cycles (one cycle: 500˚C heat for 24 hrs and 25˚C water- quenching). In such FAF blends with CAC, the FAF initially acts as a temporary filling and packing responsible for densifying and strengthening the first binding phases of CAC hydrates at an early curing stage. Subsequently, the dissolution of FAF by the alkaline activators, followed by the pozzolanic reactions, leads to the formation of a secondary binding phase, such as an amorphous Na2O-, CaO-Al2O3-SiO2-H2O gel [6] [7] [8] [9] . Thus, the prompt reaction of CAC assures the early development of strength. Nevertheless, the combined systems of CAC and FAF had better thermal stability than did CAC alone.
In addition to these properties, the cementitious material must assure the well’s long-term integrity, zonal isolation and casing protection. Thus, it must possess high resilience and toughness to survive under the harsh environment of geothermal wells. In an attempt to improve the compressive toughness of the TSRC, polyacrylonitrile (PAN) precursor-derived carbon microfibers (CMF), 7 - 9 µm in diameter and 100 - 200 µm long, was incorporated into it [10] . Consequently, CMF played the following five specific roles in improving cement’s properties; 1) minimizing the shrinkage, 2) impeding the development of cracks, 3) arresting the cracks’ propagation, and 4) enhancing the post-crack ductile performance. Furthermore, the magnitude of the fibers’ efficiency in increasing the toughness depended on the hydrothermal temperature; namely, it rose as temperature increased. In fact, at 300˚C, an efficiency of >150% was attained by adding only 3 wt% fiber to the TSRC. Two major factors governed the performance of the fibers: One was the uniform distribution of the fiber throughout the cement matrix due to their good wetting behavior with the cement’s pore- solution; the other advantage was the fiber’s interactions with the cement matrix. In the latter, metal-complexed carboxylate groups present on the fibers’ surfaces seem to play an important role in improving the adherence of the cement to the fibers. The moderate bond at the cement-fiber interfaces prevented the growth of micro-cracks, conferred resistance to the development of cracks, arrested the cracks’ propagation, as well as enhanced the post-cracks’ ductile performance.
Based upon this information above, the objective in this study was to assess the adhesive behaviors and bond durability of the 300˚C-autoclaved CMF-rein- forced TSRC to carbon steel (CS) casing before and after the 350˚C heating- 25˚C water cooling cycle test to generate interfacial tensional stress in the cement sheath samples surrounding the CS tubes. The factors to be assessed included the changes in shear-bond strength at the cement sheath/tube joints after cyclic heat-cooling-induced tensional stresses, the cement-metal bonding mechanisms, the interfacial bonds’ failure modes, topographical mapping of cement remained on CS surfaces after bond failure; it also included phase-identification, -composition, and -transformation of the amorphous- and crystalline-reaction products formed in the cement layer adhering to the CS surfaces. Additionally, the single lap shear-adhesion test on the joints of the CS plate/cement adhesive/CS plate before and after the heat-cooling tensional stress cycle test simulated to that of the cement-sheath samples also was conducted to support the results of shear bond strength. For comparison, two reference cementitious materials, Class G modified with crystalline silica cements and calcium aluminate phosphate cements, were evaluated in the same manner.
2. Experimental Procedures
2.1. Materials
Carbon microfibers (CMF, AGM-94) derived from a polyacrylonitrile (PAN) precursor, were supplied by Asbury Graphite Mills, Inc.: they were a powder-like product with 7 - 9 µm in diameter and 100 - 200 µm long. Class F fly ash (fly ash F, FAF) was obtained from Boral Material Technologies, Inc.: its chemical composition detected by micro energy-dispersive X-ray spectrometer (µEDX) was as follows: 50.4% SiO2, 34.8% Al2O3, 7.1% Fe2O3, 3.1% K2O, 2.7% CaO, 1.6% TiO2, and 0.4% SO3. A sodium metasilicate (SMS) granular powder under the trade name “Metso Beads 2048,” supplied by the PQ Corporation served as the alkali activator of FAF. Its chemical composition was 50.5 wt% Na2O and 46.6 wt% SiO2. Calcium aluminate cement (CAC, Secar #80) was supplied by Kerneos Inc. The X-ray powder diffraction (XRD) data showed that the crystalline compounds of FAF had three major phases, quartz (SiO2), mullite (3Al2O3∙2SiO2), and hematite (Fe2O3), while CAC encompassed three crystalline phases, corundum (α-Al2O3), calcium monoaluminate (CaO∙Al2O3, CA), and calcium dialuminate (CaO∙2Al2O3, CA2).
Three different dry-blend formulas, 60/40, 40/60, and 20/80 CAC/FAF ratios by weight, were employed in this study. The SMS was added at 6.0% by total weight of each blend. For the reference materials, the formula of dry Class G (G) well cement was 70 wt% Class G and 30 wt% quartz fine powder blend, while the dry calcium aluminate phosphate (CaP) cement consisted of 47.2 wt% Secar #51 CAC (obtained from Kerneos Inc), 47.2 wt% FAF, and 5.6 wt% sodium hexametaphosphate [SHMP (NaPO3)6, supplied by Aldrich)]. The XRD data for Secar #51 CAC revealed the presence of gehlenite [Ca2Al(Al, Si)2O7, C2AS] as the dominant phases coexisting with CA and corundum as the secondary one. For all cements including the references, CMF at 10% by weight of each blend was added to them to prepare one dry cement mixture. The CMF-free unreinforced and reinforced blend cement slurries were prepared by adding an appropriate amount of water to the dry mix cement. The water/cement ratio by weight ranged from 0.49 to 0.50 and from 0.5 to 0.52, respectively, for all dry unreinforced and reinforced cements. The casing tubes (22 mm in diameter by 2.5 mm thick by 128 mm long) and plates (32 mm wide by 100 mm long by 0.9 mm thick)fabricated by AISI 1008 carbon steel (CS) were used as metal substrates. Before preparing the cement/substrate joint samples, these substrates were cleaned in the following procedures: First, they were immersed in an 5 wt% alkaline cleaning solution #4429 (supplied from American Chemical Products) that was stirred at 40˚C for 20 min; second, the cleaned substrates were rinsed with tap water at 25˚C; finally, these substrates were dried for 24 hours in air at room temperature.
The cements sheath samples surrounding the CS tube were prepared in the following sequences: First, the disk-shaped wood tube-holder (49 mm diam. by 13 mm high) with a center hole (28 mm diam. by 23 mm high ) was placed at the bottom of the cylindrical paper-mold of 50 mm in diameter by 100 mm long; second, the tube was inserted into the center hole of a casing holder located at bottom of the mold; third, the hand-mixed cement slurry was poured in an annular space between tube and mold to prepare a cement sheath sample of 14 mm thickness by 74 mm high. Next, the samples were pre-cured for 24 hours in 100% relative humidity (R.H.) at 85˚C; fourth, the pre-cured cement sheath sample was removed from paper mold, and then autoclaved for 24 hours at 300˚C under pressure of 8.3 MPa; and, finally, the autoclaved cement sheath surrounding CS tube was used for measuring the shear bond’s strength. The lap-shear adhesion test was conducted to determine the adhesive force of the CMF-reinforced cement coupling between CS plates according to modified ASTM D5868 for single-lap-joint sample. In preparing these samples, two plates, each 32 mm wide by 100 mm long, by 0.9 mm thick, were bonded together with cement; the overlapped cement-covered area was 1280 mm2 (40-mm long by 32 mm wide). The cement was pre-cured in 100% R.H. under a loading substance of 16 g, and then a pre-cured sample of two metal plates with cement between them without any loading was autoclaved at 300˚C for 24 hours for the lap-shear adhesion test.
Using these cement sheath and single-lap-joint samples, the heating-water cooling cycle-induced tensional stress test were conducted; namely, in one cycle, the 300˚C-autoclaved samples were placed in an air oven at 350˚C for 24 hours, and next, 25˚C water was passed through the inner-tube in the sheath samples for 5 minutes; it also came in contact with one side of the lapped metal’s surfaces in lap-joint sample for 5 minutes. This 350˚C heating ® water cooling cycle was repeated seven times.
2.2. Measurements
The shear bond strength at the tube/cement sheath joints, and also the single-lap-shear adhesion at the plate/cement adhesive/plate joints before and after heat-cooling stress cycle tests were measured using Electromechanical Instron Model 5967. To obtain information on the interfacial bond failure mode at the cement/CS joints and the adhesive behaviors of cement to the CS’s surfaces, we undertook micro-image analyses, oxides’ composition survey, and topographical elemental mapping analysis for the interfacial CS-surface side separated from the cement layer after a lap shear bond test, using μ-EDX. Furthermore, XRD (Philips XRG 300 X-ray diffractometer) and Attenuated Total Reflectance-Fourier Transform Infrared Spectroscopy (ATR-FTIR) were employed to identify the cement’s hydration products and their compositions responsible for developing adequate bonding to CS, and also to investigate the transformation of these products and changes in their compositions adhering to CS after stress test. XRD data were analyzed using the PDF-4/Mineral 2013 database of the International Center for Diffraction Data, including a semiquantitative analysis of phase composition, based upon the total intensity of the d-spacing representative of each identified phase.
3. Results and Discussion
3.1. Shear Bond Strength and Lap Shear Adhesive Force
Figure 1 shows the shear bond strength at interfaces between the cement sheath and the CS tube for 300˚C-autoclaved 60/40, 40/60, and 20/80 CAC/FAF ratio
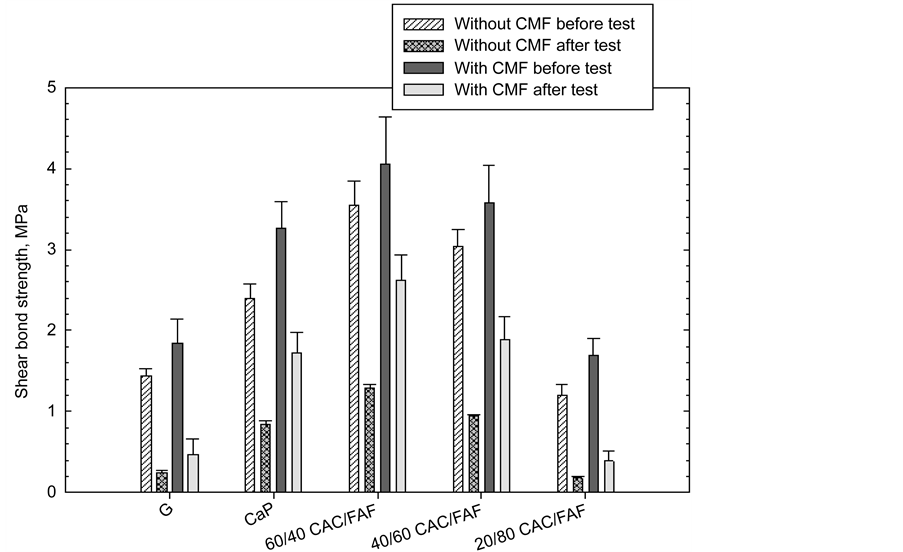
Figure 1. Shear bond strength of various cement sheath samples with and without CMF before and after a 7-cycle heat-cooling tensional stress test.
cements, and G and CaP as the reference cements with and without CMF before and after the 7-cycle stress test.
For CMF-free samples before the test, G and CaP cements had shear bond strength of 1.44 and 2.4 MPa, respectively; this value for CaP was 67% higher than that of G. The highest strength of 3.55 MPa was obtained at the interfaces between the 60/40 ratio and CS. This value declined to 3.04 and 1.2 MPa when the proportion of CAC to FAF was decreased from 60/40 to the 40/60 and 20/80 ratios, suggesting that CAC preferentially served in developing the interfacial bond strength, rather than did FAF. When all these cements were fortified with CMF, their bond strength rose over range of as high as 42% to as low as 14%.
For the post-stress test samples, the shear bond strength for both the cements with and without CMF fell markedly. Figure 2 depicts the rate of this decrease in unreinforced- and CMF-reinforced cements. As is evident from this result, the magnitude of this rate depended on two principal factors: One was whether CMF was incorporated or not; the other was the kind of cements. For the former, adding CMF appeared to minimize this rate, compared with that of CMF- free cements incurring a rate of more than 60%.
Assessing the kind of cements, three cement systems, CaP, and the 60/40 and 40/60 ratios, had a lower rate of reduction in strength, ranging from 35- to 47-%. In contrast, a considerable high rate of >70% was observed from G and 20/80 ratio cements, implying poor durability of their bonds.
However, it is not clear from this limited information whether such decreased shear bond strength is ineffective or still remains effective in sustaining adequate bond durability under such a stressful environment, and also whether there is a further decrease in bond strength during an extended exposure.
To support the information described above, Figure 3 plots the results from
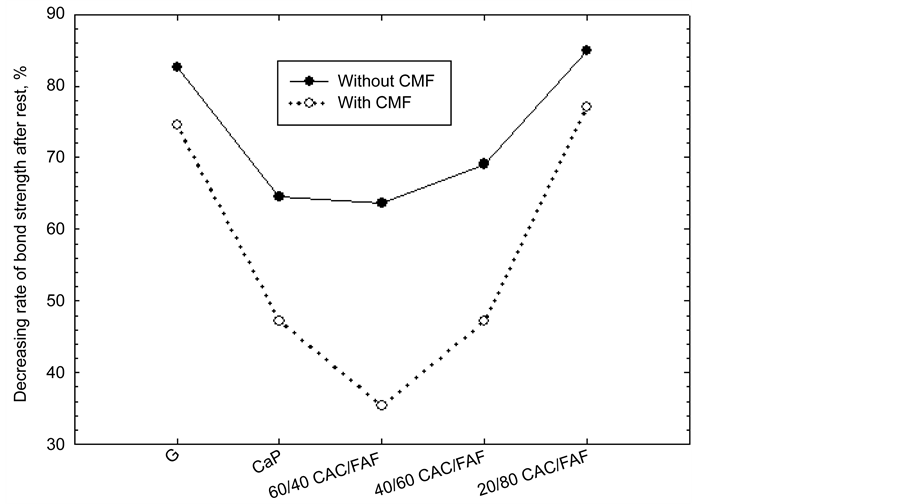
Figure 2. Decreasing rate of shear bond strength after the stress test.
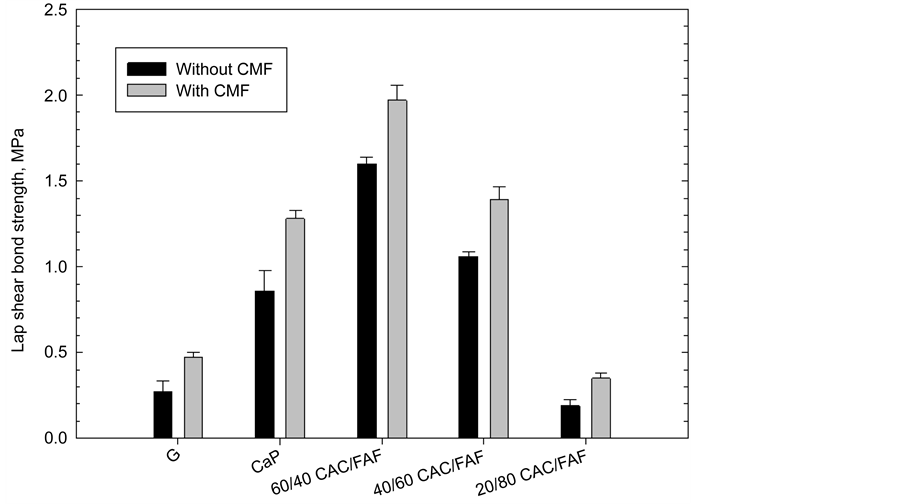
Figure 3. Lap shear bond strength for various unreinforced- and CMF-reinforced-cement adhesives at CS plate/adhesive/CS plate joints.
lap shear bond strength test for samples of single CS plate/unreinforced or CMF- reinforced cement adhesive/CS plate lap joints after autoclaving for 24 hours at 300˚C. The overall results closely resembled those from the cement sheath-based shear bond strength; CMF offered an improved lap shear bond for all cement systems.
Since the shear stretching of interfacial bonds takes place when the separation of the cement layer from CS began at the interfacial transition zones, a good stretching behavior along with high shear bond strength reflects the tough- and flexible-interfacial bonds restraining the initiation of cracks in the cement adjacent to CS, and arresting their propagation. By contrast, poor stretching behavior, expressed in terms of brittle interfacial bonds, would cause their rapid bond rupture and the fast propagation of cracks.
In an attempt to estimate the stretching rate of the cement layer bonding adhesively between two CS plates at the failure of interfacial bond, we measured the % value of the tensile strain (extension), at the end of tensile lap shear stress- strain curves (Figure 4) for cements with and without CMF. As shown, CMF not only conferred a high ultimate tensile-stress on the cements, but also prominently prolonged the tensile-strain at the end of the curve representing the bond failure, compared with that without CMF, implying that the bond toughness of cement was significantly improved by CMF. Figure 5 compares the value of the lap shear tensile extension for various cements with and without CMF. The data revealed that CMF prolonged tensile extension at bond failure in all cements; in particular, the stretching rate of three cements, CaP, and the 60/40- and 40/60- ratios, was nearly 2.0 fold higher than that of unreinforced one.
In 7-cycle stress tests (Table 1), all CMF-free cements failed before reaching 7
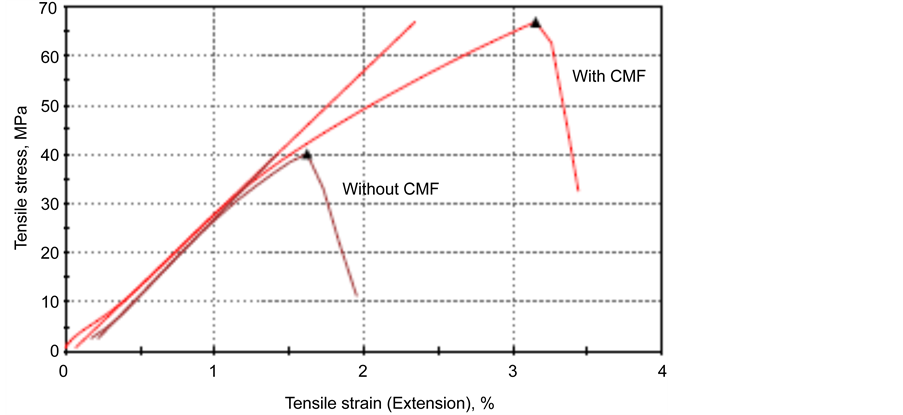
Figure 4. Typical tensile lap shear stress-strain curves for cements with and without CMF.
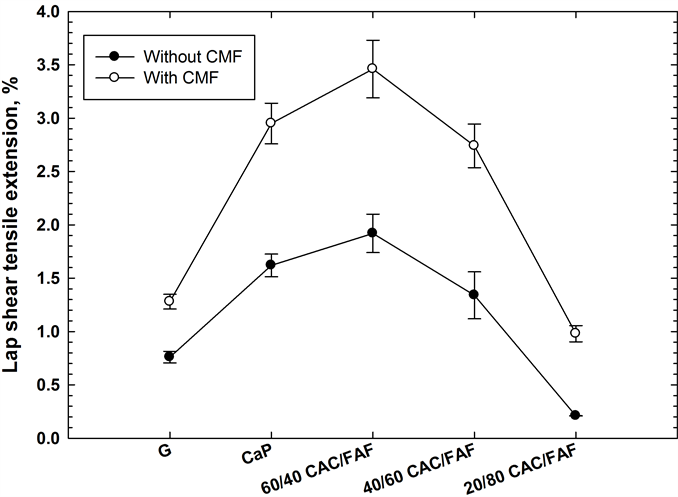
Figure 5. Effect of CMF on improving shear bond toughness of various cements.

Table 1. Lap shear bond strength for various cement adhesives with and without CMF after a 7-cycle heat-cooling-induced tensional stress test.
cycles. Although the 60/40 ratio cement displayed the best bond durability in extending the number of cycle, it failed after 4 cycles. Next best was the CaP adhesive, corresponding to 3 cycles, while the 40/60 ratio adhesive was separated from CS after 2 cycles and the other cements, G and the 20/80 ratio, no longer behaved as adhesives after only one cycle. With CMF, the bond durability of all cement systems was enhanced by different magnitudes; in fact, three cement systems, CaP, and the 60/40- and 40/60-ratios, withstood the 7-cycle tensional stresses and were responsible for developing lap shear bond strength of 0.31, 0.88, and 0.27 MPa, respectively. These values corresponded to a 75.8, 55.4, and 80.1% reduction of bond strength for CaP, and 60/40 and 40/60 ratios, respectively, compared with that of untested samples. Thus, this result demonstrated that the creation of tough interfacial bond structure by CMF played an important role in improving the bond durability of cement under conditions of the tensional stress. Furthermore, the most effective cement in improving bond durability in this environment was 60/40 CAC/FAF ratio.
3.2. Adherent Behaviors
To visualize and characterize the adhesive behaviors of these cements to the CS substrate, our attention was payed to investigating the modes of shear bond- failure at the interfacial transition zone between 300˚C-autclaved CMF-rein- forcing cements and CS before and after the stress tests. This investigation was carried out by using µ-EDX, which is useful for quantitative analysis of individual elements and their oxides on the solid surface layer up to around 1.5 µm thickness as X-ray penetration depth [11] ; it focused on estimating the coverage of cement adhering to CS surfaces for the shear bond-raptured samples before and after the stress testing. Among the chemical oxides of cements, three major ones, CaO, Al2O3, and P2O5, were chosen for quantitative analysis of the oxides present in the cements. Although the cements contain some Fe2O3 as minor constituent, its quantity also was determined as an oxide from the underlying CS covered with a cement layer ≤ 1.5 µm thick and cement-unbonded CS surface site, then, the proportions of these cement-related oxides to Fe2O3 for the CS surfaces separated from the cement layer were determined in a 3.0 mm2 area of the CS’s surface. Figure 6 gives the CaO/, Al2O3/, and P2O5/Fe2O3 ratios for various cements adhering to CS before the test. The G cement revealed the presence of only a Ca element, reflecting a 0.063 CaO/Fe2O3 ratio, and it was very difficult to detect the presence of Al. The presence of more Ca at the 0.081 CaO/Fe2O3 ratio and a few Pelements were detected from CaP. The 60/40 ratio had the highest Ca and Al contents corresponding to 0.108- and 0.035-CaO/and Al2O3/Fe2O3 ratios, highlighting that the CS’s surface was covered and occupied with the largest amount of this cement, compared with that of all the other cements. Thus, this cement showed a great adherence to CS. The incorporation of more FAF into the CAC like 40/60 ratio engendered a decrease in the content of Ca and of Al. A further decline in the presence of these elements was detected on the 20/80 ratio, demonstrating that the coverage of CS by the cement tends to decline when the
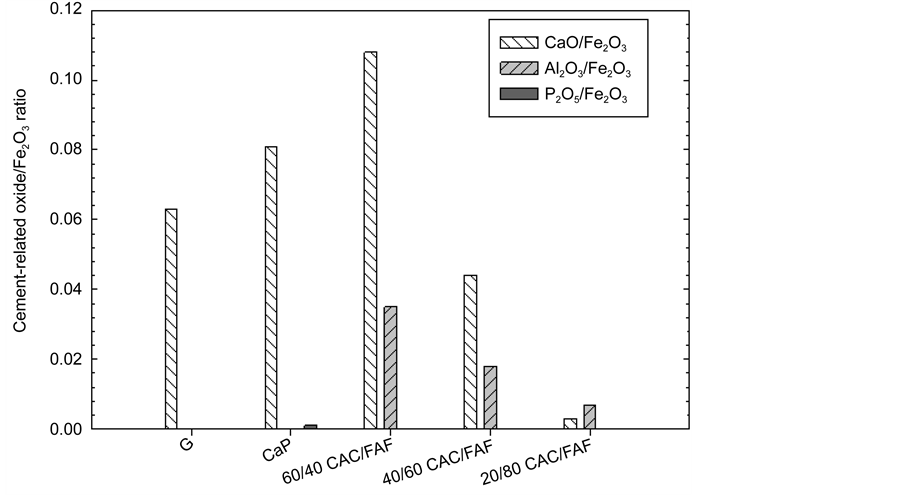
Figure 6. CaO/, Al2O3/ and P2O5/Fe2O3 ratios of cements adhering to the CS side before the stress test.
CAC/FAF ratio is decreased. This fact was directly related to the results from previous study described earlier in the introduction section; namely, the CAC acted as an initial cementitious binder, responsible for strengthening this blended cement in earlier hydration period, strongly verifying that CAC’s hydration products preferentially adhered to CS, rather than that of FAF as secondary binder. As for the adhesion of FAF-derived cementitious materials, the FAF-rich 20/80 ratio had 0.007 Al2O3/Fe2O3 ratio that was more than twice as higher as that of the CaO/Fe2O3 ratio. Since FAF-contains mullite (3Al2O3∙2SiO2) as one of the major phases, there was no doubt that some FAF-related secondary cementitious phases adhered to CS.
Figure 7 depicts the CaO/, Al2O3/, and P2O5/Fe2O3 ratios for G, CaP, and the 60/40 ratio cements after the stress test. For G, there was no significant change in the CaO/Fe2O3 ratio, compared with that of before the test, implying that the interfacial bond of this cement remained in the effect and withstood this cyclic tensional stress. In contrast, CaP caused an increase in CaO/ and P2O5/Fe2O3 ratios, while the appearance of Al element was observed. This finding obviously verified the fact that the surface of CS was further occupied by this cement after the test. Hence, the stress test promoted the adherence of CaP to CS, in terms of self-advancing adherent behavior. A similar behavior was observed for the 60/40 ratio; namely, 0.134 and 0.044 CaO/ and Al2O3/Fe2O3 ratios were found, tantamount to a 24% and 26% gain, respectively, compared with that before the test.
The information described above was supported by EDX topographical elemental mapping using the same samples. From these results, CaO was the major oxide adhering to CS among the oxides present in all cements. Thus, Ca element was selected in this topographical mapping analysis. During mapping, the X-ray-
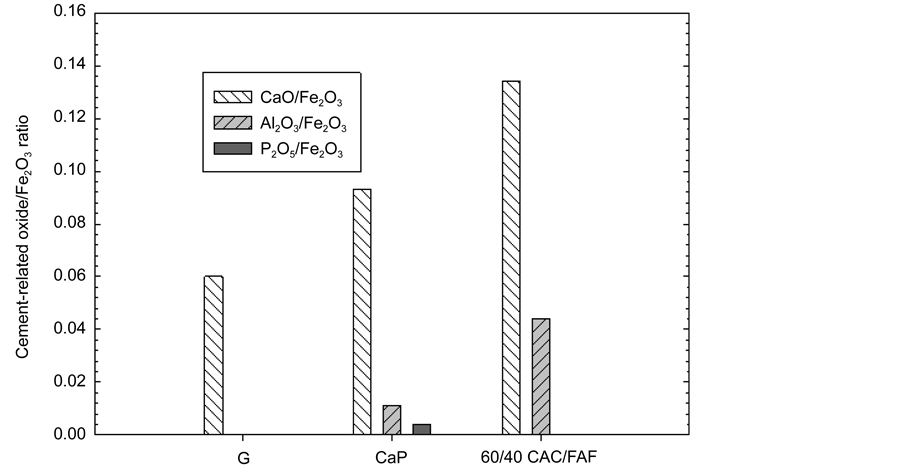
Figure 7. Cement-related oxide/Fe2O3 ratios for the G, CaP, and 60/40 ratio cements adhering to CS after the stress test.
intensity count in the total detected area of 3 mm2, particularly for the 3.7 keV spectral resolution at the Ca Kα energy line, was recorded and used to determine the relative amount of this element and its distribution, so to create a color- coded concentration map. The maximum amount of elemental distribution is given in the color barcode. Further, the concentration of Ca was ranked by the difference in colors; namely, the areas in white and red symbolized the highest relative concentrations of this element. By contrast, dark blue color was assigned to the Ca-free area belonging to the underlying CS substrate.
For the 300˚C-autoclaved samples before the stress test (Figure 8), the mapping images revealed the extent of coverage of CS by Ca; its topographical features differed between the various cements. The 60/40 ratio was characterized by two specific images: One was a locally continuous coverage of Ca along with its moderate amount represented by the light blue-, green-, and yellow-colors over the CS’s surface; the other was the area of CS not covered by Ca, represented by dark blue. Thus, the interfacial bond fracture can be interpreted as the mixture of two different failure modes: One mode was the cohesion wherein the fracture took place in the cement layer; the other represented the adhesion wherein the failure occurred at interfaces between the cement and CS. Importantly, in this cement system, the former failure mode was the major one, underscoring its excellent adherence to CS. Even though a similar pattern of color distribution was observed from G, the coverage of Ca was relatively lower than that of 60/40 ratio because of the scattering and spotting image of Ca deposition. This image also indicated that the proportion of the cohesive failure mode to the adhesive mode is likely to be even, implying its moderate bonding. In the case of CaP, as is seen from the cluster of red- and orange-colors attributed to highly concentrated Ca, a massive amount of Ca was deposited locally, along with its continued coverage. However, the image also showed that a relative area that was Ca-occupied was less than that of a 60/40 ratio; the adherent performance of this ratio was better than that of CaP. As expected, in the CAC/FAF blending cement system, the extent of Ca coverage depended on the proportion of CAC to FAF; more replacement of CAC by FAF resulted in a meagre coverage of Ca. Thus, this finding strongly supported the fact that CAC as the initial cementitious binder played a pivotal role in improving the adherent performance of cement, compared with that of FAF as the secondary binder.
Figure 9 represents the Ca topographical mapping images for post-stress test samples of G, CaP, and the 60/40 ratio cements. Compared with that of untested samples, its distinctive feature can be accounted for by the adherence of more
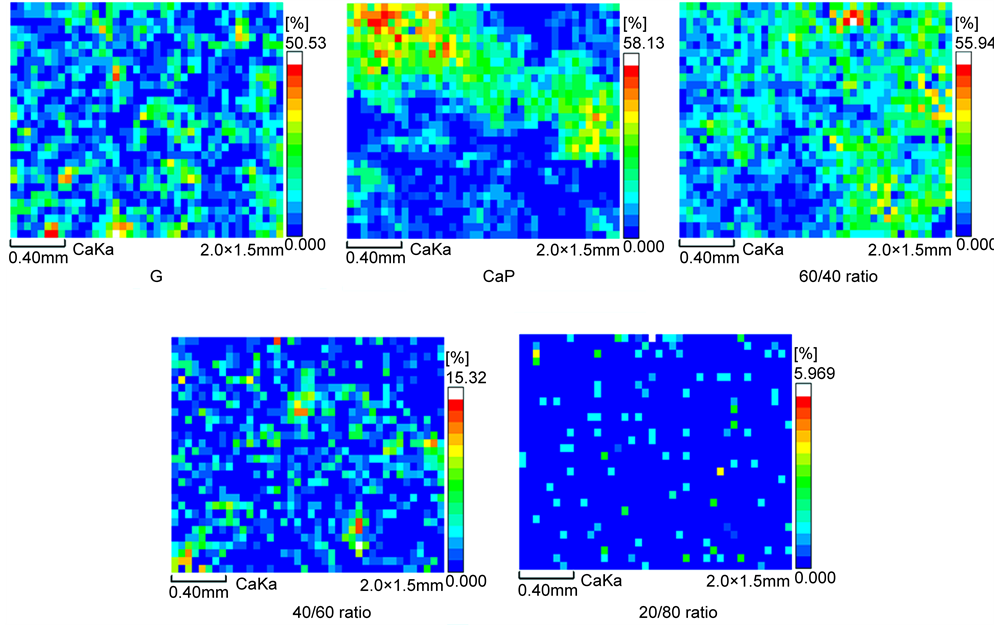
Figure 8. EDX Ca topographical mapping images for 300˚C-autclaved G, CaP, and the 60/40, 40/60, and 20/80 ratio cements adhering to CS surfaces before the stress test.
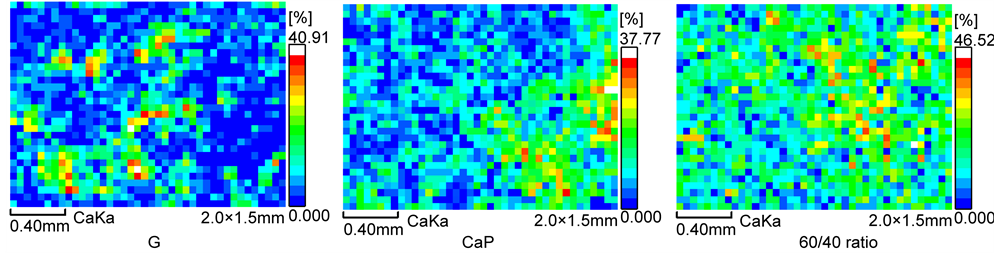
Figure 9. Ca topographical mapping for G, CaP, and 60/40 ratio cements adhering to CS after the stress test.
cement to CS, reflecting an enhanced coverage of Ca, in particularly for CaP and the 60/40 ratio. Thus, these two cements possessed a self-advancing adherent property during the stress test, highlighting a great improvement in their bond durability. From the viewpoint of Ca coverage, coverage by the 60/40 ratio cement was relatively higher than that of CaP, so that the former exerted better self-advancing adherence behavior to improve bond durability compared with that of CaP.
3.3. Phase Identification of Cement Adhering to CS
To obtain information on the phase-composition and -transformation of the amorphous- and crystalline-cement reaction products adhering preferentially to CS surfaces before and after the stress test, ATR-FTIR and XRD analyses were performed for CMF-reinforced G, CaP, and 60/40 ratio cements collected by scrubbing off the cement layer adhering to CS.
3.3.1. ATR-FTIR
Figure 10 shows the ATR-FTIR absorption spectra in region of 1700 to 650 cm−1 for G cement before and after the stress tests. The spectrum before the test encompassed the eleven representative absorption bands: Those at three bands, 1487, 1452, and 1415 cm−1, were due to the C-O anti-symmetrical (VasC-O) stretching vibration in carbonate , and correspondingly, the band at 877 cm−1 belonged to O-C-O out-of-plane bending (δO-C-O) in
  [12] [13] [14] . The bands at 1198 and 668 cm−1 were associated with the S-O symmetric stretching (Vs S-O) and O-S-O out-of-plane bending (δo-s-o), respectively, of sulfate
  in gypsum [15] [16] . The calcium silicate hydrate-related Si-O anti-symmetric
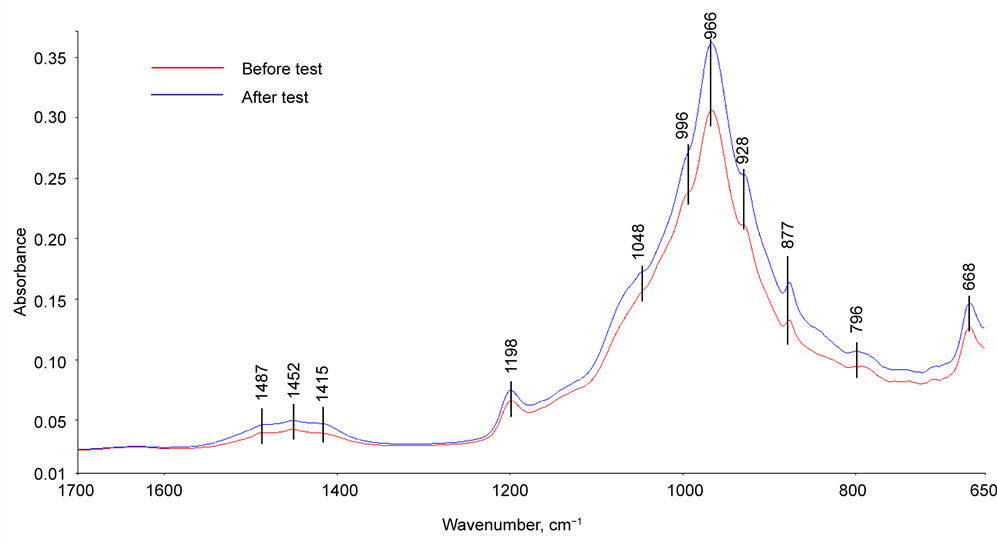
Figure 10. ATR-FTIR absorption spectra of G cement adhering to CS before and after the stress tests.
stretching (VasSi-O) in silicate  can be recognized by the presence of the principal band at 966 cm−1 with shoulders at 996 and 928 cm−1 [17] [18] , while the bands at 1048 and 796 cm−1 were assignable to Si-O anti-symmetric (VasSi-O) and symmetric (VsSi-O) stretching vibrations in silica quartz [19] [20] [21] . After the stress test, the features of spectrum were characterized by the enhancement in intensity of all band peaks related to calciumsilicate hydrates, carbonates, sulfates, and quartz, implying that the post-test cement adhering to CS contained more of these chemical compounds, compared with that of the untested sample.
For the CaP cement (Figure 11), the spectrum before the test reveals the presence of three major groups involving phosphorous [22] [23] [24] [25] , carbonate, and silica; namely, those groups were represented by the P-O anti- symmetric (VasP-O) stretching vibration at 1027 cm−1 band with a shoulder band at 1064 cm−1 and P-O symmetric (VsP-O) stretching at 964 cm−1 of  in calciumphosphate, P-O symmetric (VsP-O) at 731 cm−1 of
  in pyrophosphate groups, VasC-O at 1475 and 1420 cm−1 and δO-C-O at 876 cm−1 in
 , and VasSi-O at 1160 cm−1 and VsSi-O at 797 cm−1 of silica in FAF, while the band at 1642 cm−1 was relevant to the H-O-H bending (δH-O-H) in water. Regarding the pyrophosphate group, there was no information on whether it was associated with Na- (soluble in water) or Ca-(insoluble in water) based pyrophosphate, or both. On the other hand, the peak at 964 cm−1 overlapped on the VsP-O band also was assignable to the M-O (M:Si or Al) anti-asymmetric (VasM-O) stretching mode in the Na+-O-Si-O-Al linkage related to amorphous- or crystalline-sodium aluminum silicatehydrate [Na2O-Al2O3-SiO2-H2O(N-A-S-H)] and sodium calcium aluminum silicatehydrate [Na2O, CaO-Al2O3-SiO2-H2O(N,C-A-S-H)] as the reaction products [26] [27] [28] [29] . Thus, it is possible to rationalize that the
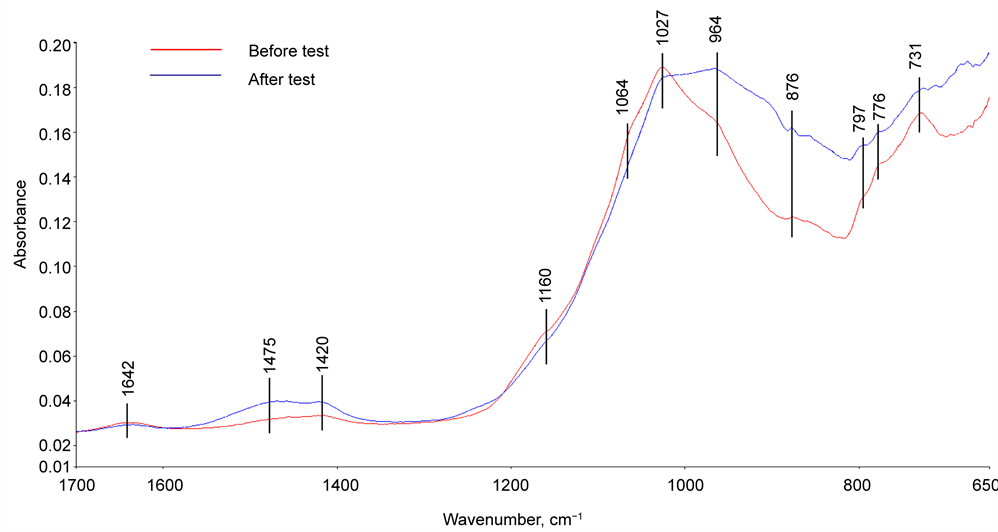
Figure 11. ATR-FTIR absorption spectra of CaP cement adhering to CS before and after the stress tests.
N-A-S-H and N,C-A-S-H systems coexisting with calcium-phosphate and -pyrophosphate were assembled through the hydrothermal interactions between the Na+ liberated from SHMP, as the cement-forming reactant and the aluminosilicate anhydrous (mullite, 3Al2O3∙2SiO2) in FAF, and calcium aluminate silicate (gehlenite, Ca2Al(Al, Si)2O7) in CAC. Correspondingly, the band at 776 cm−1 can be interpreted as the M-O symmetric (VsM-O) stretching mode in the M-O-Si linkages.
For the post-tested sample, the features of spectrum differed from that of the untested one. There were three major differences: First, the line signal of carbonate-related bands at 1475 and 1420 cm−1 was intensified, implying the incorporation of more carbonated compounds into the cement adjacent to CS; second, the overlapped peaks at 964 cm−1 of phosphate-related VsP-O and M-O-Si linkage-related VasM-O became one of the major bands; and, third, the intensity of pyrophosphate-related VsP-O peak at 731 cm−1 strikingly decayed. For the first difference, two potential carbonated compounds were formed during this stress test: One is calcium carbonate; the other is carbonated apatite [24] . With regard to the second and the third ones, the pyrophosphate group may be transferred to the phosphate group during stress test, and also the more N-A-S-H and N,C-A-S-H reaction products are formed in cement layers adhering to CS.
For the 60/40 CAC/FAF ratio cement (Figure 12), similar reaction products to that formed in CaP were detected in the untested sample; among them were the Ca and Na carbonates at the 1468, 1411, and 875 cm−1 bands, amorphous or crystalline N-A-S-H and N,C-A-S-H systems belonging to the 992 and 776 cm−1 bands, and the silica-associated bands at1163 and 799 cm−1. In fact, several investigators reported that when FAF was treated with Na-based alkali activators with Ca [30] [31] and without it [32] [33] [34] , the major peak related to the M
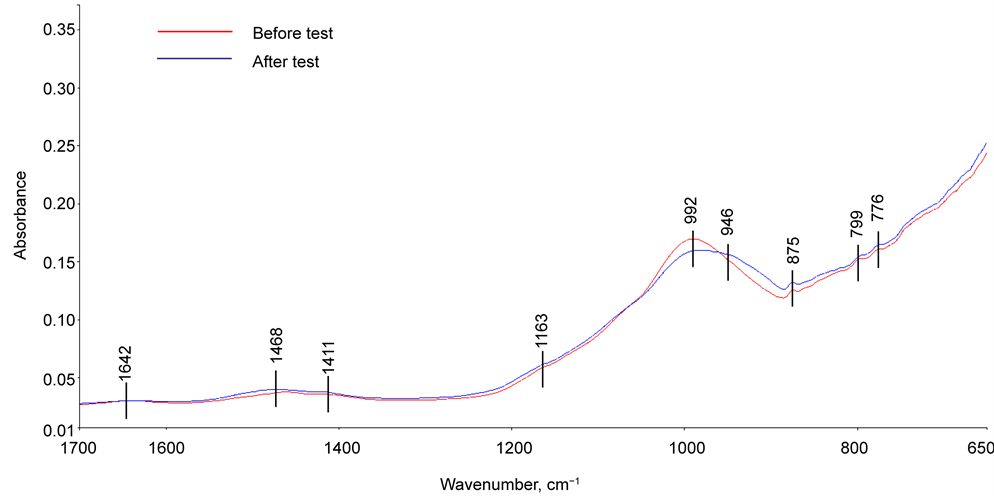
Figure 12. ATR-FTIR absorption spectra of 60/40 CAC/FAF ratio cement adhering to CS before and after the stress tests.
(Al or Si)-O-Si linkage-related VasM-O of aluminum silicate (mullite) in FAF was shifted to a low frequency region, from 1035 cm−1 of non-activated FAF into the range of 1021 - 987 cm−1, corresponding to the presence of the M-O symmetric (VsM-O) mode at the 776 cm−1 band. Such a shift in the frequency was due to the formation of N-A-S-H and N,C-A-S-H as the reaction products between the Na-based alkali activator containing Ca or not and FAF. Furthermore, these reaction products essentially were the amorphous gel phase, which can be transferred to the crystalline zeolite phase during periods of extended hydration. After the test, one major change in the spectral features was the appearance of a new additional band at 946 cm−1. However, there is no experimental evidence whether this new band was due to an amorphous → crystal phase transition and conformational alteration of N-A-S-H and N,C-A-S-H structures, or to the increased conversion rate of FAF into the N-A-S-H and N,C-A-S-H cementitious binders or both during the stress test.
3.3.2. XRD
The emphasis next was directed towards identifying the crystalline phases formed in the cement adhering to CS. To obtain this information, XRD analysis was conducted over the d-spacing, ranging from 2.96 to 0.17 nm.
Figure 13 depicts the XRD patterns for the G cement before and after test. Based upon the XRD patterns, Table 2 summarizes the results from semiquantitative analysis of the crystalline phase compositions formed in G cement adhering to CS. The untested G cement (before) included three typical high-temperature calcium silicate hydrate reaction products, xonotlite [Ca6Si6O17(OH)2], and 0.9 nm-tobermorite and -riversideite [Ca5Si6O16(OH)2]. In addition, the presence of calcite (CaCO3) was identified as the Ca-carbonated product, while the quartz (SiO2), hematite (Fe2O3), and brownmillerite (Ca2Fe2O5) belong to the G and added silica as the starting cement-forming materials. As is well known [35] [36] [37] [38] , brown-millerite in terms of calcium aluminoferrite in general formula
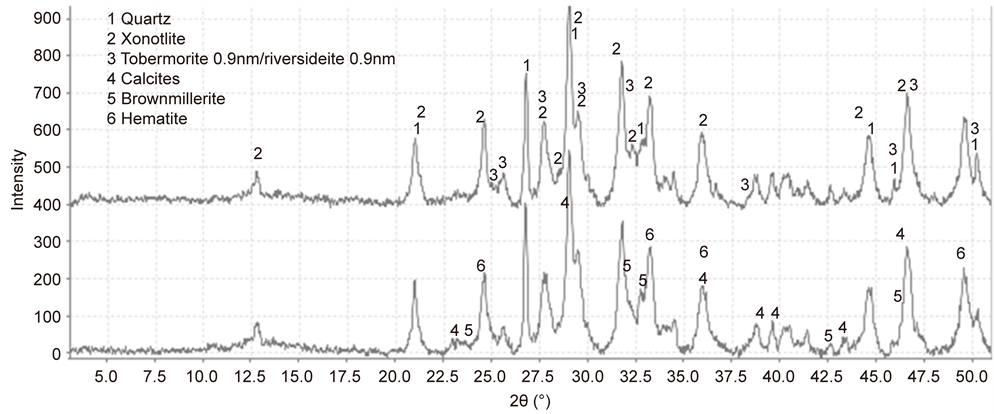
Figure 13. XRD patterns of the 300˚C-autocalved G cement adhering to CS before (top) and after (bottom) stress test.
Table 2. Crystalline phase compositions formed in G cement adhering to CS before and after the stress test.
Ca2(AlyFe2−y)O5, where y can vary from 0 to about 1.33, is the major iron- containing phase in Ordinary Portland Cement (OPC). Thus, these hydrated and carbonated reaction products directly bonded to CS. This bond structure can be categorized as an attractive bond, but not a chemical bond. The data also revealed that the proportion of all calcium silicate hydrates to calcite was 75% to 25%. After the test, among these reaction products, the quantity of the two reaction products, riversideite and calcite, was changed; the former product fell to 9.97% from 13.4%, and the latter was up by 19% to 18.7%, suggesting that this heat-cooling stress environment promoted the carbonation of cement. By contrast, the quantity of the other calcium silicate hydrates, such as xonotlite and 0.9 nm tobermorite, did not change significantly, resulting in the proposition of 70% of all calcium silicate hydrates to 30% calcite.
Relating these findings to the results from measuring both the sheath-shear and lap-shear bonding strength, since the G cement had the lowest bond strength and poor bond durability, compared with that of the CaP and 60/40 ratio, the adhesive force and bond toughness of these reaction products, including calcium silicate hydrates and calcite, appeared to be lower than that of the other reaction products derived from the CaP and 60/40 ratio. In addition, as is described in the µEDX study, the coverage of cement adhering to CS after failure of the shear bond was moderate, and furthermore, there was no significant improvement of this coverage after the stress test. This fact also demonstrated poor affinity of these reaction products with CS.
Figure 14 illustrates the XRD tracing for the CaP cements adhering to CS before and after the test; the results of semiquantitative analysis for the phase compositions assembled in cements are summarized in Table 3. The 300˚C- autclaved cement adhering to CS before test was consisted of four phosphate- related reaction products, ferrowyllieite [Na2Fe2Al(PO4)3], hydroxyapatite [HOAp, Ca5(PO4)3(OH)], carbonated hydroxyapatite [Ca10(PO4)6(CO3)0.5(OH)], and calcium hydrogen phosphate (CaHPO4), along with two zeolite-related reaction products, analcime [Na8Al8Si16O48(H2O)8] and thomsonite [Na2Ca4Al10Si10O40 (H2O)12] coexisting with aragonite (CaCO3) and Al-katoite [Ca3Al2(SiO4)(OH)8] as siliceous hydrogarnet derived from CAC’s hydration. Also, the cement
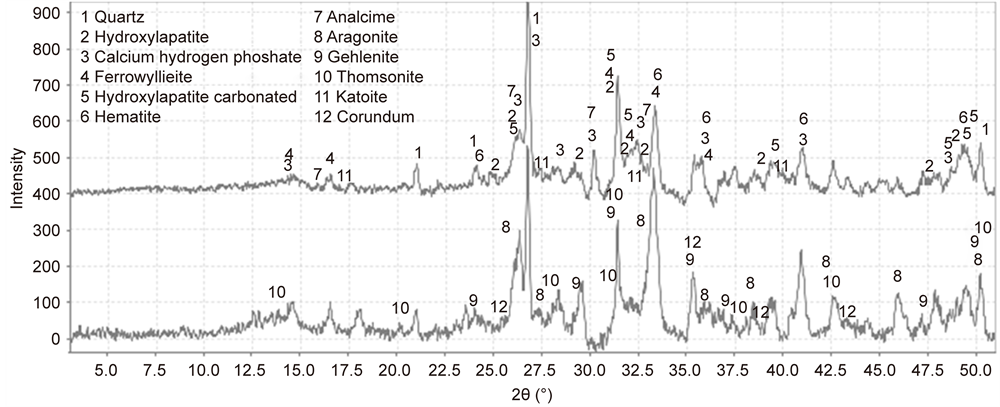
Figure 14. XRD tracings of CaP cement adhering to CS before (top) and after (bottom) the test.
Table 3. Comparison of phase compositions formed in CaP cements before and after the test.
encompassed the non-reacted cement ingredients, such as quartz, gehlenite [Ca2Al(Al, Si)2O7], and corundum (Al2O3) from CAC and hematite (Fe2O3) from FAF as starting materials. Based on this information in conjunction with our previous study [39] , the phosphate-related reaction products including HOAp and calcium hydrogen phosphate were formed by hypothetical hydrothermal interactions between the  hydrolysate reactant liberated from SHMP, [NaPO3]6 + 6H2O →
 + 6H+, and the Ca2+ counter-ion reactant from gehlenite and the CaO∙Al2O3 phases in CAC [40] :
Hydrolysis of gehlenite and CaO∙Al2O3 phases:
Gehlenite; Ca2Al(Al, Si)2O7 + 7H2O +  → 2Ca2+ +
  +
+  + 2H+,
Calcium monoaluminate; CaO∙Al2O3 + 4H2O → Ca2+ + ,
,
Interactions:
Ca2+ +  → CaHPO4 + Na+
CaHPO4 + 4Ca+ +  → Ca5(PO4)3(OH) + 2Na+ + H2O.
There were two types of carbonate,  , ion substitution in the lattice of HOAp: One was its substitution for
  as type A; the other was type B for
  [41] [42] [43] [44] [45] . In our result, the carbonated HOAp was more likely to be associated with type A, rather than type B carbonation because of the lack of OH groups in HOAp, but not the PO4 group. The analcime and thomsonite zeolites were formed by hydrothermal reactions of the free Na+ reactant liberated from PO4-depleted NaHPO4 with the aluminum silicate reactants including mullite in FAF and gehlenite in CAC.
On the other hand, the ferrowyllieite is formed by interactions between four reactants, Na+,  ,
,  , and Fe3+. The sources of the first three ionic reactants are SHMP and CAC. The potential source of ferric ion comes from either the hematite in FAF or Fe oxide at the outermost surface sites of CS, or both. Thus, if the ferric ion is dissociated from the ferric oxide belonging to CS, the ferrowyllieite phase could be classified as the chemical reaction product at the interfaces between cement and CS, and if so, it may to promote the chemical bond of CaP to CS. Interestingly, the quantity of ferrowyllieite phase increased by as much as 52% after the test, while the reduction of hematite was only 16%. This fact can be accounted for by an acceleration of the reactions between CaP and CS during the stress test. The other increased reaction product after the test was aragonite, from 6.5% to 8.2%, while the Al-katoite declined from 3.8% to 2.7%. Meanwhile, all apatite- and zeolite-related phases (HOAp, carbonated HOAp, analcime, and thomsonite) showed no significant changes in quantity after the test. In contrast, calcium hydrogen phosphate rose to 13.0% from 10.3%.
Figure 15 shows the crystalline phase compositions of all reaction products before and after the test. No quantitative analyses were made for the potential formation of amorphous N-A-S-H and N,C-A-S-H gels. As a result, the following three factors were responsible for developing and improving the adhesive force and bond durability at CaP/CS joint: First, a large amount of apatite- related crystals, in particular for calcium hydrogen phosphate, were precipitated on CS surfaces; second, the formation of ferrowyllieite phase as interfacial chemical reaction product acted to couple and link between cement layer and CS, reflecting the chemical bond of cement to CS; and third, during the stress test, additional ferrowyllieite was formed on CS. Like G cement, more calcium carbonate (aragonite) phase yielded in the vicinity of CS.
Relating this information to the results from measuring shear bond strength followed by the bond failure mode, the fact that CaP possessed a far better bond- strength, -toughness, and -durability than that of G, strongly demonstrated that the combination of apatite phases as major contributor for an attractive bond of cement to CS and the ferrowyllieite phase as major contributor for a chemical bond of cement not only offered the improved adhesion of cement to CS, but
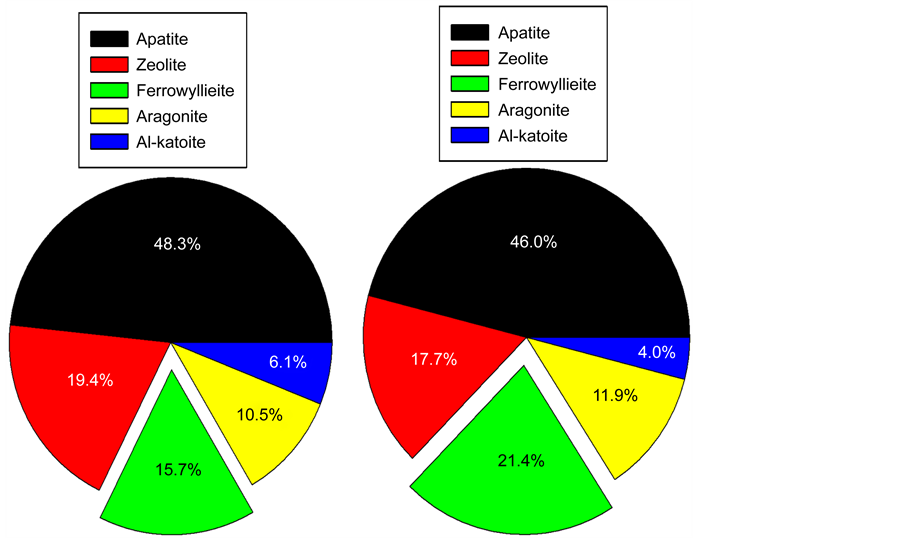
Figure 15. Phase compositions of reaction products formed in CaP cement adhering to CS before the test (left) and afterwards (right).
also provided a good shear bond toughness in the cement at interfacial transition zone between the cement and CS. Particularly, ferrowyllieite promoted a self- advancing adherence of cement to CS during the stress test, thereby extending the coverage of cement over the CS, compared with that of the calcium silicate- related hydrate phases, such as xonotlite, tobermorite, and riversideite that formed in G cement. On the other hand, although this stress test environment led to an improved adherence behavior of cement, the interfacial shear bond strength was reduced after the test. There is no experimental evidence on whether the reasons for such reduction are due to the mechanical- and physical-degradations of cement by interfacial tensional stress, or the carbonation-related phase transformation, or the formation of additional ferrowyllieite, which was beneficial to self-advancing adherence of cement to CS, or all of them.
For the 60/40 ratio, Figure 16 and Table 3 show the XRD results from the untested and post-tested samples. For the former sample, the data indicated the presence of five crystalline hydrothermal reaction products, such as brownmillerite [Ca2(Al, Fe3+)2O5], boehmite [γ-AlO(OH)], sodalite [Na6Al6(SiO4)6], hedenbergite [CaFeSi2O6], aragonite [CaCO3] and garronite [(Ca2.83Al5.66Si10.34O32(H2O)13.5] in zeolite family, and five starting material-related crystals including quartz, mullite, and hematite from FAF, and corundum and grossite (calcium dialuminate, CA2) from CAC. A particular attention was paid to the brownmillerite phase. Unlike OPC, this phase and any other calcium aluminoferrites were not detected by XRD in CAC as the starting material. Thus, we assumed that this brownmillerite was formed by interactions between CAC and hematite in FAF or the ferric oxide of the CS surface or both. If the CS-related ferric oxide was
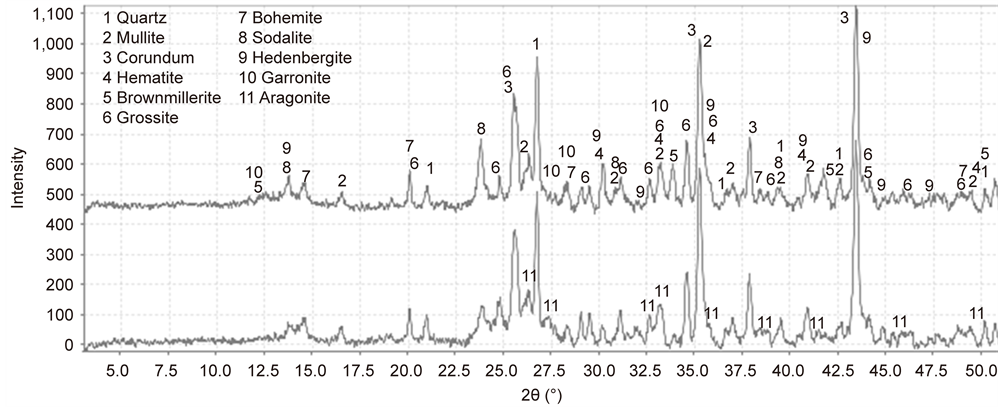
Figure 16. XRD results from 300˚C-autclaved 60/40 CAC/FAF ratio cements adhering to CS before (top) and after (bottom).
the counter-reactant to CAC, this cement had a potential for creating chemical bonds with CS. The other Fe-related reaction product was the hedenbergite phase. This phase was more likely to be formed by interactions between CAC and FAF, rather than the interfacial reaction product with CS. In fact, it was identified in bulk cement samples.
Figure 17 represents the composition of crystalline reaction products responsible for developing the adhesive force of the cement. As aforementioned in the FT-IR study, amorphous N-A-S-H and N,C-A-S-H phases as the precursors of the zeolite crystal also possibly can precipitate on CS. However, there was no experimental evidence whether these amorphous phases contribute to strengthening the adhesion of cement.
After the test (Figure 16 and Table 4), there were four differences in the phase composition from that of the untested sample: First, the brownmillerite phase was strikingly increased by 63%, thereby becoming the principal reaction product; second, the hematite-, sodalite-, and hedenbergite-phases markedly decreased by 20%, 39%, and 37%, respectively; third, carbonated sodalite as additional phase was incorporated in the cement; and fourth, more garronite and aragonite phases were deposited on CS. As for the first difference, since the additional brownmillerite was formed from two different ferric sources, hematite and the Fe-oxides of CS, we believe that the latter was major source for such a highly increased quantity of this phase. More importantly, such a stress environment promoted the formation of additional brownmillerite that was responsible for a self-advancing adherence of the cement to CS, thereby assuring bond integrity and durability. For the third- and fourth-ones, the carbonation of cement in this test environment led to the phase transformation of sodalite to carbonated sodalite, and also the precipitation of more aragonite. Subsequently, the post-tested cement adhering to CS was composed of 24.4% brownmillerite, 23.1% sodalite combined with carbonated sodalite, 15.7% aragonite, 14.0% hedenbergite, 11.4% garronite, and 11.4% boehmite (Figure 17).
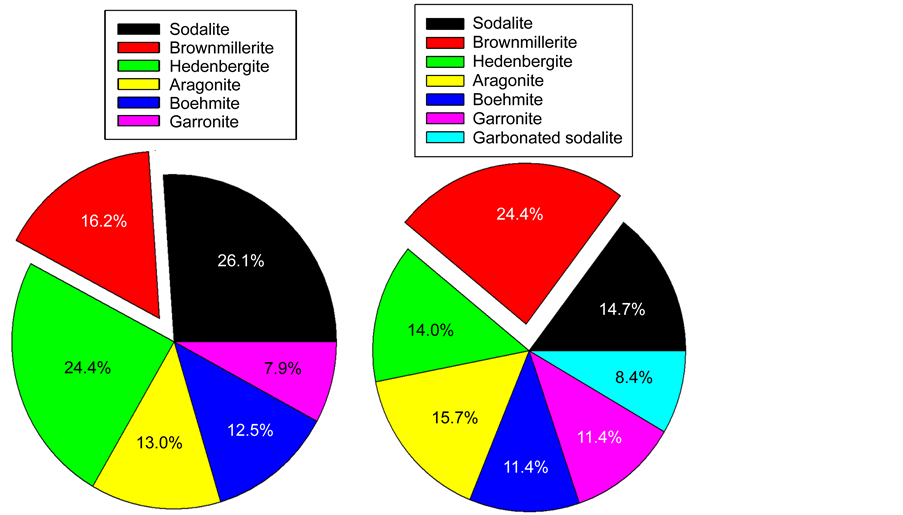
Figure 17. Phase compositions of crystalline reaction products formed in 60/40 ratio cement adhering to CS before (left) and after (right) the test.
Table 4. Phase compositions formed in 60/40 ratio cements adhering to CS before and after the test (semi-quantitative analyses).
Thus, there were four major contributors to a better performance of this cement in improving bond durability, compared with that of the other cements; among those were the brownmillerite as the major contributor aiding the chemical bonding of cement to CS, and sodalite, carbonated sodalite, and garronite promoting the attractive bonding of cement to the CS. As is mentioned in the FT-IR study, amorphous N-A-S-H and N,C-A-S-H gel phases as precursor of zeolite also formed in the cement; hence, these amorphous reaction products offer the likelihood of precipitating on CS by coexisting with these crystalline compounds. However, the quantity of these amorphous phases and their assignment to the improving adherent durability remain unknown.
Although these reaction products displayed a best performance in improving adhesive force and bond durability compared with that of all other cements, the shear bond strength and toughness of this CMF-reinforced cement layer was reduced by interfacial tensional stress. In other words, the reduction of such mechanical properties was dependent on the magnitude of cement’s stress- caused degradation, but was independent from its adherent behaviors; in fact, the adhesive force of the cement was stronger than that of the degraded cement itself, leading to the cohesive failure mode in the cement. Again, inevitably, one question remained unanswered: This is whether the value of decreased bond strength is enough to support adequate bond durability in a longservice life-span of cements in the wellbore. Nevertheless, the ranking of cements for improving bond durability is in the following order; 60/40 CAC/FAF ratio > CaP  G.
G.
4. Conclusions
Sodium metasilicate (SMS)-activated calcium aluminate cement (CAC)/fly ash F (FAF) blend was reinforced with carbon microfibers (CMFs) for the aims at improving its adhesive force and creating a tough interfacial bond structure at the blended cement/carbon steel (CS) joint in a hydrothermal environment at 300˚C. A 7-cycle 350˚C heat ® 25˚C water cooling-induced tensional stress test was employed for this joint sample to assess the durability of its bonds. For comparison, we used two reference geothermal well cements, conventional Class G (G) consisting of 70% G and 30% fine quartz, and calcium aluminate phosphate (CaP) made from the formula comprised in 47.2% CAC, 47.2% FAF, and 5.6% sodium hexametaphosphate (SHMP). Two different testing samples were prepared for evaluating the strength of the interfacial shear bonds. One was a cement sheath surrounding CS tube; the other was cement adhesive-bonding between CS plates. The results from these shear bond strengths were correlated directly with the adherent behaviors of cement to CS’s surface, the interfacial bond structures at critical boundary regions between the cement and CS, and the bond failure modes of cement at interfacial transition zones before and after tensional stress tests. Furthermore, the integrated data were used to identify the cement’s reaction products governing the enhancement of bond durability.
Based upon the approach described above to evaluate the bond durability of CMF-reinforced CAC/FAF blend cement adhering to CS under the heat-cooling cycle stress condition, the following descriptions can be drawn conclusively.
For CAC/FAF blended cement systems, the adherent behaviors of cement to CS’s surface depended on the CAC/FAF ratios; an increase in this ratio improved the adhesive force, verifying that CAC hydrate as the initial cementitious binder preferentially adhered to CS, rather than FAF hydrate as the secondary binder. Thus, in this cement system, the highest CAC/FAF ratio of 60/40 by weight was adopted for characterizing the interfacial bond structure responsible for strengthening the shear bond and enhancing its durability.
In the series of unreinforced cements, the 60/40 ratio cement displayed the highest sheath-and lap-shear bond strengths, respectively, of 3.6 MPa and 1.6 MPa; and the next highest strength was observed from CaP with 2.4 MPa and 0.9 MPa, while the bond strengths of G were considerably lower than that of 60/40 ratio and CaP, resulting in only 1.4 MPa and 0.3 MPa. When these cements were reinforced with CMF, it not only conferred an increase in the sheath- and lap- shear bond strengths on the cements, ranging from 14% to 36% and 23% to 74%, respectively, but also contributed to converting the brittle shearbond structure into a tough bond structure in response to a nearly 2 fold-prolonged tensile extension at the failure of the bond, compared with that of cements without CMF. The shearbond toughness was one of the important factors governing the improvement of bond durability and maintenance of bond integrity of cement under such a cyclic tensional stress condition. Nonetheless, the ranking of cements for improving bond durability was in the following order; 60/40 CAC/FAF ratio > CaP  G.
G.
For the 60/40 ratio, the phase composition of crystalline reaction products in cement adhering to CS before stress testing consisted of 26.1% sodalite [Na6Al6(SiO4)6], 24.4% hedenbergite [CaFeSi2O6], 16.2% brownmillerite [Ca2(Al, Fe3+)2O5], 13.0% aragonite [CaCO3], 12.5% boehmite [γ-AlO(OH)], and 7.9% garronite [(Ca2.83Al5.66Si10.34O32(H2O)13.5], responsible for best shearbond strength and bond toughness, compared with that of CaP and G. After the stress test, the surface chemical analyses including cement-related oxides distribution and Ca topographical mapping for the CS surfaces separated from cement layer after the lap-shear bond test revealed that more cements progressively adhered to CS. Interestingly, among the phases formed in adhered cement, brownmillerite was identified as the major phase, corresponding to its increased quantity of 24.4% from 16.2% before the test and the secondary increased phase was carbonate compounds related to aragonite and carbonated sodalite. Since brownmillerite was considered as the chemical interaction product between cement and CS, this phase provided two important roles in enhancing adherent performance of cement: One was the chemical bonding of cement to CS; the other was associated with the self-advancing adherence of cement during the stress test. On the other hand, the carbonated compounds also promoted the self-advancing adherence of cement, and their interfacial bond structures were categorized as an attractive bond. More importantly, such a stress environment led to the formation of additional brownmillerite and carbonated compounds, thereby assuring a better adherent performance and bond durability of cement than that of CaP and G. Additionally, the amorphous sodium aluminum silicate hydrate [Na2O-Al2O3- SiO2-H2O(N-A-S-H)] and sodium calcium aluminum silicate hydrate [Na2O, CaO-Al2O3-SiO2-H2O(N,C-A-S-H)] as reaction products also were formed in this cement. However, the roles of these amorphous products in improving adhesive force and bond durability remain unknown.
One important issue to be addressed was the fact that the shear bond strength and bond toughness were reduced under this stress condition. In this limited information, there is no experimental evidence on whether the reasons for such reductions are the mechanical- and physical-degradations of the cement by interfacial tensional stress, or carbonation-related phase transformation, or by the formation of additional brownmillerite, which was beneficial to self-advancing adherence of cement to CS, or all of them. Nevertheless, the reduction of such mechanical properties was dependent on the magnitude of cement’s stress- caused degradation, but was independent from its adherent behaviors; in fact, the adhesive force of cement was stronger than that of the degraded cement itself, leading to the cohesive failure mode in cement. Meanwhile, one inevitable question that must be asked was whether the value of declined bond strength was enough to sustain an adequate bond durability and integrity of cement in its long service life-span in a wellbore.
CaP cement exhibited similar adherent behaviors and interfacial bond structures to that of 60/40 ratio; namely, it encompassed two different bond structures: One was a chemical bond by the ferrowyllieite [Na2Fe2Al(PO4)3] phase as interfacial chemical reaction product between cement and CS; the other was an attractive bond from the apatite-, zeolite-, and carbonate-related reaction products. These phases essentially were responsible for providing adhesive force and bond toughness of cement. When this cement/CS joint sample was exposed in a heat-cooling stress environment, the cement adhering to CS yielded the additional ferrowyllieite, calcium hydrogen phosphate (CaHPO4), and aragonite (CaCO3) phases, promoting a self-advancing adherence of cement to CS, thereby extending the coverage of adhered cement over the CS. However, the efficacy of these phases in enhancing bond durability of cement was less than that of 60/40 ratio.
In contrast, no chemical reaction product with CS was founded in G cement adhering to CS. The adhered cement included the four crystalline phases, xonotlite [Ca6Si6O17(OH)2], 0.9 nm-tobermorite and -riversideite [Ca5Si6O16(OH)2], and calcite (CaCO3) as reaction products of cement. These reaction products had no significant effect on enhancing bond durability, compared with that of 60/40 ratio and CaP.
Acknowledgements
This work was issued by Geothermal Technologies Office (GTO) in DOE Energy Efficiency and Renewable Energy (EERE), and performed under the auspices of the US Department of Energy, Washington, DC, under Contract No. DE-AC02- 98CH 10886.
Cite this paper
Sugama, T. and Pyatina, T. (2017) Bond Durability of Carbon-Microfiber-Reinforced Alkali-Activated High-Temperature Cement Adhering to Carbon Steel. Engineering, 9, 142-170. https://doi.org/10.4236/eng.2017.92007
References
- 1. Amin, M.N., Kim, J.-S., Lee, Y. and Kim, J.-K. (2009) Simulation of the Thermal Stress in Mass Concrete Using a Thermal Stress Measuring Device. Cement and Concrete Research, 39, 154-164.
https://doi.org/10.1016/j.cemconres.2008.12.008 - 2. Teodoriu, C., Kosinowski, C., Amani, M., Schubert, J. and Shadravan, A. (2013) Wellbore Integrity and Cement Failure at HPHT Conditions. International Journal of Engineering and Applied Sciences, 2, 1-13.
- 3. Tang, Z., Zhou, Y. and Jia, J. (2013) Technology for Improving Life of Thermal Recovery Well Casing. Advances in Petroleum Exploration and Development, 5, 71-76.
- 4. Gill, S.K., Pyatina, T. and Sugama, T. (2012) Thermal Shock-Resistant Cement. Geothermal Resources Council Transactions, 36, 445-451.
- 5. Pyatina, T. and Sugama, T. (2014) Set Controlling Additive for Thermal-Shock-Resistant Cement. Geothermal Resources Council Transactions, 38, 251-257.
- 6. Fraay, A.L.A., Bijen, J.M. and de Haan, Y.M. (1989) The Reaction of Fly Ash in Concrete a Critical Examination. Cement and Concrete Research, 19, 235-246.
https://doi.org/10.1016/0008-8846(89)90088-4 - 7. Ben Haha, M., De Weerdt, K. and Lothenbach, B. (2010) Quantification of the Degree of Reaction of Fly Ash. Cement and Concrete Research, 40, 1620-1629.
https://doi.org/10.1016/j.cemconres.2010.07.004 - 8. Deschner, F., Winnefeld, F., Lothenbach, B., Seufert, S., Schwesig, P., Dittrich, S., Goetz-Neunhoeffer, F. and Neubauer, J. (2012) Hydration of Portland Cement with High Replacement by Siliceous Fly Ash. Cement and Concrete Research, 42, 1389-1400.
https://doi.org/10.1016/j.cemconres.2012.06.009 - 9. Pyatina, T. and Sugama, T. (2016) Resistance of Fly Ash-Portland Cement Blends to Thermal Shock. Advances in Cement Research, 28, 121-131.
https://doi.org/10.1680/adcr.15.00030 - 10. Sugama, T. and Pyatina, T. (2014) Toughness Improvement of Geothermal Well Cement at up to 300℃: Using Carbon Microfiber. Journal of Composite Materials, 4, 177-190.
- 11. Wicks, G.G., Lodding, A.R. and Molecke, M.A. (1993) Aqueous Alteration of Nuclear Waste Glasses and Metal Package Components. Material Research Bulletin, 18, 32-39.
https://doi.org/10.1557/S0883769400038008 - 12. Xyla, A.G. and Koutsoukos, P.G. (1989) Quantitative Analysis of Calcium Carbonate Polymorphs by Infrared Spectroscopy. Journal of the Chemical Society, Faraday Transactions 1, 85, 3165-3172.
https://doi.org/10.1039/f19898503165 - 13. Gunasekaran, S., Anbalagan, G. and Pandi, S. (2006) Raman and Infrared Spectra of Carbonate of Calcite Structure. Journal of Raman spectroscopy, 37, 892-899.
https://doi.org/10.1002/jrs.1518 - 14. Ylmen, R. and Jaglid, U. (2013) Carbonation of Portland Cement Studied by Diffuse Reflection Fourier Transform Infrared Spectroscopy. International Journal of Concrete Structures and Materials, 7, 119-125.
https://doi.org/10.1007/s40069-013-0039-y - 15. Ylmen, R., Jaglid, U., Steenari, B.-M. and Panas, I. (2009) Early Hydration and Setting of Portland Cement Monitored by IR, SEM and Vicas Techniques. Cement and Concrete Research, 39, 433-439.
https://doi.org/10.1016/j.cemconres.2009.01.017 - 16. García-Lodeiro, I., Palomo, A., Fernández-Jimenez, A. and Macphee, D.E. (2011) Compatibility Studies between N-A-S-H and C-A-S-H Gels. Study in the Ternary Diagram Na2O-CaO-Al2O3-SiO2-H2O. Cement and Concrete Research, 41, 923-931.
- 17. Mollah, M.Y.A., Yu, W., Schennach, R. and Cocke, D.L. (2000) A Fourier Transform Infrared Spectroscopic Investigation of the Early Hydration of Portland Cement and the Influence of Sodium Lignosulfonate. Cement and Concrete Research, 30, 267-273.
https://doi.org/10.1016/S0008-8846(99)00243-4 - 18. Taddei, P., Modena, E., Tinti, A., Siboni, F., Prati, C. and Gandolfi, M.G. (2014) Effect of the Fluoride Content on the Bioactivity of Calcium Silicate-Based Endodontic Cements. Ceramics International, 40, 4095-4107.
https://doi.org/10.1016/j.ceramint.2013.08.064 - 19. Saikia, B.J., Parthasarathy, G. and Sarmah, N.C. (2008) Fourier Transform Infrared Spectroscopic Estimation of Crystallinity in SiO2 Based Rocks. Bulletin of Material Science, 31, 775-779.
https://doi.org/10.1007/s12034-008-0123-0 - 20. Ramasamy, V. and Suresh, G. (2009) Mineral Characterization and Crystalline Nature of Quartz in Ponnaiyar River Sediments, Tamilnadu, India. American-Eurasian Journal of Science Research, 4, 103-107.
- 21. Guan, W., Zhuoyao, F.J., Dexin, F., Fang, D., Cheng, Y., Yan, P. and Chen, Q. (2014) Low Hydrothermal Temperature Synthesis of Porous Calcium Silicate Hydrate with Enhanced Reactivity SiO2. Ceramic International, 40, 4415-4420.
https://doi.org/10.1016/j.ceramint.2013.08.113 - 22. Low, K.L, Zein, S.H.S., Tan, S.H., McPhail, D.S. and Boccaccini, A.R. (2011) The Effect of Interfacial Bonding of Calcium Phosphate Cements Containing Bio-Mineralized Mulit-Walled Carbon Nanotube and Bovine Serum Albumin on the Mechanical Properties of Calcium Phosphate Cements. Ceramic International, 37, 2429-2435.
https://doi.org/10.1016/j.ceramint.2011.05.092 - 23. Nasiri-Tabrizi, B. and Fahami, A. (2013) Mechanochemical Synthesis and Structural Characterization of Nano-Sized Amorphous Tricalcium Phosphate. Ceramic International, 39, 8657-8666.
https://doi.org/10.1016/j.ceramint.2013.04.045 - 24. Taddei, P., Modena, E., Tinti, A., Siboni, F., Prati, C. and Gandofi, M.G. (2014) Effect of the Fluoride Content of the Bioactivity of Calcium Silicate-Based Endodontic Cements. Ceramic International, 40, 4095-4107.
https://doi.org/10.1016/j.ceramint.2013.08.064 - 25. Kolmas, J., Kaflak, A., Zima, A. and Slosarczyk, A. (2015) Alpha-Tricalcium Phosphate Synthesized by Two Different Routes: Structural and Spectroscopic Characterization. Ceramic International, 41, 5727-5733.
https://doi.org/10.1016/j.ceramint.2014.12.159 - 26. Roy, B.N. (1987) Spectroscopic Analysis of the Structure of Silicate Glasses along the Joint of xMAlO2-(1–x)SiO2 (M = Li, Na, K, Rb, Cs). Journal of the American Ceramic Society, 70, 183-192.
https://doi.org/10.1111/j.1151-2916.1987.tb04955.x - 27. Uchino, T., Sakka, T. and Iwasaki, M. (1991) Interpretation of Hydrated States of Sodium Silicate Glasses by Infrared and Raman Analysis. Journal of the American Ceramic Society, 74, 306-313.
https://doi.org/10.1111/j.1151-2916.1991.tb06880.x - 28. Kline, A.A. and Mullins, M.E. (1991) Sol-Gel Kinetics Followed by Cylindrical Attenuated Total Reflectance Infrared Spectroscopy. Journal of the American Ceramic Society, 74, 2559-2563.
https://doi.org/10.1111/j.1151-2916.1991.tb06799.x - 29. Sugama, T., Weber, L. and Brothers, L.E. (2000) Sodium-Polyphosphate-Modified fly Ash/Calcium Aluminate Blend Cement: Durability in Wet, Harsh Geothermal Environments. Materials Letters, 44, 45-53.
https://doi.org/10.1016/S0167-577X(00)00002-1 - 30. Palomo, A.A, Grutzeck, M.W. and Blanco, M.T. (1999) Alkali-Activated Fly Ashes: A Cement for the Future. Cement and Concrete Research, 29, 1323-1329.
- 31. García-Lodeiro, I., Palomo, A., Fernández-Jimenez, A. and Macphee, D.E. (2011) Compatibility Studies between N-A-S-H and C-A-S-H Gels. Study in the Ternary Diagram Na2O-CaO-Al2O3-SiO2-H2O. Cement and Concrete Research, 41, 923-931.
https://doi.org/10.1016/j.cemconres.2011.05.006 - 32. Bakharev, T. (2005) Resistance of Geopolymer Materials to Acid Attack. Cement and Concrete Research, 35, 658-670.
https://doi.org/10.1016/j.cemconres.2004.06.005 - 33. Davidovits, J. (1991) Geopolymers: Inorganic Polymeric New Materials. Journal of Thermal Analysis, 37, 1633-1656.
https://doi.org/10.1007/BF01912193 - 34. Komnitsas, K. and Zaharaki, D. (2007) Geopolymerization: A Review and Prospects for the Minerals Industry. Minerals Engineering, 20, 1261-1277.
https://doi.org/10.1016/j.mineng.2007.07.011 - 35. Neubauer, J., Sieber, R., Kuzel, H.-J. and Ecker, M. (1996) Investigation on Introducing Si and Mg into Brownmillerite—A Rietveld Refinement. Cement and Concrete Research, 26, 77-82.
https://doi.org/10.1016/0008-8846(95)00178-6 - 36. Landa-Canovas, A.R. and Hansen, S. (1999) Transmission Electron Microscopic Study of Ferrite in Sulfate-Resisting Portland Cement Clinker. Cement and Concrete Research, 29, 679-686.
https://doi.org/10.1016/S0008-8846(99)00031-9 - 37. Ectors, D., Neubauer, J. and Goetz-Neunhoeffer, F. (2013) The Hydration of Synthetic Brownmillerite in Presence of Low Ca-Sulfate Content and Calcite Monitored by Quantitative in-Situ-XRD and Heat Flow Calorimetry. Cement and Concrete Research, 54, 61-68.
https://doi.org/10.1016/j.cemconres.2013.08.011 - 38. Touzo, B., Scrivener, K.L. and Glasser, F.P. (2013) Phase Compositions and Equilibria in the CaO-Al2O3Fe2O3-SO3 System, for Assemblages Containing Ye’elimite and Ferrite Ca2(Al,Fe)O5. Cement and Concrete Research, 54, 77-86.
https://doi.org/10.1016/j.cemconres.2013.08.005 - 39. Sugama, T., Brother, L.E. and Weber, L. (2002) Calcium Aluminate Cements in Fly Ash/Calcium Aluminate Blend Phosphate Cement Systems: Their Role in Inhibiting Carbonation and Acid Corrosion at a Low Hydrothermal Temperature. Journal of Materials Science, 37, 3163-3173.
https://doi.org/10.1023/A:1016158328024 - 40. Reardon, E.J. (1990) An Ion Interaction Model for the Determination of Chemical Equilibria in Cement/Water Systems. Cement and Concrete Research, 20, 175-192.
https://doi.org/10.1016/0008-8846(90)90070-E - 41. Nagai, M., Saeki, T. and Nishino, T. (1990) Carbon Dioxide Sensor Mechanism of Porous Hydroxyapatite Ceramics. Journal of the American Ceramic Society, 73, 1456-1460.
https://doi.org/10.1111/j.1151-2916.1990.tb05228.x - 42. El Feki, H., Savariault, J.M. and Ben Salah, A. (1999) Structure Refinements by the Rietveld Metod of Partially Substituted Hydroxyapatite: Ca9Na0.5(PO4)4.5(CO3)1.5(OH)2. Journal of Alloys and Compounds, 287, 114-120.
https://doi.org/10.1016/S0925-8388(99)00070-5 - 43. Feki, H.E., Savariault, J.M. and Salah, A.B. (2000) Sodium and Carbonate Distribution in Substituted Calcium Hydroxyapatite. Solid State Sciences, 2, 577-586.
https://doi.org/10.1016/S1293-2558(00)01059-1 - 44. Suchanek, W.L., Shuk, P., Byrappa, K., Riman, R.E., TenHuisen, K.S. and Janas, V.F. (2002) Mechanochemical-Hydrothermal Synthesis of Carbonated Apatite Powders at Room Temperature. Biomaterials, 23, 699-710.
https://doi.org/10.1016/S0142-9612(01)00158-2 - 45. Losarczyk, A.S., Paszkiewiez, Z. and Zima, A. (2010) The Effect of Phosphate Source on the Sintering of Carbonate Substituted Hydroxyapatite. Ceramic International, 36, 577-582.
https://doi.org/10.1016/j.ceramint.2009.09.032