Engineering
Vol. 4 No. 9 (2012) , Article ID: 23222 , 4 pages DOI:10.4236/eng.2012.49068
Simulation-Based Analysis and Intuitive Visualization of the Cutting Edge Load in Micromilling of Hardened Steel
Institute of Machining Technology, Dortmund, Germany
Email: *pkersting@isf.de
Received June 20, 2012; revised July 18, 2012; accepted July 28, 2012
Keywords: Simulation; Visualization; Micromilling; Tool Wear
ABSTRACT
The precise micromanufacturing of complex dies with small structures for sheet-bulk metal forming is a challenge due to the high hardness of the materials to be machined. Experiments have shown that micromilling of these difficult-to-machine materials is possible despite of their high hardness. Nevertheless, the higher wear of the tools plays a decisive role. When implementing the machining task as five-axis process, it is possible to control the wear distribution by tilting the milling tools. In this paper, a simulation system is presented which determines the loads acting on the cutting edge with regard to different criteria, e.g., the machined material or the effective impulse. Based on this knowledge, it is possible to design the milling process to minimize the tool wear and thereby to increase the lifetime of the milling tools. In order to show the applicability of the simulation system, test workpieces were machined and the experimental results are compared to the simulation data.
1. Introduction
Workpieces with microstructured elements (Figure 1) [1, 2] are usually manufactured by die sinking, pulsed laser deposition, or micromilling [3-7]. The advantages of micromilling [8,9] are a higher geometric flexibility, a higher material removal rate, and a higher quality of the machined surfaces [10-12]. However, tool wear [13] and the risk of tool failure is an important factor [14].
Especially in case of sheet-bulk metal forming [15], which combines the advantages of sheet and bulk metal forming in order to manufacture complex lightweight components with integrated functional elements, wearresistant forming tools made of hardened steel and highspeed steel are required. Due to the high hardness of the materials, the machining of these components is a challenge [16]. In previous studies, the applicability of commercially available micro end-milling cutters for a manufacturing of dies from hardened tool steel with a hardness above 60 HRC was presented [17].
The analysis of tool wear—using the Finite Element Analysis (FEA) [18,19] or different empirical or analytical models [20,21]—and the monitoring during the machining process [22] are subject of many research works. During the machining of materials with a high hardness, the abrasive tool wear plays a decisive role which is substantially influenced by the distance travelled by the milling tool in the workpiece material. Therefore, the analysis system presented in the following does not use a complex wear model [21,23] or apply a time-consuming FE model. In contrast, it predicts indicator values of the load on the cutting edge which causes the tool wear— like for example the covered distance, removed material volume, or the impulse acting on the cutting edge. These values are stored during the simulation of the machining process, and the data is prepared in an intuitive visualization [24] in order to allow for an easy visual perception. This knowledge can then be utilized by the NC (Numerical Control) software engineer to optimize the parameter values of the manufacturing process.
2. Simulation System for Analyzing the Load on the Cutting Edge
The approach for analyzing the load on the cutting edge during the NC milling process is integrated into a geometric time-domain milling simulation. This approach computes the material removal and the cutting forces on the basis of a geometric description of the milling tool (e.g., shape (sphere, torus, cylinder), radius, helix angle) as well as the raw stock material (Figure 2) and real NC programs, which include all the required information, e.g., about the position and orientation of the milling tool, the feedrate, and the spindle speed [25,26].
This simulation system [27] is based on the Constructive
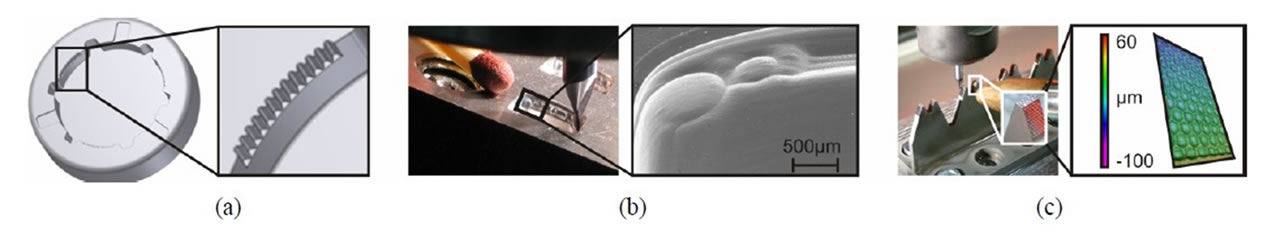
Figure 1. Micromachined workpieces. (a) Forming die (Source: SFB/TR 73); (b) Five-axis machining of a mold using a tool with a diameter of 0.5 mm [1]; (c) Microstructured workpiece surface [2].
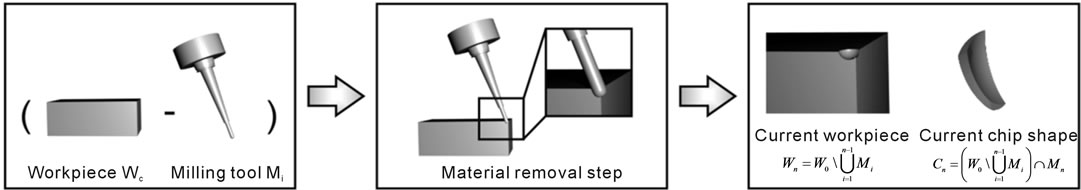
Figure 2. Geometric time-domain milling simulation based on the CSG technique [26].
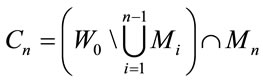
Solid Geometry (CSG) technique [28], which allows an accurate modeling of the current chip shape Cn of the nth cut by combining basic solid objects by Boolean operations [12]:
 , (1)
, (1)
where Mi is the envelope of the tool model and W0 the raw stock material (Figure 2).
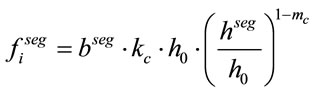
In order to describe the load on the milling tool, the cutting edge is subdivided into smaller segments (Figure 3) and the constructed chip shape is analyzed [29]. One of the main analysis criteria are the forces fiseg (i = n, c, or t)—the normal, cutting, and tangential force fn, fc, ft— acting on the corresponding sections of the cutting edge. These forces are computed using the equation of Kienzle [30]:
 , (2)
, (2)
where bseg is the width and hseg the thickness of the undeformed chip.
At each point in time t, the undeformed chip thickness h(t) is determined by intersecting the chip shape with rays cast from the TCP (tool center point) through various points along the cutting edge (Figure 4). The distances between the entry and the exit points of the rays are the undeformed chip thicknesses at the segments of the cutting edge (Figure 4(b)).
Based on the computed thickness and width of the chip, different criteria for the loads can be taken into account. In addition to the common criteria like the accumulated and the maximum cutting forces ([N]), the impulse ([NS]) acting on the cutting edges can be determined. Additionally, the removed material volume ([mm3]), the time ([s]), and the distances ([mm]) of the cutting edge covered in the material can be computed by analyzing the constructed chip shape. In the following, the machining of test workpieces is analyzed based on these criteria and their applicability will be discussed by comparing the simulation with the experimental results.
3. Analyzing the Machining of a Test Workpiece
In order to demonstrate the idea of this analysis tool, the machining of a simple test workpiece is discussed in the following. The test workpiece with a blank dimension of 30 mm × 40 mm is presented in Figure 5. The workpiece consists of a slanted and a rounded side. This geometry was chosen since the milling tool is always engaged with the same part of the cutting edges in a three-axis milling process of the slanted side (Figure 6). In case of the machining of the rounded side, all parts of the cutting edges are in engagement. Thus, it is expected that the load on the cutting edge during the machining of the slanted side is only local and, thereby, the tool wear resulting from this load will only appear in the corresponding sections. In contrast, it is assumed that the load during the milling of the rounded side will be distributed along the cutting edge and will be locally smaller than in case of the machining of the slanted side.

Figure 3. Subdivision of the cutting edge into smaller sections. (a) Schematic view [29]; (b) Subdivision of a real cutting edge into 50 segments.
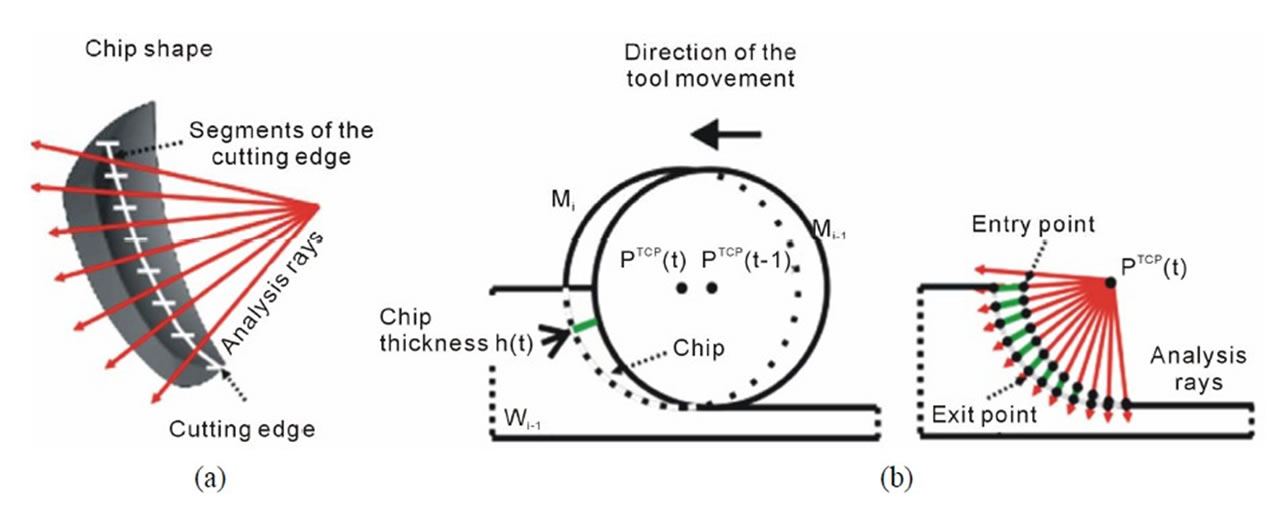
Figure 4. (a) Geometric model of the chip shape; (b) Computation the chip thickness by intersecting the chip shape with rays.
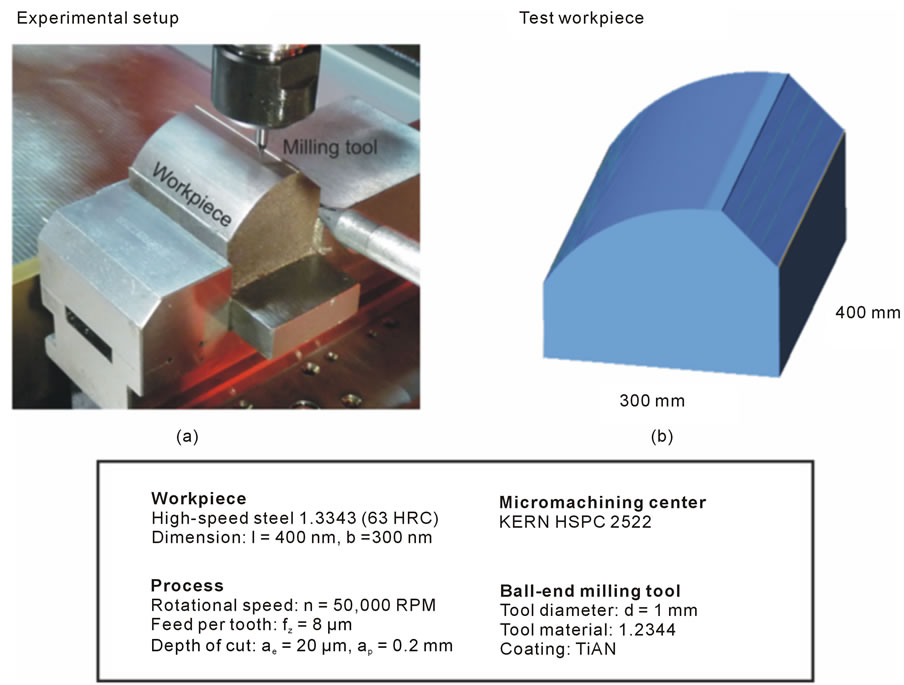
Figure 5. (a) Experimental setup; (b) Geometry of the test workpiece.
In this study, the high-speed steel (1.3343) with a high hardness of 63 HRC is machined on a micromachining center, KERN HSPC 2522 (Figure 5). The used ball-end milling tool had a tool diameter of d = 1 mm and the experiments were carried out with minimal quantity lubrication, a feed per tooth of fz = 8 µm, a spindle speed of n = 50,000 RPM, and depths of cut of ae = 20 µm and ap = 0.2 mm.
3.1. Machining of the Slanted Side
Results of the conducted experiments and of the simulation runs are shown in Figure 6. In Figure 6(a), a scanning electron microscope image of the milling tool, which was used in the experiments, is presented. The tool wear is clearly visible in two areas, which are marked with A and B. As mentioned above, there are always the same parts of the cutting edge in engagement during the machining of the slanted side. This results in a high load of the cutting edge in area A. However, the tool wear in area B cannot be explained in that way because this part of the cutting edge is only in engagement for a short time at the end of the process.
In Figure 6(b), the cumulative removed workpiece volume is depicted over the process time and the number of cutting edge segments (Figure 3). It is clearly visible that the same area of the cutting edge (number 20 up to number 30) is in engagement. It is also visible that the cutting edge segments (number < 20) are in engagement only during the end of the process (from NC path position 2000). However, the data presented in Figure 6(b) and the depiction of the cumulative distance (Figure 6(c)) do not explain the tool wear in area B.
In comparison, the analysis of the effective impulse on the cutting edge in Figure 6(d) illustrates the cause of

Figure 6. Results of the machining of the slanted side. (a) Scanning electron microscope image of the milling tool; (b) Load on the cutting edge segments determined during the simulation. The sum of the removed workpiece volume is depicted over time (NC path positions) and the number of cutting edge segments; (c) Cumulative distance; (d) Cumulative impulse.
the tool wear in area B. Although the removed material volume is relatively low (compare Figure 6(b)), the effective impulse on the cutting edge segments (number < 12) leading to a chipping of the coating is not negligible. This example shows the benefit of considering different criteria during the milling process.
3.2. Machining of the Rounded Side
In Figure 7, the results of the machining of the rounded side are presented. A comparison of the scanning electron microscope images (Figures 6(a) and 7(a)) shows the results of different loads on the cutting edge for the different machining processes. Whereas the tool wear is only local after the machining of the slanted side (Figure 6(a)), the whole cutting edge is worn out after the machining of the rounded side since the whole cutting edge was in engagement during the machining. This effect is also visible in the simulation results shown in Figure 7(b). In contrast to Figure 6(b), all parts of the cutting edge were in engagement during the material removal process.
3.3. Intuitive Visualization
In Figure 8, another kind of visualization is shown. The different criteria are directly rendered onto the model of the milling tool, so the user has an intuitive visualization of the distribution of the load along the cutting edge.
In Figures 8(a) and (b) the cumulative removed workpiece volume and the effective impulse during the machining of the slanted side are depicted directly on the cutting edge segments respectively.
The high load on the parts of the cutting edge between segment 20 and 30 is presented in a way that can be intuitively understood. Compared to Figures 8(c) and (d), the difference between the two machining processes with regard to the tool load can be easily determined. The cutting edge in Figure 8(c) shows a uniform distribution of tool wear along the cutting edge.
4. Example: Machining of an Impeller
In order to show the applicability of the presented approach on a more complex machining process, the fiveaxis milling of an impeller (Figure 9) is discussed in the following. For this example, only simulation results of the machining of the impeller are presented. The simulated part of the NC path is depicted in Figure 9(b). The simulated cumulative and maximum impulse values of the corresponding machining process are visualized in
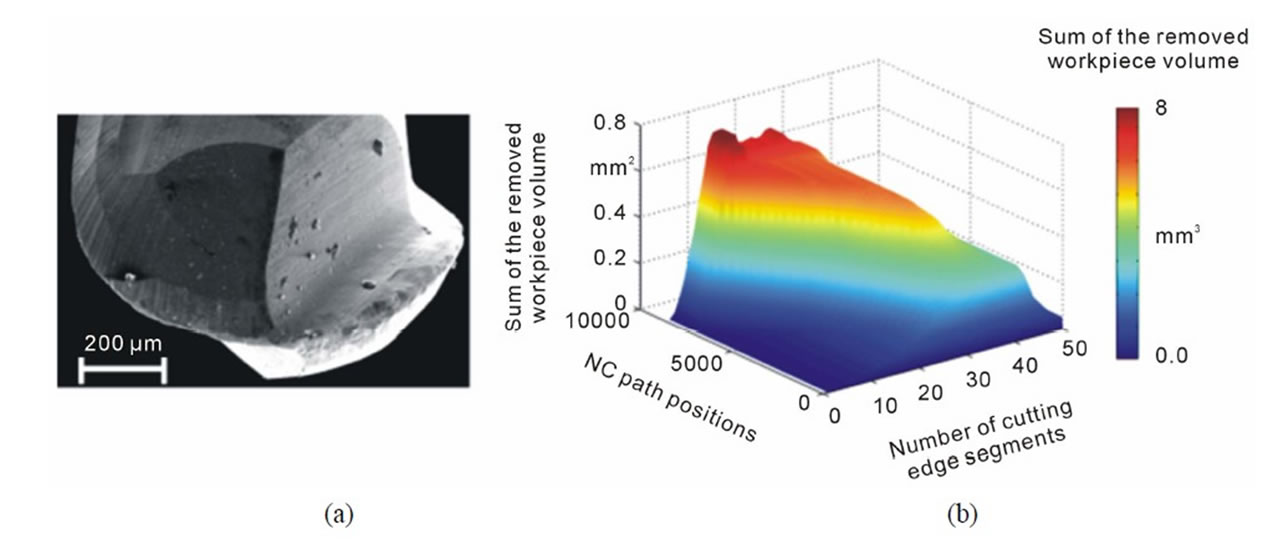
Figure 7. Results of the machining of the rounded side. (a) Scanning electron microscope image of the milling tool; (b) Timedependent load on the cutting edge segments defined by the sum of the removed workpiece volume.
 (a)
(a)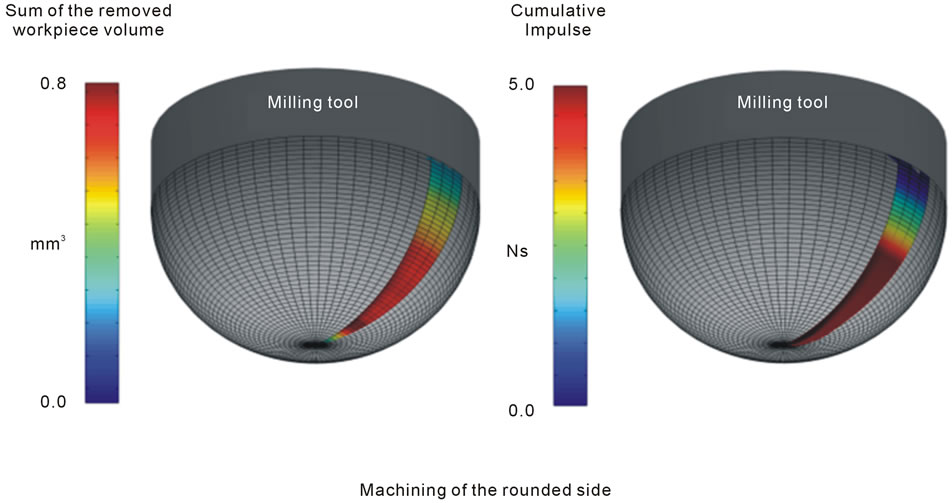 (b)
(b)
Figure 8. Simulation results. (a) The removed workpiece volume of the machining of the slanted side is depicted directly on the cutting edges of the workpiece. Visualization of the (b) effective impulse; (c) summed volume and (d) the cumulative impulse.
Figure 10. It is clearly visible that always the same area of the cutting edge (number < 20) is in engagement. Particularly in case of milling difficult-to-machine materials, the milling tool will show an increased tool wear in this more stressed cutting edge areas.
The results of the machining of the test workpiece (cf. Figure 6) advise, for example, to avoid these high impulses (Figure 10(b)) on the cutting edge. Using this knowledge, the NC programmer is able to optimize the NC paths by tilting the milling tool in order to distribute the load uniformly over the cutting edge by choosing appropriate machining parameters (Figure 11). Analogously to the visualization of the results of the simple test workpiece, the data (removed workpiece material, cumulative impulse, and maximum impulse) resulting from the simulation of the optimized machining is presented in Figure 11. The visualization of the maximum occurring impulse shows a relatively uniform distribution along the cutting edge of the milling tool (cf. Figure 10(b)). This can significantly increase the lifetime of the milling tool.
Only in the cutting edge area at the tool tip, the maximum and the cumulative impulses are zero. The reason for this is shown in the visualization of the removed workpiece volume. Due to the tilting of the milling tool, the tool tip is not in engagement so that no material is removed (Figure 11(c)). Thereby no force is acting on this cutting edge area.
5. Conclusions
During the machining especially of hardened material, tool wear plays a decisive role because it decreases the lifetime of the milling tools and leads to a low quality of the resulting workpiece surfaces. When conducting the machining as five-axis process, the production engineer is able to influence the wear behavior by tilting the milling
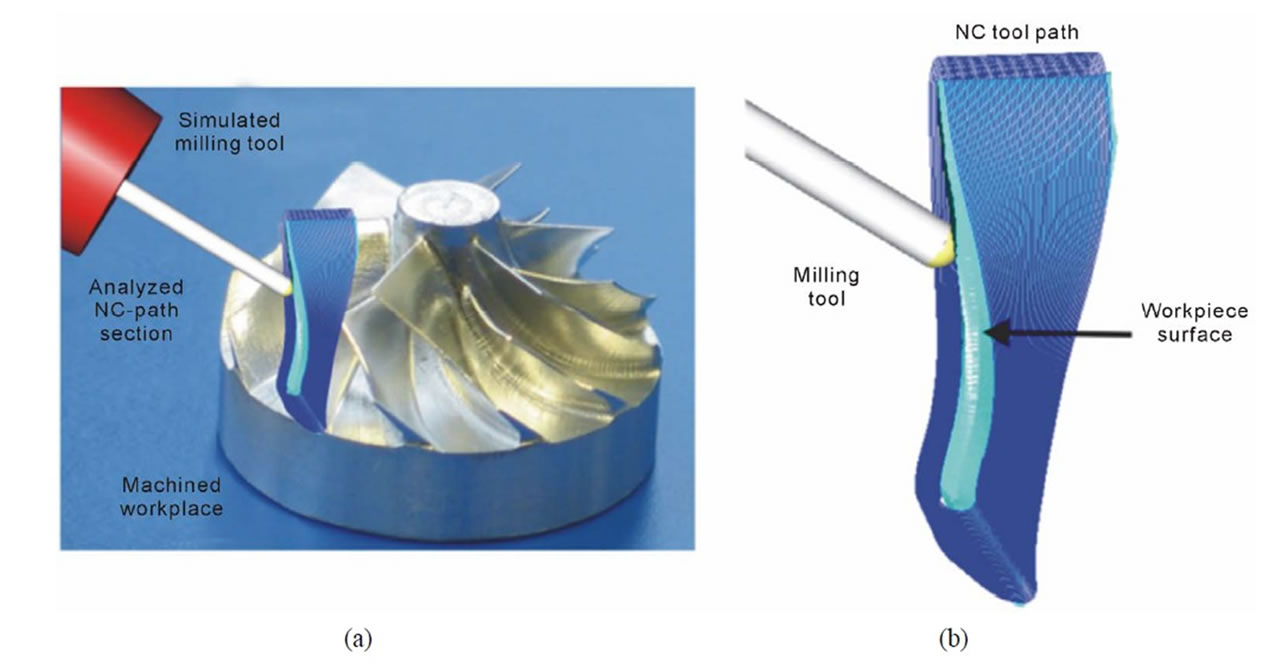
Figure 9. Milling of an impeller. (a) The analyzed part of the NC path is visualized on the real machined workpiece; (b) NC path of one blade in the simulation system.
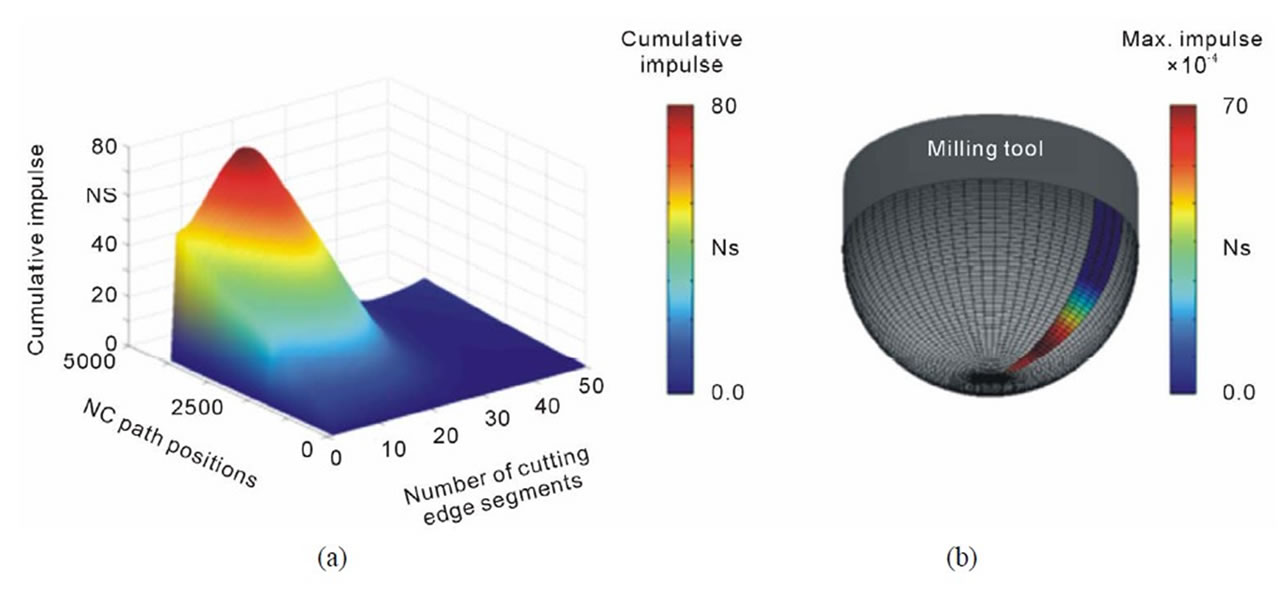
Figure 10. Machining of an impeller. (a) Visualization of the cumulative and (b) Maximum impulse.
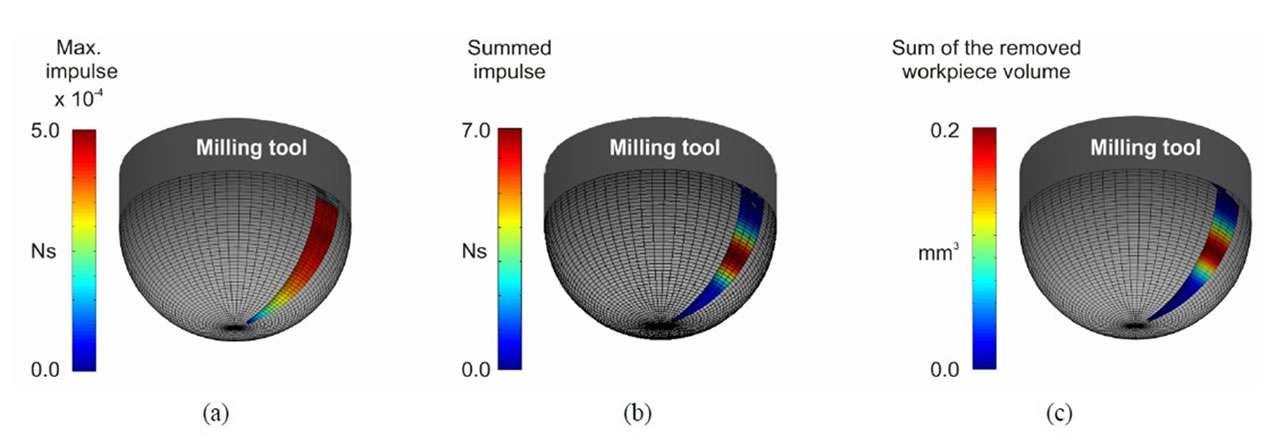
Figure 11. Data resulting from the simulation run. (a) Maximum impulse; (b) Cumulative impulse; (c) Summed removed workpiece volume.
tools. In this paper, a simulation system was presented which gives the production engineer the opportunity to depict the loads on the cutting edge by an intuitive visualization of the important criteria. Based on this knowledge, the production engineer is able to decide whether to use the analyzed NC programs or to revise the NC paths by tilting the milling tool in order to distribute the tool wear along the cutting edge and thereby to increase the lifetime of the milling tools and to increase the quality of the workpiece surface.
The idea of this approach—to directly visualize the distribution of the cutting edge load along the cutting edge—was shown by analyzing a simple test workpiece with a slanted and a rounded side. Using the simulated results, the wear behavior of the milling tools after conducting the real machining process could be explained. Afterwards, the simulation of a complex workpiece machined in a five-axis process and the optimization potential were presented. In future works, the simulation system will be improved in order to optimize the milling process in a semi-automatic way.
6. Acknowledgements
This article is based on additional investigations of the research project B2 Machining of molds with filigree structures for sheet-bulk metal forming, which is kindly funded by the German Research Foundation (DFG) within the SFB/TR 73.
REFERENCES
- D. Biermann and P. Kahnis, “Mikrofräsen Filigraner Strukturen in Formeinsätzen,” MM Maschinenmarkt, Vol. 5, No. 2, 2010, pp. 36-40.
- P. Sieczkarek, L. Kwiatkowski, E. Tekkaya, E. Krebs, D. Biermann, W. Tillmann and J. Herper, “Improved Tool Surfaces for Incremental Bulk Forming Processes of Sheet Metals,” Proceedings of the ESAFORM Conference, 2012.
- K. P. Rajurkar, G. Levy, A. Malshe, M. M. Sundaram, J. McGeough, X. Hu, R. Resnick and A. DeSilva, “Micro and Nano Machining by Electro-Physical and Chemical Processes,” Annals of the CIRP, Vol. 55, No. 2, 2006, pp. 643-666. doi:10.1016/j.cirp.2006.10.002
- X. Li, J. Wang and W. Li, “Current State and Prospect of Micro-Machining,” Proceedings of the 2007 IEEE International Conference on Automation and Logistics, Qinhuangdao, 18-21 August 2007, pp. 1414-1419.
- P. Kahnis and K. Weinert, “Analysis of Tool Influences on High-Precision-Micromilling of Steel Workpieces,” Proceedings of the 6th Euspen International Conference, Baden bei Wien, May 2006, pp. 128-132.
- D. Biermann and P. Kahnis, “Analysis and Simulation of Size Effects in Micromilling,” Production Engineering. Research and Development, Vol. 4, No. 1, 2010, pp. 25- 34. doi:10.1007/s11740-009-0201-1
- D. Biermann, E. Krebs and J. Schlenker, “Micromilling of Bionic Structures,” Proceedings ASPE 2011 Spring Topical Meeting—Structured and Freeform Surfaces, Charlotte, 3 June-3 August 2011, pp. 120-125.
- D. Dornfeld, S. Min and Y. Takeuchi, “Recent Advances in Mechanical Micromachining,” Annals of the CIRP, Vol. 55, No. 2, 2006, pp. 745-768. doi:10.1016/j.cirp.2006.10.006
- F. Vollertsen, D. Biermann, H. N. Hansen, I. S. Jawahir and K. Kuzman, “Size Effects in Manufacturing of Metallic Components,” Annals of the CIRP, Vol. 58, No. 2, 2009, pp. 566-587. doi:10.1016/j.cirp.2009.09.002
- G. Bissacco, H. N. Hansen and L. De Chiffre L, “Size Effects on Surface Generation in Micro Milling of Hardened Tool Steel,” Annals of the CIRP, Vol. 55, No. 1, 2006, pp. 593-596.
- D. Biermann, P. Kahnis and T. Surmann, “Analysis and Simulation of Cutting Forces in Downscaled Milling Processes,” Proceedings of the 10th CIRP International Workshop on Modeling of Machining Operations, Reggio Calabria, 27-28 August 2007. doi:10.1016/j.cirp.2010.03.057
- D. Biermann, P. Kersting and T. Surmann, “A General Approach to Simulating Workpiece Vibrations during Five-Axis Milling of Turbine Blades,” Annals of the CIRP, Vol. 59, No. 1, 2010, pp. 125-128.
- V. P. Astakhov and P. J. Davim, “Tools (Geometry and Material) and Tool Wear,” In: P. J. Davim, Ed., Machining: Fundamentals and Recent Advances, Springer, London, 2008, pp. 29-58.
- S. Melkote, M. Kumar, F. Hashimoto and G. Lahoti, “Laser Assisted Micro-Milling of Hard-to-Machine Materials,” Annals of the CIRP, Vol. 58, No. 1, 2009, pp. 45-48. doi:10.1016/j.cirp.2009.03.053
- M. Merklein, E. Tekkaya, A. Brosius, S. Opel and J. Koch, “Overview on Sheet-Bulk Metal Forming Processes,” Proceedings of the International Conference on Technology of Plasticity, 2011, pp. 1109-1114.
- H. K. Tönshoff, C. Arendt and R. Ben Amor, “Cutting of Hardened Steel,” Annals of the CIRP, Vol. 49, No. 2, 2000, pp. 547-566. doi:10.1016/S0007-8506(07)63455-6
- D. Biermann, A. Baschin, E. Krebs and J. Schlenker, “Manufacturing of Dies from Hardened Tool Steels by 3-Axis Micromilling,” Production Engineering Research and Development, Vol. 5, No. 2, 2011, pp. 209-217. doi:10.1007/s11740-010-0293-7
- A. Attanasio, E. Ceretti, S. Rizzuti, D. Umbrello and F. Micari, “3D Finite Element Analysis of Tool Wear in Machining,” Annals of the CIRP, Vol. 57, No. 1, 2008, pp. 61-64. doi:10.1016/j.cirp.2008.03.123
- H. Ding, N. Shen and Y. C. Shin, “Experimental and Modeling Analysis of Micro-Milling of Hardened H13 Tool Steel,” Proceedings of the ASME 2011 International Manufacturing Science and Engineering Conference, Corvallis, 13-17 June 2011, pp. 373-386.
- H. Li, X. Lai, C. Li, J. Feng and J. Ni, “Modelling and Experimental Analysis of the Effects of Tool Wear, Minimum Chip Thickness and Micro Tool Geometry on the Surface Roughness in Micro-End-Milling,” Journal of Micromechanics and Microengineering, Vol. 18, No. 2, 2008, Article ID: 025006. doi:10.1088/0960-1317/18/2/025006
- A. Zabel and J. Rautenberg, “Simulation Based Prediction of Tool Wear in Milling,” Proceedings of the 2nd Manufacturing Engineering Society International Conference, Madrid, 7 September-7 November 2007.
- C. Xu, T. Xu, Q. Zhu and H. Zhang, “Study of Adaptive Model Parameter Estimation for Milling Tool Wear,” Journal of Mechanical Engineering, Vol. 57, No. 7-8, 2011, pp. 568-578.
- V. P. Astakhov, “The Assessment of Cutting Tool Wear,” International Journal of Machine Tools and Manufacture, Vol. 44, No. 6, 2004, pp. 637-647. doi:10.1016/j.ijmachtools.2003.11.006
- H. Müller, D. Biermann, P. Kersting, T. Michelitsch, C. Begau, C. Heuel, R. Joliet, J. Kolanski, M. Kröller, C. Moritz, D. Niggemann, M. Stöber, T. Stönner, J. Varwig and D. Zhai, “Intuitive Visualization and Interactive Analysis of Pareto Sets Applied on Production Engineering,” In: A. Yang, Y. Shan and L. Bui, Eds., Success in Evolutionary Computation, Springer, Berlin/Heidelberg, 2008, pp. 189-214.
- P. Kersting and A. Zabel, “Optimizing NC-Tool Paths for Simultaneous Five-Axis Milling Based on Multi-Population Multi-Objective Evolutionary Algorithms,” Advances in Engineering Software, Vol. 40, No. 6, 2009, pp. 452- 463. doi:10.1016/j.advengsoft.2008.04.013
- P. Kersting and D. Biermann, “Simulation Concept for Predicting Workpiece Vibrations in Five-Axis Milling,” Machining Science and Technology, Vol. 13, No. 2, 2009, pp. 196-209. doi:10.1080/10910340903005039
- T. Surmann and D. Enk, “Simulation of Milling Tool Vibration Trajectories along Changing Engagement Conditions,” International Journal of Machine Tools and Manufacture, Vol. 47, No. 9, 2007, pp. 1442-1448. doi:10.1016/j.ijmachtools.2006.09.030
- J. D. Foley, A. Van Dam, S. K. Feiner and J. F. Hughes, “Computer Graphics, Principles and Practice,” AddisonWesley Professional, 1995.
- K. Weinert and T. Surmann, “Geometric Simulation of the Milling Process for Free Formed Surfaces,” In: Simulation Aided Offline Process Design and Optimization in Manufacturing Sculptured Surfaces, 2003, pp. 21-30.
- O. Kienzle, “Die Bestimmung von Kräften und Leistungen an Spanenden Werkzeugen und Werkzeugmaschinen,” VDI-Z, Vol. 94, No. 11, 1952, pp. 299-305.
NOTES
*Corresponding author.