Materials Sciences and Applications
Vol.4 No.10(2013), Article ID:37639,6 pages DOI:10.4236/msa.2013.410074
Comparison between Microwave Infrared Thermography and CO2 Laser Infrared Thermography in Defect Detection in Applications with CFRP
![]()
1Laboratory of Civil Engineering and GeoEnvironment, PRES Lille Nord of France, Lille, France; 2Faculty of Applied Sciences, Béthune, France; 3University Institute of Technology of Bethune, Béthune, France.
Email: anggci@yahoo.com, sang.keo@univ-artois.fr
Copyright © 2013 Sam-Ang Keo et al. This is an open access article distributed under the Creative Commons Attribution License, which permits unrestricted use, distribution, and reproduction in any medium, provided the original work is properly cited.
Received July 24th, 2013; revised August 26th, 2013; accepted September 14th, 2013
Keywords: CFRP; Defect; Microwave; CO2 Laser; Infrared Thermography
ABSTRACT
This paper presents two infrared thermography methods with CO2 Laser excitation and microwave excitation applied to defect detection in CFRP. The tests were conducted with two specimens, one with defect, and another one without defect. On two concrete plates 40 cm × 40 cm × 4.5 cm were reinforced by CFRP; the defects were made by the absence of adhesive on an area 10 cm × 10 cm. The specimens were heated by microwave, generated by a commercial magnetron of 2.45 GHz and guided by a pyramidal horn antenna, with a power of 360 W within 150 s. Another series of the tests was conducted with CO2 Laser, wavelength 10.6 µm, by heating the samples with a power of 300 W within 40 s. An infrared camera sensitive to medium waves in range of 3 - 5 μm, with a detector of 320 × 256 matrix detector in InSb (Indium Antimonide), was used to record the thermograms. As a result, the CO2 Laser excitation is better for the delamination detection in CFRP. This study opens interesting perspectives for inspecting other types of defects in materials sciences; the microwave excitation is suitable for the deep defects in the materials whereas the CO2 Laser excitation is better for the defects near the surface of the materials.
1. Introduction
Composite materials have attracted a lot of attention from researchers in materials sciences. The applications with these materials have also been increasing. Carbon Fiber Reinforced Polymer (CFRP) has been popularly used in repairing and strengthening the structures in civil engineering [1-4]. In these techniques, the loss of the adhesives can cause the delamination of the CFRP from the repaired or strengthened elements [5]. This type of defects has been inspected by various infrared thermography methods [6-8]. The infrared thermography is a thermal method used as nondestructive testing technique (NDT) based on the measurement of the temperature difference on the surface of the materials [9,10]. The data interpretation methods have been developed [9,11-14]. Meanwhile, many excitation systems such as microwaves and laser have also been created to stimulate the detected structures [15-18].
In this work, two infrared thermography methods with a Laser excitation system and a microwave excitation system are applied to defect detection in CFRP. The Laser used for this method is CO2 Laser, more powerful than other types, which is the interest of surface heating source for infrared thermography. The interest of the microwave excitation system is the direct transmission of the waves onto the detected elements by a pyramidal horn antenna, which is accessible to the in situ inspection of the structures in civil engineering. The thermograms from the analysis with the contrast algorithm and the temperature evolution of the surface of the specimen for both methods are then compared.
2. CFRP Samples
Two samples of the same dimensions were prepared, one without defect, and another one with defect (Figure 1). On a small concrete slab 40 cm × 40 cm, and 4.5 cm of thickness, was reinforced by the carbon fiber reinforced polymer (CFRP) 22 cm × 40 cm. The CFRP consisted of
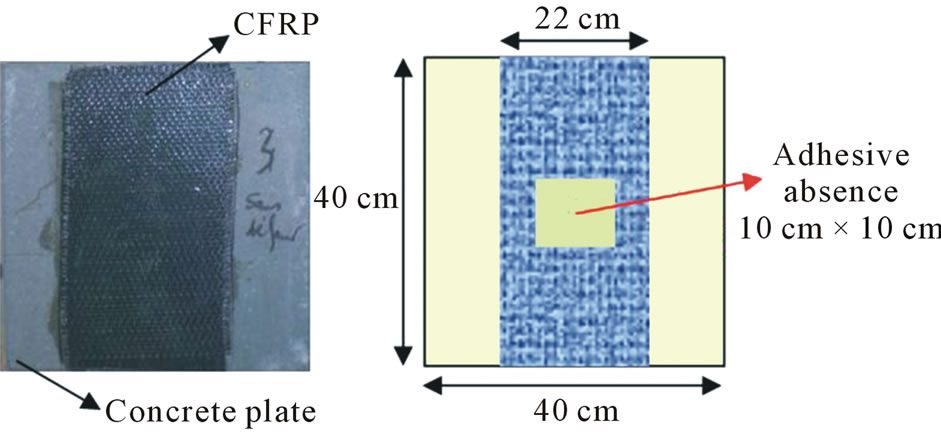
Figure 1. Details of the CFRP samples.
the bidirectional carbon fiber tissue, and the Sikadur adhesive for attaching the carbon tissue to the concrete plate.
The defect was made by the absence of adhesive on the area of 10 cm × 10 cm at the middle of the defected sample.
3. Experimental Campaigns
3.1. Infrared Thermography Tests with Microwave Excitation
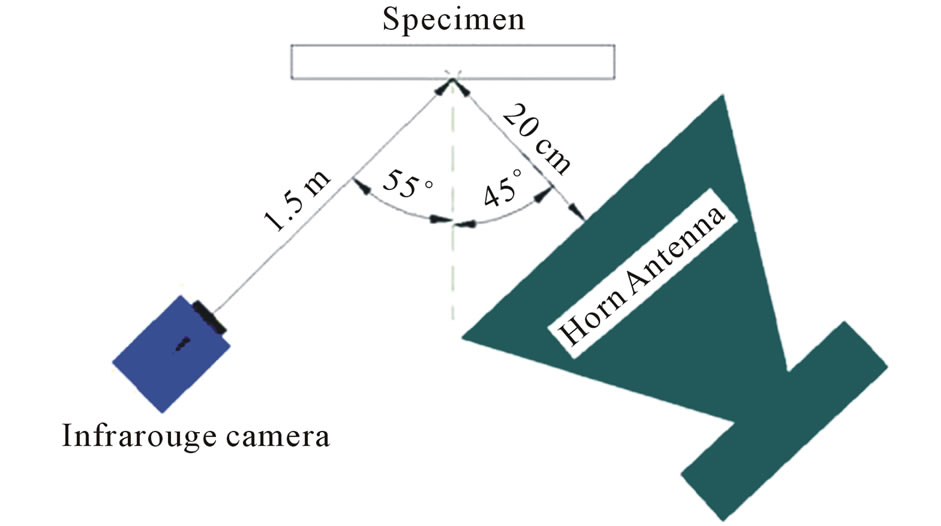
The samples were heated by the microwaves generated by a commercial magnetron at the frequency of 2.45 GHz. A pyramidal horn antenna with an opening (59 cm × 56 cm) of 40˚ served to guide the microwave beam onto the tested samples (Figure 2(b)).
The position of the samples was marked, at 20 cm from the antenna aperture (Figure 2(a)). An infrared camera sensitive to medium waves in range of 3 - 5 μm, with a detector of 320 × 256 matrix detector in InSb (Indium Antimonide), was placed at 1.5 m from the sample in 55˚ direction so as to detect the whole area heated by the microwave beam. The antenna was placed in the 45˚ direction. The thermograms were recorded at regular intervals (1 image per second) by a computer, synchronized to the infrared camera, using the ALTAIR program. The specimens were heated with a power of 360 W within 150 s. The tests on both samples (with defect, and without defect) had the same procedure (replaced the sample with defect by the sample without defect without changing the positions of the infrared camera and the antenna, and the power and duration of heating).
3.2. Infrared Thermography Tests with CO2 Laser Excitation
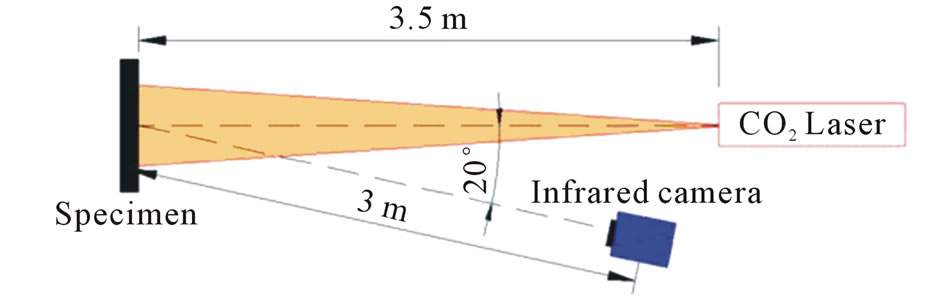
The test procedure was the same as the test with microwave excitation, but the specimens were heated within 40 s by CO2 Laser system with the power of 300 W. In this case, the specimens were placed at 3.5 m from the Laser system (Figure 3(a)); the distance enabling the laser beam to reach the whole surface area of the heated samples. The infrared camera was placed at 3 m from the
 (a)
(a)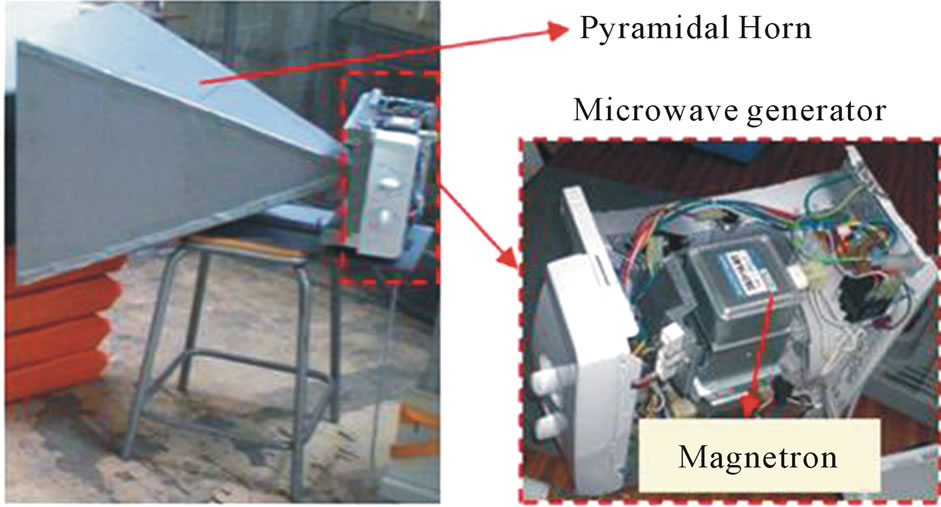 (b)
(b)
Figure 2. Test set-up. (a) Schema of the test with microwave excitation; (b) Microwave system.
sample, in 20˚ with the axis of the laser beam.
The CO2 Laser was an infrared laser having a wavelength of 10.6 µm. The system had a deviation device for changing the direction of the laser beam to any wanted positions of the specimens. In the deviation device (Figure 3(b)), there was a mirror to change the laser beam trajectory from vertical direction (from the machine) to horizontal direction. A lens (127 mm focal) was used to enlarge the diameter of the laser beam so as to get a bigger wanted area to heat. Further the samples were placed from the lens; the bigger surface area can be heated.
4. Results and Discussions
4.1. Thermograms Analysis
4.1.1. Tests with Microwave Excitation
The non-uniformity of the microwave beam, caused by its reflection from the specimen with the antenna, produced an in-homogeneous heat generated in the sample and may lead to misinterpretations. The amplitude of this non-uniformity depends also on the detected materials. Thus, the tests were conducted in two stages; the first stage on the specimen without defect, and the second stage on the specimen with defect. Then, the sequence of thermograms was analyzed by the contrast algorithm with Matlab program. The thermograms at the instant 100 s (the instant at which the contrast between the healthy and defected areas is maximum) were obtained as shown in the Figure 4.
Figure 4(a) shows the thermogram of the specimen without defect at the instant 100 s. Figure 4(b) shows the thermogram of the specimen with defect.
Figure 4(c) is the subtraction between the thermogram of the sample with the defect (Figure 4(b)), and the thermogram of the sample without defect (Figure 4(a)) at the same instant. The thermogram in Figure 4(d) is the subtraction of the thermogram in Figure 4(c) and its initial thermogram in order to consider only the defect as the difference between both samples (not taking into account the contrast made by their different initial temperatures). It shows clearly the defect at the middle of the sample. The absence of adhesive (replaced by the air, which has a smaller thermal conductivity) made it hotter than other area without defect.
4.1.2. Tests with CO2 Laser Excitation
The non-uniformity of the laser beam (Gaussian), after passing through the lens in the deviation device, caused also an inhomogeneous heat generated on the surface of the samples. Thus the same contrast algorithm was also used to analyze the thermograms in this case. By applying the previous algorithm to all the points of the specimen surfaces (37 cm × 35 cm area is observed), the thermograms obtained at the instant 41 s (the instant of the maximum contrast between the defected and healthy areas) are shown in the Figure 5.
The thermogram of the sample without defect (Figure 5(a)) shows the circular form and the nonuniformity of the laser beam on the surface of specimen, which proves the need of this sample for evaluating the defect in the sample with defect. The thermal contrast thermogram compared to initial instant (Figure 5(d)) shows clearly the defect at the middle of the specimen, which is hotter than other healthy area.
It is noticed that the thermal contrast between the defected area and the healthy area in Figure 5(d) (8˚C) is higher than in Figure 4(d) (1˚C), that’s why the defected area appears more clearly in Figure 5(d) than in Figure 4(d). This shows that the CO2 Laser is a better excitation than the microwave for this type of defect near the surface
 (a)
(a)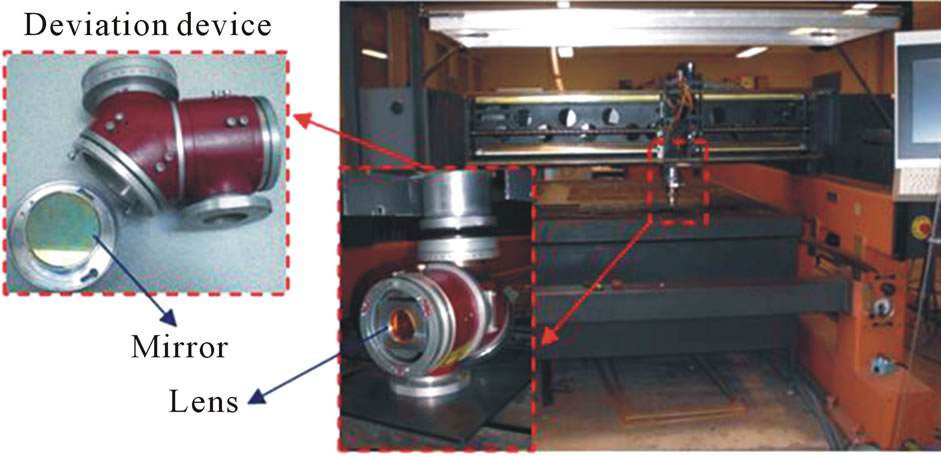 (b)
(b)
Figure 3. Test set-up. (a) Schema of the test with CO2 Laser; (b) CO2 Laser system.
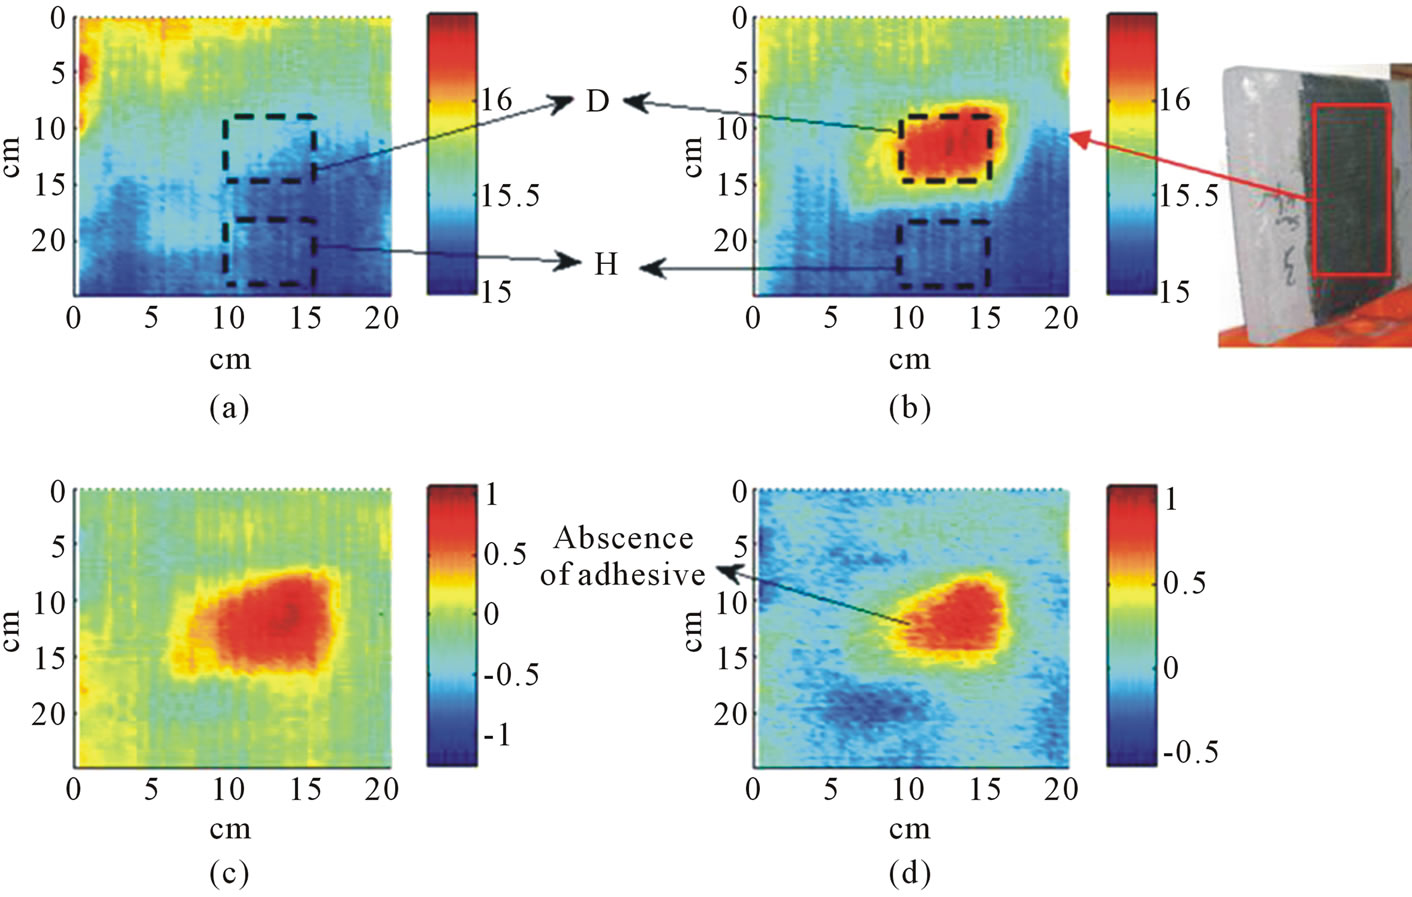
Figure 4. Thermograms from the tests with microwave excitation at the instant 100 s. (a) CFRP without defect; (b) CFRP with defect; (c) Thermal contrast between the specimens; (d) Thermal contrast compared to initial instant.
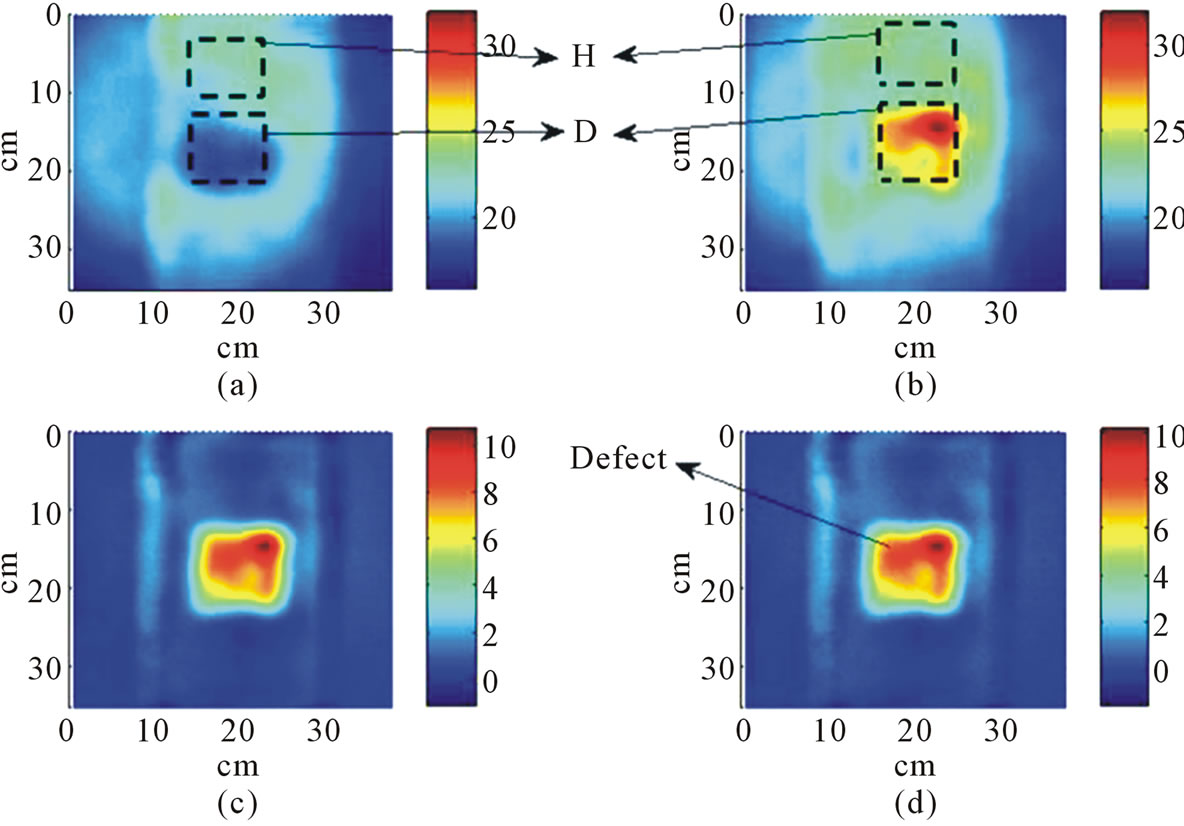
Figure 5. Thermograms from the tests with CO2 Laser excitation at the instant 41 s. (a) CFRP without defect; (b) CFRP with defect; (c) Thermal contrast between the specimens; (d) Thermal contrast compared to initial instant.
of the detected elements.
4.2. Evolution of Surface Temperatures
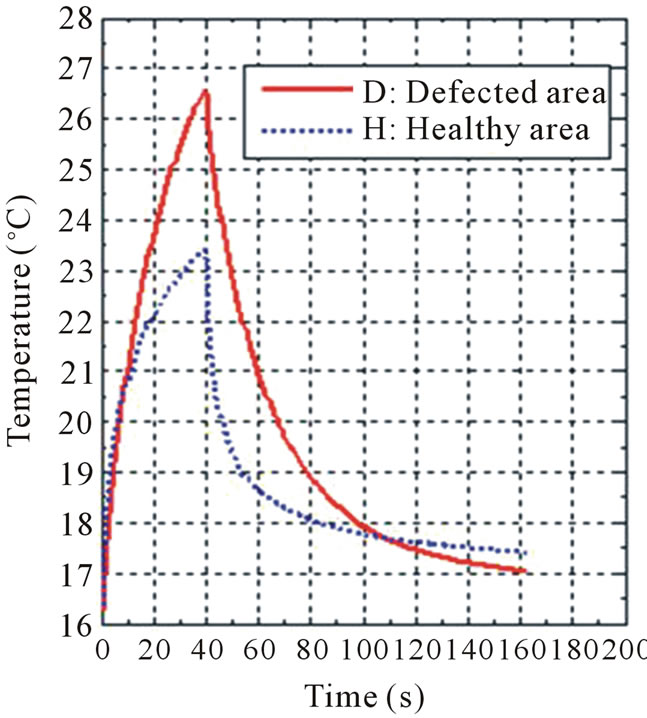
On the thermograms in Figures 4(b) and 5(b), suppose “H” an area without defect (healthy area), and “D” a defected area, situated at the same position of the specimen with defect. The temporal evolutions of the average temperatures of those two areas from both cases of excitation are shown in Figure 6.
In Figure 6(a), which is the case of the test with CO2 Laser, the surface temperature increases from the initial instant 16.25˚C to 26.5˚C in the defected area (10.25˚C), and from 16.25˚C to 23.5˚C (7.25˚C) in the healthy area. After the heating period of 40 s by the Laser, the surface temperatures of the specimens start the relaxation phase in both areas.
Figure 6(b) shows the temperature evolution in the case of microwave excitation. The surface temperature increases from 15.18˚C to 16.2˚C in the defected area (1.02˚C), and from 14.9˚C to 15.32˚C (0.42˚C) in the healthy area. It occurs also the relaxation phase after the heating period of 150 s by the microwave. In this case, the temperature curves are modulated by the heating phases of the microwave signals. These modulations can be explained by the signals of the microwave (detected by a sensor) in Figure 7.
The signals from the magnetron were used as the reference to know the waveform of the power supplied to the samples. The waveform envelope is a pulse train of variable width related to the transmitted power. At the average power of 360 W (which was used for these infrared thermography tests), each pulse has a period of 30 s and duration of 16 s (which corresponds to the modula-
 (a)
(a)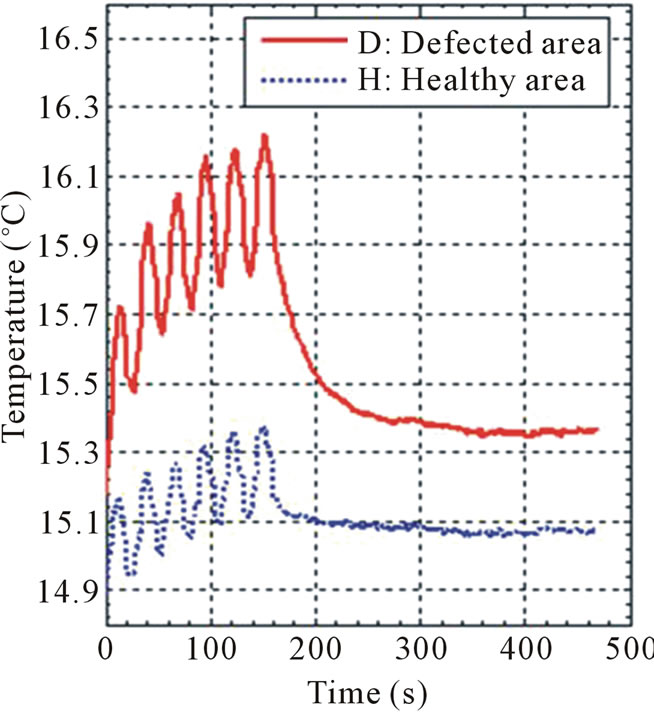 (b)
(b)
Figure 6. Temperature evolution. (a) Test with CO2 Laser; (b) Test with microwave.
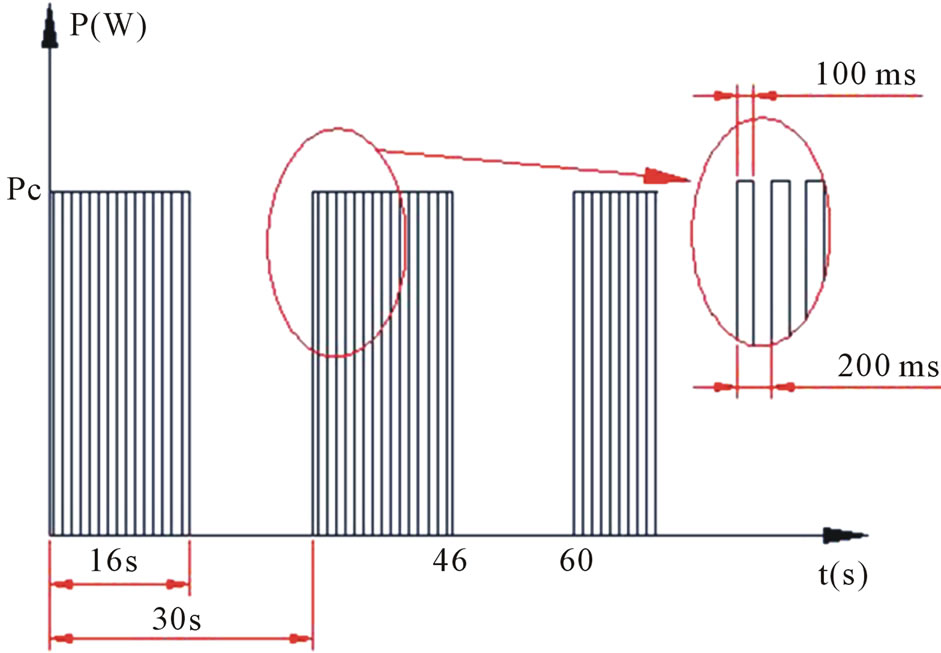
Figure 7. Microwave signal at 360 W.
tion period of the temperature curves). In each slot of the train, there is a modulation period of 200 ms and 100 ms of pulse duration. In Figure 7, Pc is the peak power of the signals.
It is observed that the microwave excitation gave a smaller increase in temperature (0.42˚C) than the CO2 Laser excitation (7.25˚C), because the microwave (12 cm of wavelength at 2.45 GHz) can penetrate deeper into the samples to make a volumic heating where as the CO2 Laser (10.6 µm of wavelength) make a surface heating.
5. Conclusions
The applications of the CO2 Laser infrared thermography and the microwave infrared thermography to the CFRP showed prominently the accessibility of these two methods in nondestructive testing (NDT) for composite materials as well as materials sciences. The comparison between the thermograms and the surface temperature increasing from both methods showed that the CO2 Laser excitation is better for the delamination detection in CFRP which is the near surface defect.
This study opens interesting perspectives for inspecting other types of defects in materials sciences; the microwave excitation, which is a volumic heating source, is suitable for the deep defects in the materials; whereas the CO2 Laser excitation, which is a powerful surface heating source, gives a great performance for the defects near the surface of the materials.
6. Acknowledgements
This work was carried out at Laboratoire de Génie Civil et GéoEnvironnement (LGCgE). The authors would like to acknowledge Nord-Pas-Calais regional council and Université d’Artois for financial support, and the Centre d’Application Laser Flandre-Artois (CALFA) at Institut de Technologie Universitaire de Béthune (IUT Béthune) for the CO2 Laser system for the tests.
REFERENCES
- R. Sen and G. Mullins, “Application of FRP Composites for Underwater Piles Repair,” Composites Part B: Engineering, Vol. 38, No. 5-6, 2007, pp. 751-758. http://dx.doi.org/10.1016/j.compositesb.2006.07.011
- M. V. Seica and J. A. Packer, “FRP Materials for the Rehabilitation of Tubular Steel Structures, for Underwater Applications,” Composite Structures, Vol. 80, No. 3, 2007, pp. 440-450. http://dx.doi.org/10.1016/j.compstruct.2006.05.029
- L. De Lorenzis and J. G. Teng, “Near-Surface Mounted FRP Reinforcement: An Emerging Technique for Strengthening Structures,” Composites Part B: Engineering, Vol. 38, No. 2, 2007, pp. 119-143. http://dx.doi.org/10.1016/j.compositesb.2006.08.003
- S. B. Kim, et al., “Development of Aqua Epoxy for Repair and Strengthening of RC Structural Members in Underwater,” Construction and Building Materials, Vol. 23, No. 9, 2009, pp. 3079-3086. http://dx.doi.org/10.1016/j.conbuildmat.2009.04.002
- American Concrete Institute, “ACI 503R-93, Use of Epoxy Compounds with Concrete,” American Concrete Institute, Farmington Hills, 1998.
- Ch. Maierhofer, A. Brink, M. Röllig and H. Wiggenhauser, “Transient Thermography for Structural Investigation of Concrete and Composites in the Near Surface Region,” Infrared Physics & Technology, Vol. 43, No. 3-5, 2002, pp. 271-278. http://dx.doi.org/10.1016/S1350-4495(02)00151-2
- J. R. Brown and H. R. Hamilton, “Quantitative Infrared Thermography Inspection for FRP Applied to Concrete Using Single Pixel Analysis,” Construction and Building Materials, Vol. 38, 2013, pp. 1292-1302.
- W. L. Lai, et al., “Characterization of the Deterioration of Externally Bonded CFRP-Concrete Composites Using Quantitative Infrared Thermography,” Cement and Concrete Composites, Vol. 32, No. 9, 2010, pp. 740-746. http://dx.doi.org/10.1016/j.cemconcomp.2010.03.008
- X. Maldague, “Theory and Practice of Infrared Technology for Nondestructive Testing,” Wiley, New York, 2001.
- C. A. Balaras and A. A. Argiriou, “Infrared Thermography for Building Diagnostics,” Energy and Buildings, Vol. 34, No. 2, 2002, pp. 171-183. http://dx.doi.org/10.1016/S0378-7788(01)00105-0
- M. Choi, K. Kang, J. Park, W. Kim and K. Kim, “Quantitative Determination of a Subsurface Defect of Reference Specimen by Lock-In Infrared Thermography,” NDT & E International, Vol. 41, No. 2, 2008, pp. 119-124. http://dx.doi.org/10.1016/j.ndteint.2007.08.006
- S. Vallerand and X. Maldague, “Defect Characterization in Pulsed Thermography: A Statistical Method Compared with Kohonen and Perceptron Neural Networks,” NDT & E International, Vol. 33, No. 5, 2000, pp. 307-315. http://dx.doi.org/10.1016/S0963-8695(99)00056-0
- C. Ibarra-Castanedo, F. Galmiche, A. Darabi, M. Pilla, M. Klein, A. Ziadi, S. Vallerand, J.-F. Pelletier and X. Maldague, “Thermographic Nondestructive Evaluation: Overview of Recent Progress,” In: SPIE—Society of PhotoOptical Instrumentation Engineers Proceedings Volume 5073, Procedures Thermosense XXV, Society of PhotoOptical Instrumentation Engineers, Bellingham, 2003, pp. 450-459.
- U. Galietti, D. Palumbo, G. Calia and F. Ancona, “New Data Analysis to Evaluate Defects in Composite Materials Using Microwaves Thermography,” The 11th International Conference on Quantitative InfraRed Thermography, Naples, 11-14 June 2012, 10p.
- J. L. Pedreño-Molina, J. Monzó-Cabrera and M. Pinzolas, “A New Procedure for Power Efficiency Optimization in Microwave Ovens Based on Thermographic Measurements and Load Location Search,” International Communications in Heat and Mass Transfer, Vol. 34, No. 5, 2007, pp. 564-569. http://dx.doi.org/10.1016/j.icheatmasstransfer.2007.02.002
- G. Cuccurullo and V. Pierro, “A Procedure to Measure Electromagnetic Skin Depth in Microwave Heating,” Infrared Physics & Technology, Vol. 46, No. 1-2, 2004, pp. 49-55. http://dx.doi.org/10.1016/j.infrared.2004.03.006
- T. Li, D. P. Almond and D. A. S. Rees, “Crack Imaging by Scanning Pulsed Laser Spot Thermography,” NDT & E International, Vol. 44, No. 2, 2011, pp. 216-225. http://dx.doi.org/10.1016/j.ndteint.2010.08.006
- J. Schlichting, Ch. Maierhofer and M. Kreutzbruck, “Crack Sizing by Laser Excited Thermography,” NDT & E International, Vol. 45, No. 1, 2012, pp. 133-140. http://dx.doi.org/10.1016/j.ndteint.2011.09.014