Materials Sciences and Applications
Vol. 4 No. 5 (2013) , Article ID: 31466 , 8 pages DOI:10.4236/msa.2013.45038
Process Adaption and Modifications of a Nutrient Removing Wastewater Treatment Plant in Sri Lanka Operated at Low Loading Conditions
![]()
1Purac AB, Emdalavägen, Lund, Sweden; 2SWECO Environment, Stockholm, Sweden.
Email: Johanna.berg@purac.se, Stig.morling@sweco.se
Copyright © 2013 Johanna Berg, Stig Morling. This is an open access article distributed under the Creative Commons Attribution License, which permits unrestricted use, distribution, and reproduction in any medium, provided the original work is properly cited.
Received March 5th, 2013; revised April 9th, 2013; accepted April 21st, 2013
Keywords: Activated Sludge; Low Load; Nutrient Removal; Nitrogen; Phosphorus; Intermittent Operation
ABSTRACT
The Sri Lankan national water authority, that is The National Water Supply and Drainage Board (NWS&DB) has taken a new wastewater treatment plant into operation at Ja Ela, North of Colombo. The plant has been in operation since September 2011. In April 2012, it was concluded how a test of the aeration efficiency and a performance test should be carried out. The tests have been based on the actual loading of the plant and the analysis results from the daily process control. The evaluation of the aeration efficiency is not reported in this paper. The paper presents the overall performance of the water treatment part of the plant during start-up conditions, from fall 2011 through the first five months of 2012. The results from the operation are found in Table 1. An important circumstance at the plant is the current very low loading in comparison with the design load. This fact has resulted in an introduction of an intermittent mode of the aeration (nitrification) reactor. Based on operation figures, during more than a month (May 2012), it has been possible to give a realistic assessment of the overall performance. The most striking results are summarized as follows: 1) The intermittent operation has enabled an energy efficient operation of the plant. By the introduction of the intermittent aeration, the energy consumption has been reduced by around 75%, compared with the continuous operation mode; 2) The plant performance during the intermittent operation has been improved with respect to virtually all important pollution variables. The most striking improvement is the discharge total P level, reflecting that a substantial enhanced biological phosphorus removal takes. The typical discharge levels found during May 2012, were compared with the earlier obtained values. It is important to underline that the loading on the plant has slightly increased during May as compared with the previous operation period.
1. Background
Planning and construction of wastewater treatment plants is normally a very demanding task that includes a large number of assumptions, considerations and technical knowledge. Within the field of municipal wastewater planning, some distinct points should be considered. These points are not necessarily identical with what is found for industrial wastewater planning. Some major conditions that rule the planning, design and construction of a municipal plant, may be summarized as follows:
• An identified design and operation period is normally defined at an early stage of the planning phase. A very often used operation period is found to be between 15 and 20 years;
• There is often a more or less strong political demand for a “sustainable” wastewater treatment. Even though the expression is somewhat unclear it is more or less imperative to include aspects on sustainability in the planning. Of course you may argue that any professional planning and design should by necessity be based on a technical sustainability;
• The operation period will normally include a step by step increase of pollution loading of the plant during the operation time. Therefore, most municipal plants are designed for a specific loading occurring at the end of the design period; say 15 to 20 years away. This design capacity is defined to allow for a growth of the community within the catchment area. The opposite mode (to design the plant for the current pollution load only) would create political, technical and
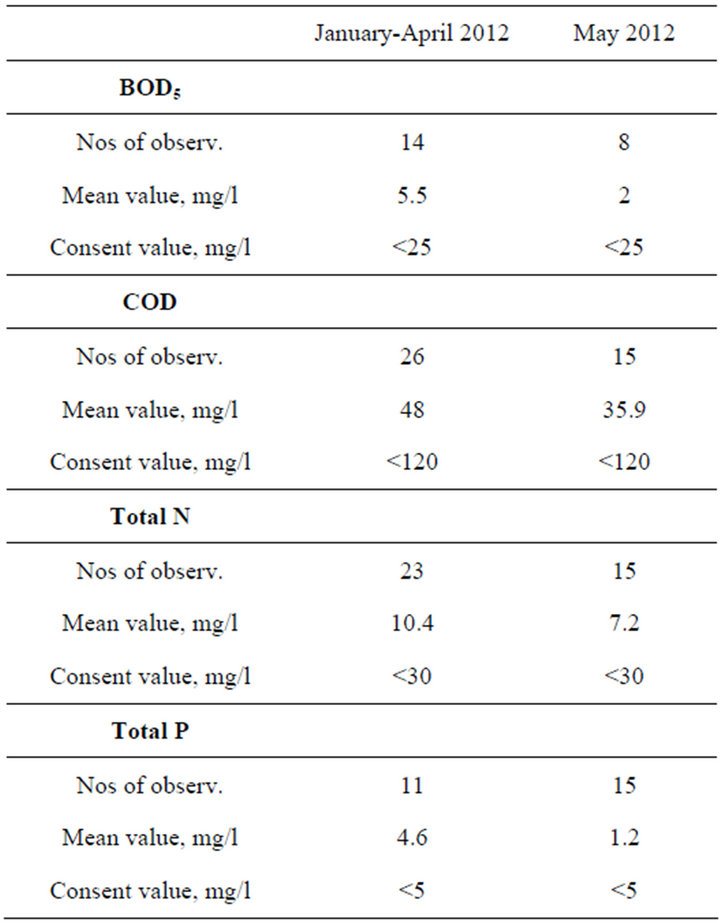
Table 1. Summary of the discharge levels from Ja-Ela WWTP in May 2012 compared with earlier typical effluent values.
operational problems!
• Another important circumstance is the fact that the community has limited financial resources. Thus it has to relate both to the sizing of the plant as well as to the plant configuration;
• In order to enlighten the situation another circumstance would be addressed. The given effluent standards for a municipal WWTP are normally valid for a limited time, defined in the legal permit. We may call this for the “environmental lifetime” for the performed investment. Looking back in the latest century it is easy to find a more or less typical time frame for the permit. The example from Sweden seems to sustain the assumption of a 20 year time for an update and sharpening of the effluent standards.
These conditions together form some of the pre-requisites for a municipal WWTP. One of the most common and sometimes surprising situations is anyhow that a plant will operate substantially below the design load conditions. If not addressed properly, this may result in very poor operation economics—excessive operation costs per amount of pollution treated. In some cases it may also lead to inferior performance. One possible cause may be a nitrification that “burns out” all alkalinity and thus more or less inhibits the entire process, due to a pH drop.
Historically a large number of plant operators have experienced this situation. An efficient way to mitigate such a situation has been to change the operation mode, either by closing part of the plant, or to introduce an intermittent operation. A probably well-known example of converting the operation of a continuously working plant into intermittent operation was the development of the BioDenitro system in Denmark [1]. Further basic and applied knowledge derived from the SBR-technology development can be obtained on intermittent operation strategies, [2-5]. The demands for an improved control of the activated sludge system by means on on-line instruments, and of course most of all a deep understanding of the process kinetics has been addressed recently [6]. The potential to improve the process performance and at the same time save aeration energy is obvious even for plants operated at almost design conditions.
The Ja-Ela/Ekala WWTP is part of a larger scheme covering both the collection systems and a second WWTP, south of Colombo. Financing has been secured by support from Sida (Swedish International Development Agency), the basic design work and engineering support has been performed by SWECO, Sweden. The plant design and construction has been performed by Purac AB, Sweden.
The situation with a low load situation during the start up year at the Ja-Ela/Ekala WWTP may be seen as a very typical example of an “under-loaded” plant. So this plant presents a rather typical example of the initial operating situation. The challenge in this case has been to address and mitigate the problem in a cultural environment with limited experience of running advanced wastewater treatment facilities.
This paper describes the situation with the initially encountered problems with the under-loading, as well as the actions taken to mitigate the identified problems. The outcomes of the alteration of the plant are accordingly reported, thanks to a very frequent sampling and analysis of the wastewater and sludge.
2. Material and Methods
2.1. Design Figures and Permissible Discharge Levels for the Ja-Ela/Ekala WWTP
The following Table 2 shows the design loads for the Ja-Ela/Ekala WWTP, along with the anticipated load developments. The following table illustrates the presumed development of the flows and loads during the design period. The plant configuration is shown in the flow sheet found in Figure 1.
2.2. Sampling and Analysis
As the accredited laboratory was not been able to present the analysis results within an acceptable timeframe it was
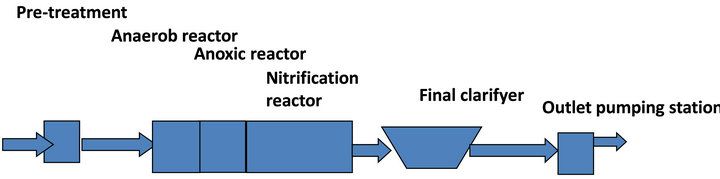
Figure 1. Simplified flow sheet over Ja-Ela/Ekala WWTP.

Table 2. Main design figures and ruling consent levels for Ja-Ela/Ekala WWTP.
concluded to use the onsite resources. Thus, the presented results are based on a site laboratory analysis, using the Hach-Lange analysis kits. The methods are defined as follows:
For BOD test: LCK 555;
For COD test on influent: LCK 514;
For COD test on effluent: LCK 314;
For Total N test on influent: LCK 338;
For Total N test on effluent: LCK 238;
For NH4-N tests: LCK 303;
For Nitrate test on effluent: LCK 340;
For Total P test on influent: LCK 338;
For PO4-P tests: LCK 348.
For tests on suspended solids (SS), volatile suspended solids, of dry solids (DS) or total solids (TS) and volatile solids (VS) the contractor has provided standard instructions.
For inlet and discharge sampling automatic samplers are installed and have been used for 24 hour composite sampling, performed with an ASP station 2000 Peristaltic. The free oxygen level in the nitrification tank is measured on line with an Endress Hauser Liquisys com 223/ 253 meter. In a similar manner the SS-concentration is measured on line in the biological reactors by using an Endress Hauser Liquisys cum 223/253 meter. The wastewater flow is measured and recorded on a daily basis. Two different flow measurement points are defined, 1) at the inlet to the biological treatment, where an overflow arrangement is installed; 2) At the discharge point from the plant, after the effluent pumping station, where a magnetic flow meter is installed.
3. Performance and Results
3.1. Flows into the Plant
The plant has been in operation since September 2011. In principle the flow is recorded on a daily basis. The two measurement points at the inlet and the outlet differ to a certain extent. Thus, the following presentation and analysis is based on the flow measurements at the discharge point, as the magnetic flow meter is deemed to provide far more correct figures than the overflow arrangement provides. The number of flow observations is adequate to allow a presentation of statistics. This is found in Table 3.
3.2. Pollution Loads into the Plant
The amounts of analysis results on incoming loads are far more limited than the recording of daily flows. In the following the main pollutants are presented statistically, though the recording is limited to year 2012.
3.3. Organic Pollution
The organic loading of the plant is measured mainly as COD, although the BOD5 also is presented with a few observations. Shown in Table 4 are the concentrations and loads for BOD5 and COD during the period January 2012 through to mid April 2012. As a comparison the corresponding figures from May 2012 are shown in the same table. Comments to Table 4: It is important to observe that the number of observations with respect to BOD is very limited. Thus it is preferred to use the median value in the following comments. The design load expressed as BOD is 2191 kg/d. Thus the median loading is only 10.5% of the design level.
3.4. Nutrient Loading
In a similar manner the nutrients, nitrogen and phosphorrus are recorded during the period. Also for these vari-

Table 3. Summary of wastewater flows leaving the Ja-Ela WWTP from September 2011 through to April 2012, and for May 2012.
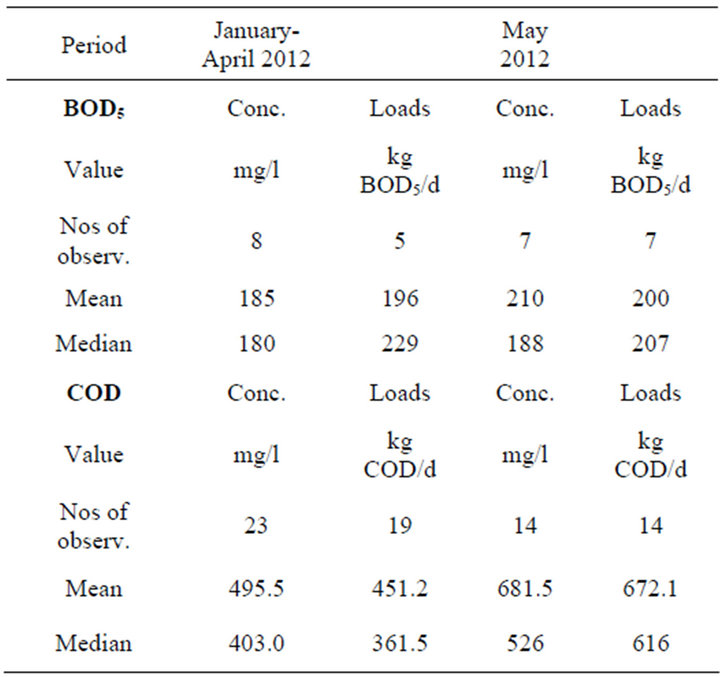
Table 4. Summary of organic loads (BOD5) and COD into Ja-Ela WWTP January 2012 through to April 2012, and for May 2012.
ables only the 2012 year figures are presented. In order to make the comparison somewhat easier the two periods of January-April 2012 and May 2012 are shown side by side. In Table 5 is found the nitrogen values in incoming wastewater. Comments to Table 5: The number of observations is in both cases many enough to be used from a statistical point of view. As the mean and median values do not deviate substantially we will use the mean values for further discussions. The actual mean value is 13.1% of the design load. For the incoming phosphorus values recorded concentrations and calculated loads are presented in Table 6. Comments to Table 6: The number of observations with respect to phosphorus is limited. The mean and median values are very close, thus we use the mean value for further comments. The actual mean value is 8.7% of the design load.
3.5. Pollution Ratios in Raw Wastewater
A way to assess the used analysis reliability is to calculate the pollution ratios in the wastewater. The ratios on relevant pollution variables on untreated wastewater are also compared with what is assumed to be a “typical mu-
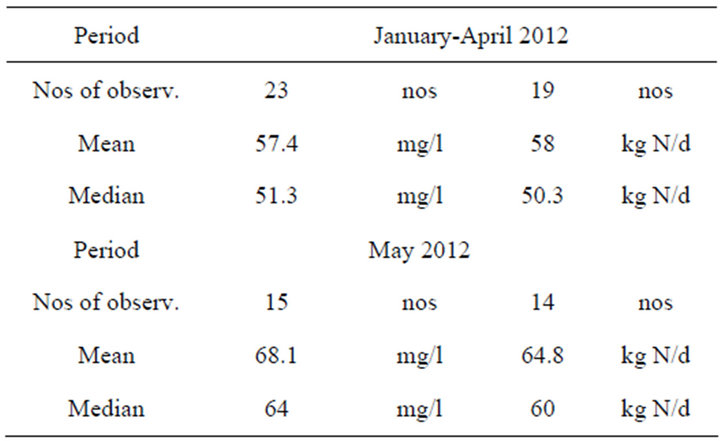
Table 5. Summary of total nitrogen loads into Ja-Ela WWTP January 2012 through April 2012, and May 2012.
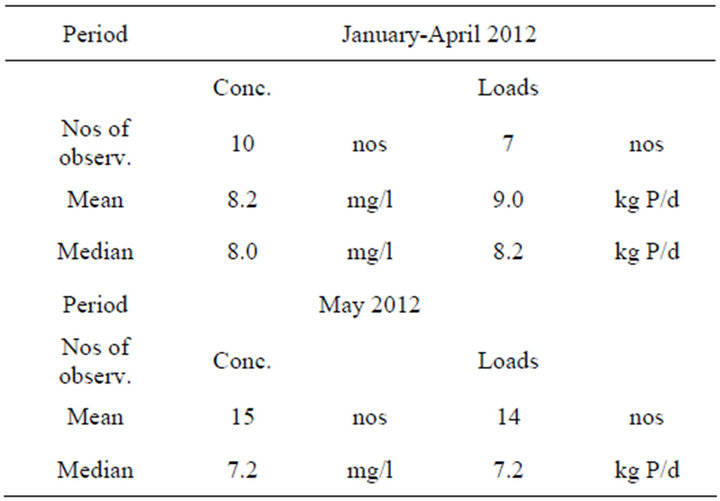
Table 6. Summary of total phosphorus loads into Ja-Ela WWTP January 2012 through April 2012, and May 2012.
nicipal wastewater”. In the following ratios are given for two operation periods, September 2011 through April 2012 (first period), and May 2012 (second period):
First period: COD: BOD, mean value of 23 observations = 2.5:1; this value coincides with a “typical municipal wastewater”; Second period: COD: BOD, mean value of 4 observations = 3.3:1; this value higher than the “typical value for municipal wastewater”. The number of observations in this case is low, thus the earlier observation regarding the previous operation period is deemed far more reliable.
First period COD: SS, mean value of 77 observations = 4.1:1; this value is higher than a “typical municipal wastewater”; Second period: mean value of 10 observations = 1.2:1; this value is lower than a “typical value for municipal wastewater”.
First period COD: total N, mean value of 79 observations = 8.7:1; this value is slightly lower than a “typical municipal wastewater”; Second period COD: total N mean value of 10 observations = 11.3:1; this value is in accordance with “a typical municipal wastewater”.
First period: COD: total P, mean value of 32 observations = 99.6:1; this value is higher than a “typical municipal wastewater”. Second period mean value of 10 observations = 88.3:1; this value higher than the “typical value for municipal wastewater”.
3.6. Discharge Levels from the Plant
The organic pollution discharge from the plant is meas-
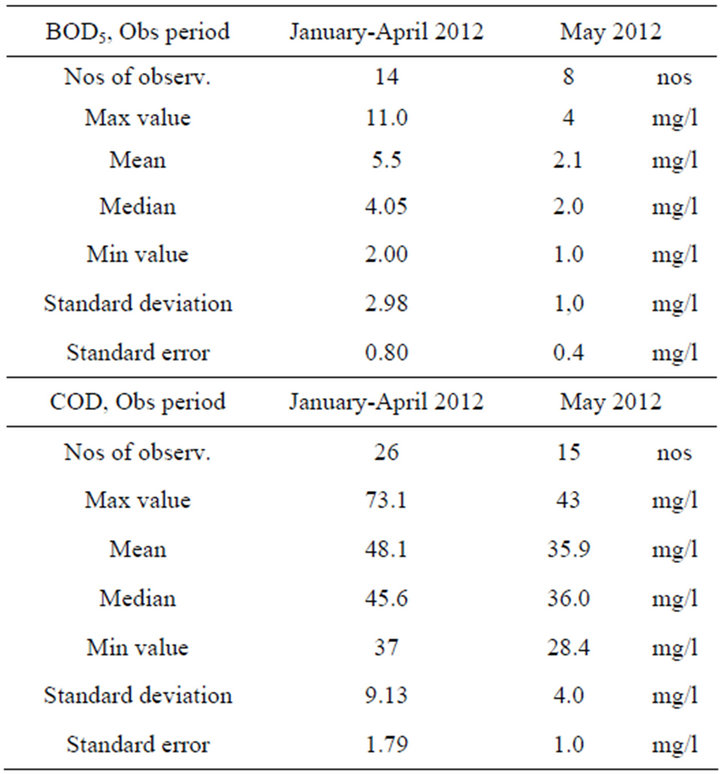
Table 7. Summary of BOD5 and COD discharge levels from Ja-Ela WWTP January 2012 through April 2012, and for May 2012.
ured mainly as COD, although also the BOD5 also is presented with few observations. In Table 7 is shown the discharge concentrations for BOD5 and COD during the period January 2012 through mid April 2012 and for May 2012. Comments to Table 7: The discharge levels of BOD5 are all substantially lower than the ruling consent value = 25 mg/l. As the plant is running with very low loading and a virtually complete nitrification, see the figures below, the discharge levels of mainly around 5 mg/l are expected. It may also be observed that the discharge figures in May 2012 have been significantly lower than during the first trimester of 2012. The discharge levels of COD are all substantially lower than the ruling consent value = 120 mg/l. As the plant is running with very low loading and with possibly a very high SRT (Solids Retention Time) the results are as expected, with normal discharge levels <50 mg COD/l. It may also be observed that the May results are significantly lower than the values during the first trimester 2012. The recorded removal levels of COD suggest that the incoming organic pollution is mostly comparatively easily degradable.
3.7. Discharge of Nutrients from the Plant
In a similar manner the nutrients, nitrogen and phosphorus are recorded during the period. Also for these variables only the 2012 year figures are presented. In the
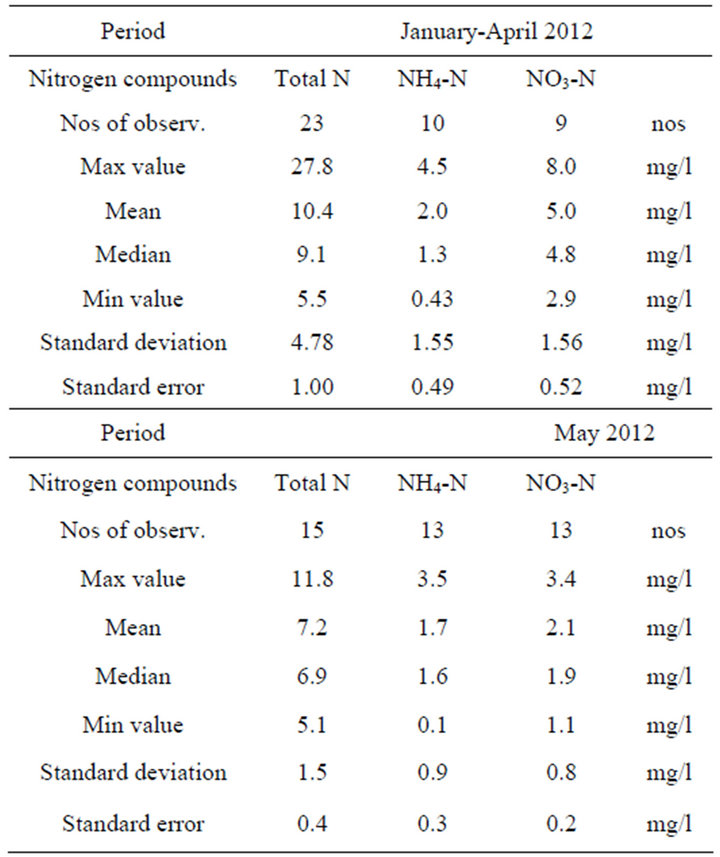
Table 8. Summary of nitrogen compounds in effluent from Ja-Ela WWTP January 2012 through April 2012, and May 2012.
case of nitrogen, total N, ammonia N and nitrate N are analyzed and recorded. The nitrogen discharge is presented in Table 8 (total nitrogen, ammonia nitrogen and nitrate nitrogen). Comments to Table 8: The fact that the plant is operated at very low load levels is reflected in the nitrogen removal performance. Generally the removal is found to be very good with discharge levels of total nitrogen at around 10 mg N/l compared with the ruling consent level of <30 mg N/l. The nitrification level is very high with a median value of 1.28 mg NH4-N/l in effluent, compared with the ruling consent level of <10 mg NH4-N/l. The discharge of nitrate is found to be around 5 mg NO3-N/l. According to the results it is estimated that the discharge level of organic nitrogen is around 3 mg N/l. This in turn may indicate that the industrial influence is important. A well nitrified municipal wastewater would have an organic nitrogen discharge content of around 1 mg N/l at similar inlet nitrogen concentrations.
Comments to Table 9: The number of observations is in this case rather limited. One observation shows a high effluent level, while the remaining observations are under the ruling consent value of 5.0 mg P/l. However, in the light of the overall performance and the adopted process chain it would be possible to run the plant with lower effluent P values. The performance during May 2012, after the introduction of an intermittent aeration mode has resulted in a quite substantial improvement of the phosphorus removal.
4. Discussion
The Ja-Ela WWTP is currently running with very low inlet loads in comparison with the design data. This is true for both flows and the major relevant pollutants. The overall treatment results are far better than the ruling consent levels. During the ruling circumstances anything else would be more than astonishing. However, the low
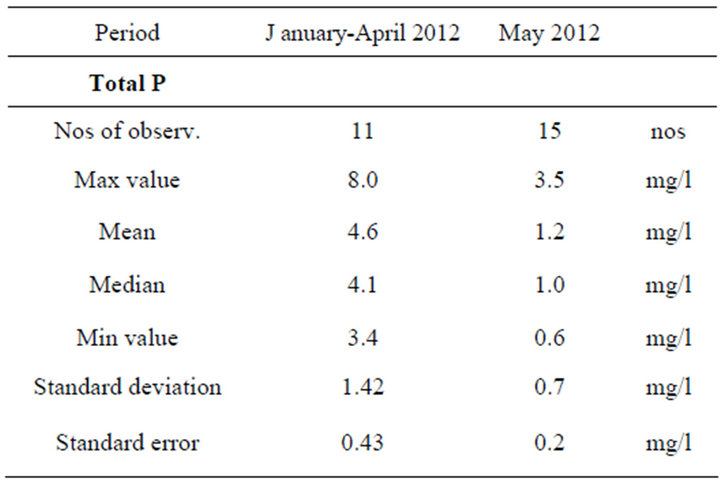
Table 9. Summary of total P, Conc. in effluent from Ja-Ela WWTP January 2012 through April 2012, and May 2012.
load situation in relation to the reactor volumes created a number of set-backs that had to be mitigated as the initial operation caused some efficiency problems. The major ones are summarized as follows:
1) The operation, until mid April 2012, has been based on a continuous aeration in the bio-reactor aimed for nitrification. This has resulted in unnecessarily high free oxygen levels, and as a consequence, an excessive energy use for aeration. When the aeration has been operated 24 hours a day the consumed power for aeration then is around 1440 kWh/d. The matter was also reflected by the free oxygen level in the nitrification redactor being 5 and 7 mg O2/l at the outlet part of the aeration reactor;
2) It should be observed that the aerobic reactor has a wet volume of 2383 m3. Thus the hydraulic retention time as an average is more than 2 days at the prevailing conditions;
3) The currently operated solids retention time (SRT) is reported to be very high by the Contractor. As only small amounts of excess activated sludge have been withdrawn from the reactors it is very likely that this observation is correct;
4) The return activated sludge rate is also very high, the ratio during day hours is roughly 10:1, while a far more realistic ratio would be in the order 2:1 to 0.75:1;
5) The current operation mode with too high free oxygen levels (also supported by the high recirculation rate of return activated sludge), very high SRT and complete nitrification may well promote the rather high discharge levels of phosphorus. Although this matter is not critical it may be possible to lower this discharge level by process modifications.
Based on these considerations some alterations were made in the operation strategy, starting at the beginning of May 2012. The most apparent observations are the following:
1) The new operation mode based on an intermittent operation of the aeration has provided an improved treatment result. The following operation scheme has been implemented from the last day of April 2012: This includes a typical “operation cycle” with a total length of 1.8 hours, thus giving a total number of cycles = 12/d. The total aerated time is 3.5 h/d and the stop time 20.5 h/d.
2) Generally speaking the change of operation mode has been successful with respect to the supplied oxygen to the reactor. Now, based on this scheme it is possible to calculate the typical, specific load values for F/M and nitrogen in the aeration basin. Observe that in this case only the aerated time is used as a basis for an “aerobic F/M, based on COD” and the potential N load related to nitrification. The mean value for the aerobic F/M has been 0.61 kg COD/kg SS/d and the specific aerobic nitrogen load has been 0.053 kg N/kg SS/d during the altered operation in May 2012.
3) The sludge volume (SV) is analyzed on a regular basis and thus it is possible to calculate the SVI (Sludge Volume Index). In Table 10, a statistical presentation of SS levels in the bioreactors, the measured SV and the calculated SVI are presented.
The sludge quality data are so far deemed to be very good, with SVI levels normally <90 ml/g. The currently operated solids retention time (SRT) is reported to be high by the Contractor. As only small amounts of excess activated sludge have been withdrawn from the reactors it is very likely that this observation is correct. In order to assess the SRT in a quantitative manner it is important to measure the SS content in the bioreactor system, in the waste activated sludge system and in the discharge wastewater. It is also imperative to measure the waste activated sludge flow and record the amounts of discharge wastewater.
Some “shortcomings” in the applied design in relation
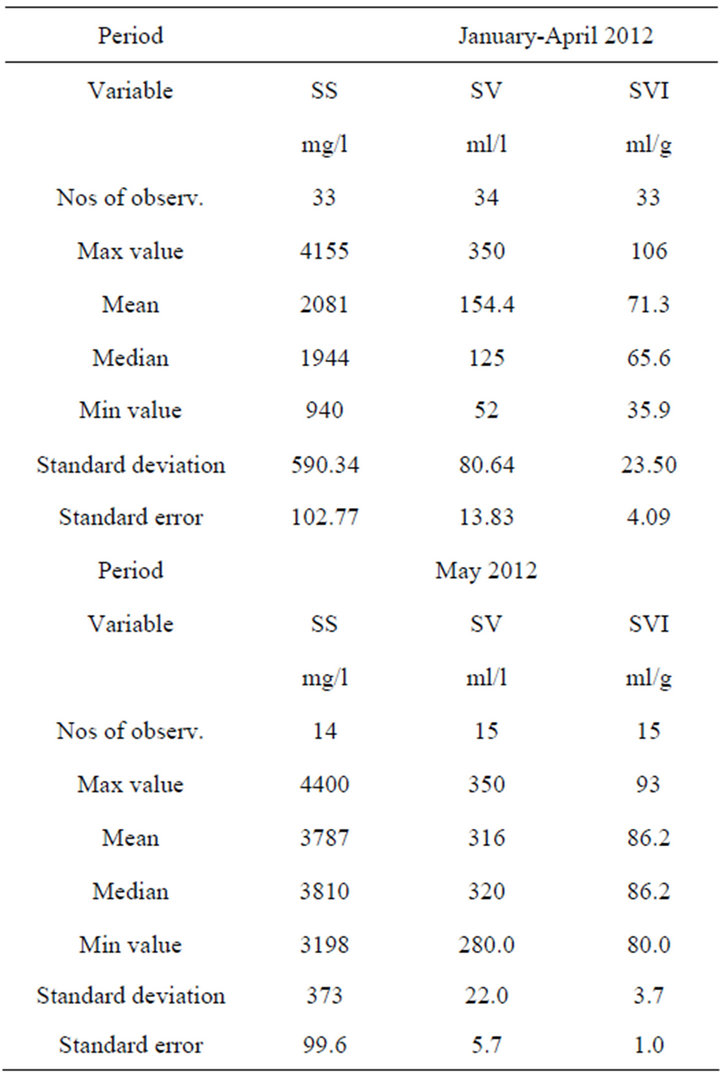
Table 10. Summary of sludge quality data in bioreactors at Ja-Ela WWTP January 2012 through April 2012, and May 2012.
to an intermittent operation are worth-while to observe. The wasting of activated sludge is done from the return activated sludge pipe. Thus it has been difficult to control the SRT in the best possible way during the intermittent operation. The automation system allows only for a maximum stop of the blowers by 99 minutes, thus a further optimization has been limited. The cooling of the blowers has also become a limitation. This is mostly related to the prevailing air temperature of 25˚C - 35˚C.
5. Conclusions
The issue of operation of an under-loaded activated sludge treatment facility has been addressed and the basic problem has been identified as an excessive use of energy for the aeration. The way to mitigate this problem showed to be a very simple one—to operate the aeration basin at an intermittent mode. In this specific case it has been possible to implement this model; however, some important limitations have been identified at the same time:
• It is found imperative that the on-line measurement of operation variables are viable and maintained on a regular basis;
• The automation mode must allow for a flexible intermittent operation. This is a consideration that should be reflected already in the design work;
• An additional removal strategy for the waste activated sludge may be needed: To withdraw the sludge from the intermittent reactor;
• The current mode of intermittent operation has been successful also thanks to an extended hydraulic retention time in the aerobic reactor. This matter must be addressed closely when applying the strategy; at shorter hydraulic retention times there is a risk that amounts of non nitrified ammonia will pass through the system;
• The outcome of the operation modification has been by large very satisfying, with a sustained biological performance with respect to organic removal (expressed as BOD and COD), an improved removal of total nitrogen thanks to an efficient denitrification and finally but not least striking: An efficient biological phosphorus removal has been established in the vicinity of 80% to 90%.
6. Acknowledgements
The client’s personnel, represented by H. A. Ariyiadasa, Head of Wastewater Treatment Plant NWS&DB, and G. D. N. Neville, Chief Project Engineer, NWS&DB; R Kulanatha, Project Director NWS&DB have been helpful at the plant—providing viewpoints and information on the day-by-day operation. Mr. Staffan Indebetou at Purac has given valuable information on the plant design details. For the linguistic check-out Mr. Guy Taylor has been of great help.
REFERENCES
- M. J. Tetreault, B. Rusten, A. H. Benedict and J. F. Kreissl, “Assessment of Phased Isolation Ditch Technologies,” The 59th Annual Conference of the Water Pollution Control Federation, 7 October 1986.
- R. I. Irvine, “Technology Assessment of Sequencing Batch Reactors,” US Environmental Protection Agency, Cincinnati, 1983.
- R. L. Irvine, et al., “Analysis of Full-Scale SBR Operation at Grundy Center, Iowa,” Journal of Water Pollution Control Federation, Vol. 59, No. 3, 1987, pp. 132-138.
- E. C. Hoepker and E. D. Schroeder, “The Effect of Loading Rate on Batch-Activated Sludge Effluent Quality,” Journal of Water Pollution Control Federation, Vol. 51, No. 2, 1979, pp. 264-270.
- S. Marklund and S. Morling, “Biological Phosphorus Removal at Temperatures from 3 to 10˚C—A Full Scale Study of a Sequencing Batch Reactor Unit,” Canadian Journal of Civil Engineering, Vol. 21, No. 1, 1994, pp. 81-88. doi:10.1139/l94-008
- L. Rieger, I. Takás and H. Siegrist, “Improving Nutrient Removal while Reducing Energy Use at Three Swiss WWTPs Using Advanced Control,” Water Environment Research, Vol. 84, No. 2, 2012 pp. 170-188. doi:10.2175/106143011X13233670703684