Journal of Modern Physics
Vol.4 No.8(2013), Article ID:35800,7 pages DOI:10.4236/jmp.2013.48142
Modelling Bacterial Dynamics in Food Products: Role of Environmental Noise and Interspecific Competition
1Dipartimento di Fisica e Chimica, Group of Interdisciplinary Physics, Università di Palermo and CNISM, Unità di Palermo, Viale delle Scienze, Palermo, Italy
2Department of Veterinary Science, Università di Messina, Polo Universitario dell’Annunziata, Facoltà di Medicina Veterinaria, Messina, Italy
Email: davide.valenti@unipa.it, agiuffrida@unime.it, bernardo.spagnolo@unipa.it
Copyright © 2013 Davide Valenti et al. This is an open access article distributed under the Creative Commons Attribution License, which permits unrestricted use, distribution, and reproduction in any medium, provided the original work is properly cited.
Received April 24, 2013; revised June 2, 2013; accepted July 9, 2013
Keywords: Statistical Mechanics; Population Dynamics; Noise-Induced Effects; Stochastic Modeling; Noise in Biological Systems
ABSTRACT
In this paper we review some results obtained within the context of the predictive microbiology, which is a specific field of the population dynamics. In particular we discuss three models, which exploit tools of statistical mechanics, for bacterial dynamics in food of animal origin. In the first model, the random fluctuating behaviour, experimentally measured, of the temperature is considered. In the second model stochastic differential equations are introduced to take into account the influence of physical and chemical variables, such as temperature, pH and activity water, subject to deterministic and random variations. The third model, which is an extended version of the second one, neglects the environmental fluctuations, and concentrates on the role of the interspecific bacterial interactions. The comparison between expected results and observed data indicates that the presence of noise sources and interspecific bacterial interactions improves the predictive features of the models analyzed.
1. Introduction
Predictive microbiology exploits mathematical models to describe bacterial dynamics in different products of food industry. The models take into account the role played by environmental variables, whose variations can affect, sometimes dramatically, the quality and safety of the food products. Predictive models belong to three different types: primary, secondary and tertiary [1]. The first class of models allows to obtain the time evolution of microbial populations. The models belonging to the second type give information on the relationship between parameters which appear in primary models, and physical and chemical variables such as T (temperature), pH (hydrogen ion concentration), and aw (activity water). The third class of models puts together the primary and secondary ones, letting the evolution of physical and chemical variables be considered, when analysis and prediction of the concentration of spoiling or pathogen bacteria of the food are performed [2].
A well-known method for the theoretical analysis of microbial growth exploits generalized Lotka-Volterra (LV) equations [3,4], which allow to describe the dynamics of two competing bacterial populations in different food products. A prototype model structure for mixed microbial populations in food products was proposed by Dens et al. [5]. A similar approach indicated that experimental data for Escherichia coli O157:H7 in ground beef could be well reproduced by an interspecific competition model for two bacterial populations. In the same work the effects of random fluctuations were considered using growth rates whose values are obtained from uniform random distributions [6]. An extensive review on predictive microbiology showed that in general a stochastic approach provides predictions which exclude the worst-case scenario [7]. In particular, stochastic terms were introduced to reproduce and predict bacterial dynamics, exploiting an approach based on primary and secondary growth models [8]. Moreover other authors presented a stochastic model which interprets the bacterial growth as the average evolution of many cells: measured values of the growth rate for many different cells allow to describe the theoretical growth rate used in the model as a stochastic variable with a corresponding probability distribution [9-11]. Finally, a stochastic ecological model, based on the Verhulst logistic differential equation, was devised [12].
The previous models however do not include explicitly stochastic terms in the equations of motion of the systems analyzed. In other words, the models used in predictive microbiology are not usually based on stochastic differential equations.
Aim of this paper is to analyze how predictions for bacterial dynamics are affected by the three following features: 1) use of differential equations (dynamical approach); 2) presence of interactions among bacterial populations; 3) introduction of stochastic terms, i.e. noise sources, which mimic the random fluctuations of environmental variables. In the following we present a general approach to model the bacterial dynamics in food products, taking into account three different situations of microbial growth in real food systems.
2. The Model
The theoretical approach is based on generalized LotkaVolterra (LV) equations, in which the bacterial growth rates depend on environmental variables, such as temperature, pH, and activity water, whose randomly fluctuating behaviour can be modeled by inserting terms of additive white Gaussian noise.
2.1. Bacterial Growth in Fish Products
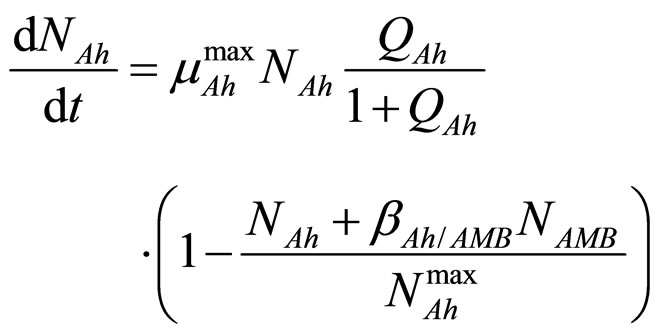
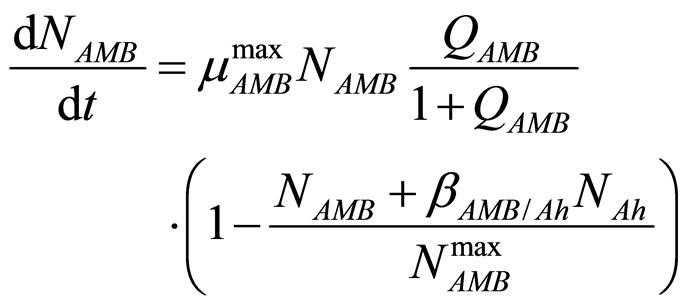
In this section we consider an interspecific competition model to describe the dynamics, during the refrigerated storage, of two bacterial populations, i.e. Aeromonas hydrophila and the aerobic mesophilic bacteria (AMB), located on gilthead seabream (Sparus aurata) surfaces. Aeromonas hydrophila is a foodborne disease agent bacterium, present in water and many food products of animal origin, such as seafood, shellfish, milk, meat-based products and in general raw foods [13-18], while AMB represents the count of total microflora normally distributed on fish surfaces. The dynamics of the two populations can be described by the following primary model based on generalized LV equations
 (1)
(1)
 (2)
(2)
 (3)
(3)
 (4)
(4)
for the dynamics of the two populations. In Equations (1)-(4)  and
and  are, respectively, the population concentrations of A. hydrophila and AMB at time t,
  and
and  are the maximum specific growth rates of the two bacterial populations,
  and
and  are the theoretical maximum population concentrations under monospecific growth conditions,
  and
and  are the interspecific competition parameters of AMB on A. hydrophila and vice-versa, respectively;
  and
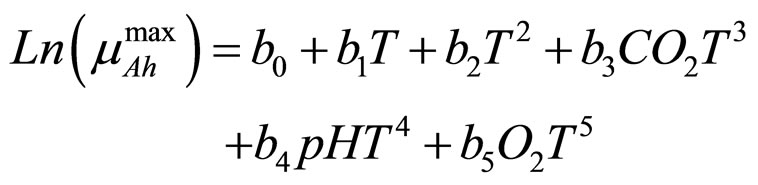
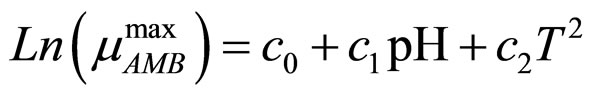
and  represent the physiological state of the two bacterial populations. Moreover, the behaviour of the growth rates is given by the following secondary model
 (5)
(5)
 (6)
(6)
where  and
and  indicate the concentrations of oxygen and carbon dioxide, respectively. The values of the parameters in Equations (5) and (6) are
 ,
,  ,
,  ,
,  ,
,  ,
,  , and
, and ,
,  ,
, .
.
The whole dynamics of the system is described by a tertiary model, which combines the previous primary model for the time evolution of the microbial populations [19] with the secondary model [20,21] connecting the growth rates of A. hydrophila and AMB with physical and chemical variables.
Equations (5), (6) are solved by numerical integration, setting ,
,  ,
,  and letting the temperature vary. The growth rate curves are shown in Figure 1. The temperature values used in the model were obtained experimentally and are also shown in Figure 1 (gray line).
In the figure it is possible to observe that the theoretical results both for A. hydrophila (dashed black line) and AMB (full black line) are in a very good agreement with the corresponding experimental data (black squares for A. hydrophila, black circles for AMB). Specifically, the theoretical values are within the experimental errors (vertical bars) for both populations. Conversely, previous results showed a much worse agreement between experimental and theoretical growth curves, when no interaction terms between the two bacterial populations are
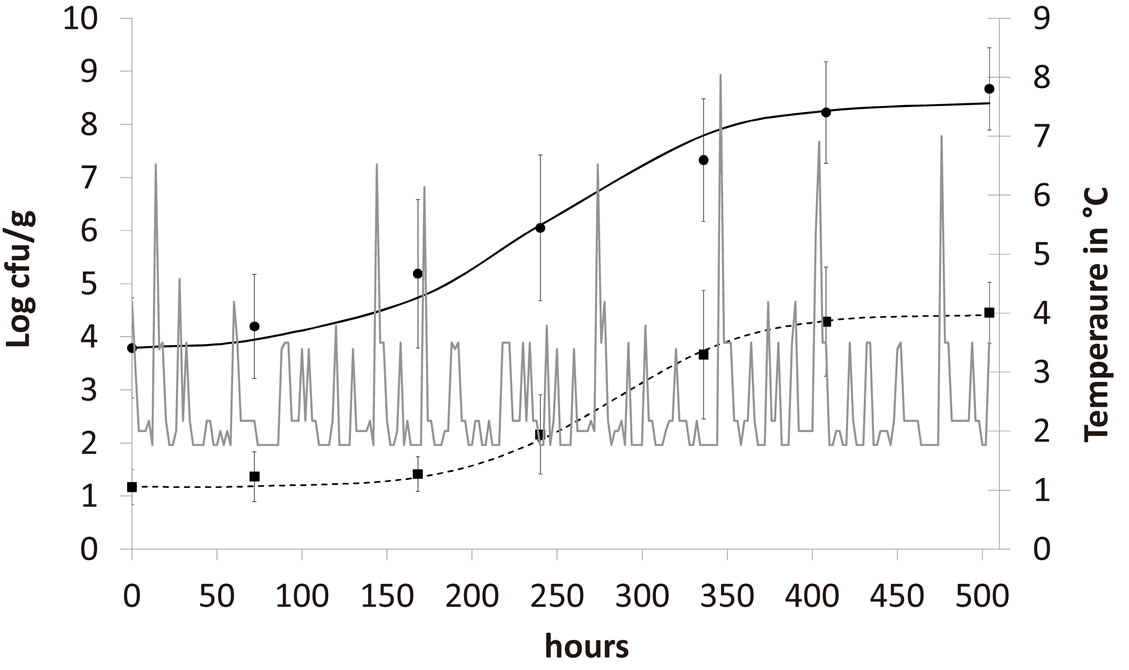
Figure 1. Theoretical growth curves for A. hydrophila (dashed black line) and AMB (full black line), and corresponding experimental data (black squares for A. hydrophila, black circles for AMB). Vertical bars indicate the experimental errors. The fluctuating temperature values (grey full line) used in the model were measured during the experimental analysis.
included in the model [21]. This confirms the presence of interspecific interaction and the critical role played by the randomly fluctuating temperature in the dynamics of A. hydrophila and AMB.
2.2. Bacterial Growth in Meat Products: Two Interacting Populations
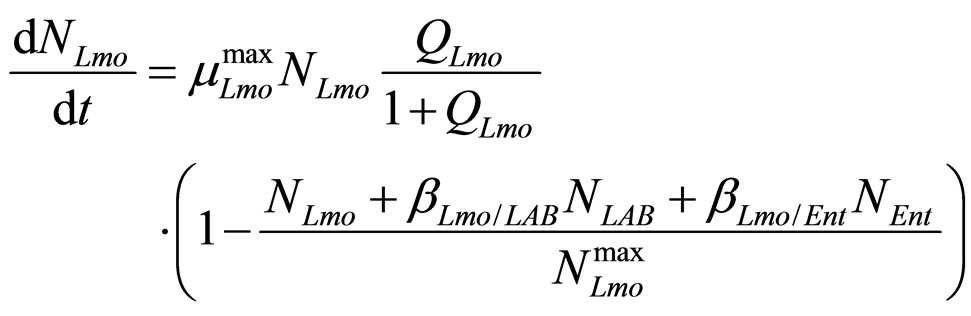
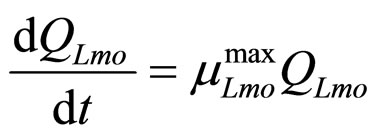
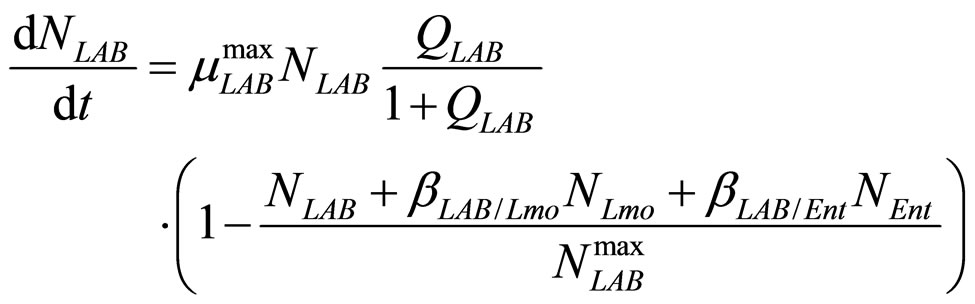
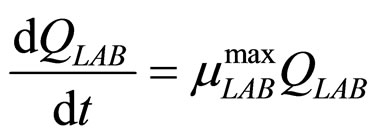
In this section we introduce a model for the dynamics of two competing bacterial populations, Listeria monocytogenes and lactic acid bacteria (LAB), present in a meat product, i.e. a traditional Sicilian salami (Salame S. Angelo PGI (Protected Geographical Indication)) very important from the point of view of the Italian food industry. Specifically, L. monocytogenes is a microbial agent of foodborne disease, while LAB constitute the normal bacterial flora of the substrate. The primary model is based on the following system of generalized LotkaVolterra equations [5,6]
 (7)
(7)
 (8)
(8)
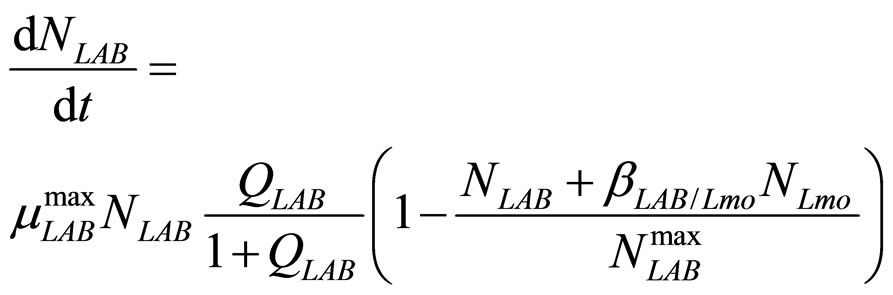 (9)
(9)
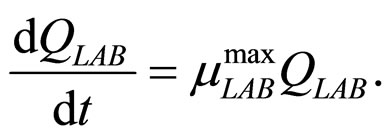 (10)
(10)
Here,  and
and  are the population concentrations of L. monocytogenes and LAB, respectively;
  and
and  represent the maximum specific growth rates of the two populations, and
  and
and  are the theoretical maximum population concentrations. The coefficients
  and
and  are the interspecific competition parameters of LAB on L. monocytogenes and vice-versa.
  and
and  represent the physiological state of the two populations.
To solve Equations (7)-(10) it is necessary to set how  and
and  vary. This can be done by introducing for the maximum growth rates the following secondary model
 (11)
(11)
 (12)
(12)
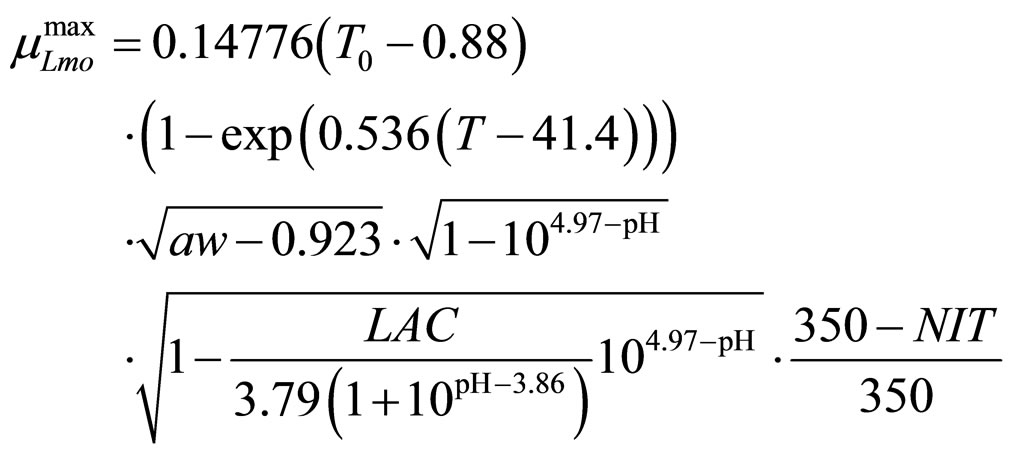
obtained by a phenomenological approach (see Ref. [22] and references therein). Here, NIT is nitrite concentration in  and LAC is lactic acid concentration in
 . The values 0.88, 41.4, 0.923, 4.97, and 350 represent
  (˚C),
(˚C), (˚C),
(˚C), ,
, and
and , respectivley. Temperature, pH, and activity water are described as stochastic processes. In particular, their dynamics is given by two different contributions: 1) a linearly decreasing deterministic behaviour within a time interval of 168 h, according to the procedure followed in the production process (a fermentation period of 7 days); 2) terms of additive white Gaussian noise, which account for the presence of random fluctuations due to environmental perturbations. By this way the following system of three stochastic differential equations is obtained [22]
 (13)
(13)
 (14)
(14)
 (15)
(15)
where , with
 , are statistically independent Gaussian white noises with the following properties
 (16)
(16)
 (17)
(17)
and  are the noise intensities.
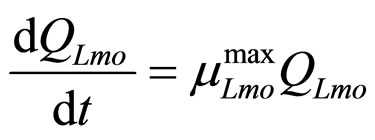
As a first step, Equations (7)-(15) have been solved numerically within the Ito scheme, performing 1000 realizations and obtaining the mean growth curves in absence of noise ( ,
, ,
, ). The initial concentrations of the two populations, however, have been set randomly. Specifically, in each realization the initial values of
  and
and  have been extracted from two Gaussian distributions, whose mean values and standard deviations were equal to those of the distributions experimentally observed [23]. The results, obtained for suitable values of the interaction parameters (
 ,
, ), are shown in Figure 2. Here we note that the theoretical curves of L. monocytogenes (dashed black line) and LAB (full black line) fit very well the corresponding experimental data (black squares for L. monocytogenes, black circles for LAB). This indicates that the interaction, present in the model, between the two bacterial populations reproduces a feature of the real biological system [24-26]. In particular, we note that the condition
  implies the absence of any direct effects of L. monocytogenes on the dynamics of LAB. On the other side, the limiting effect of LAB on the growth of L. monocytogenes, obtained for a suitable positive value of the other interaction parameter (
 ), determines conditions for the coexistence of the two populations, according to empirical data [23,27,28].
As a second step, we analyzed the role of the random fluctuations on the dynamics of the system. For this purpose, we solved again Equations (7)-(15) both in deterministic regime and for three different values of the noise intensities ,
,  and
and , obtaining the theoretical probability distributions of L. monocytogenes concentration at the end of the fermentation period (168 hours).
Predicted results, together with observed data, are shown in Figure 3. Here, the histograms indicate that the best agreement between the theoretical distributions (white bars) and experimental one (black bars) is observed when the bacterial dynamics is obtained for values of the noise intensities different from zero (stochastic dynamics), and in particular for ,
,  ,
,  (see panel c). This result accords with the complex nature of the system analyzed, in which random fluctuations of environmental variables such as temperature, pH and activity water, are present.
2.3. Bacterial Growth in Meat Products: Three Interacting Populations
In the previous section we applied an interspecific competition model, based on Lotka-Volterra equations, to describe the time behaviour of L. monocytogenes and LAB during the fermentation step of S. Angelo salami. The aim of this section is to extend this approach, taking into account a third bacterial population, that is Enterobacteria, whose role is critical for the safety and quality of several meat products, since this bacterial family contains many foodborne human disease agents as well as spoiling bacteria for salami. In particular, we analyze the effects due to the interaction among the three populations, in view of reproducing the biological competition and better simulating the real bacterial growth. The competition among different bacterial populations can be explained recalling that some species determine substrate modifications, which can favour or inhibit the growth of other populations. These effects can be modeled by interaction terms, each one reproducing the influence of a specific population on the dynamics of another bacterial group. To stress the importance of the interspecific competition in modeling bacterial dynamics, we consider temperature, pH and aw as deterministic variables, subject to a decreasing time behaviour, without any random
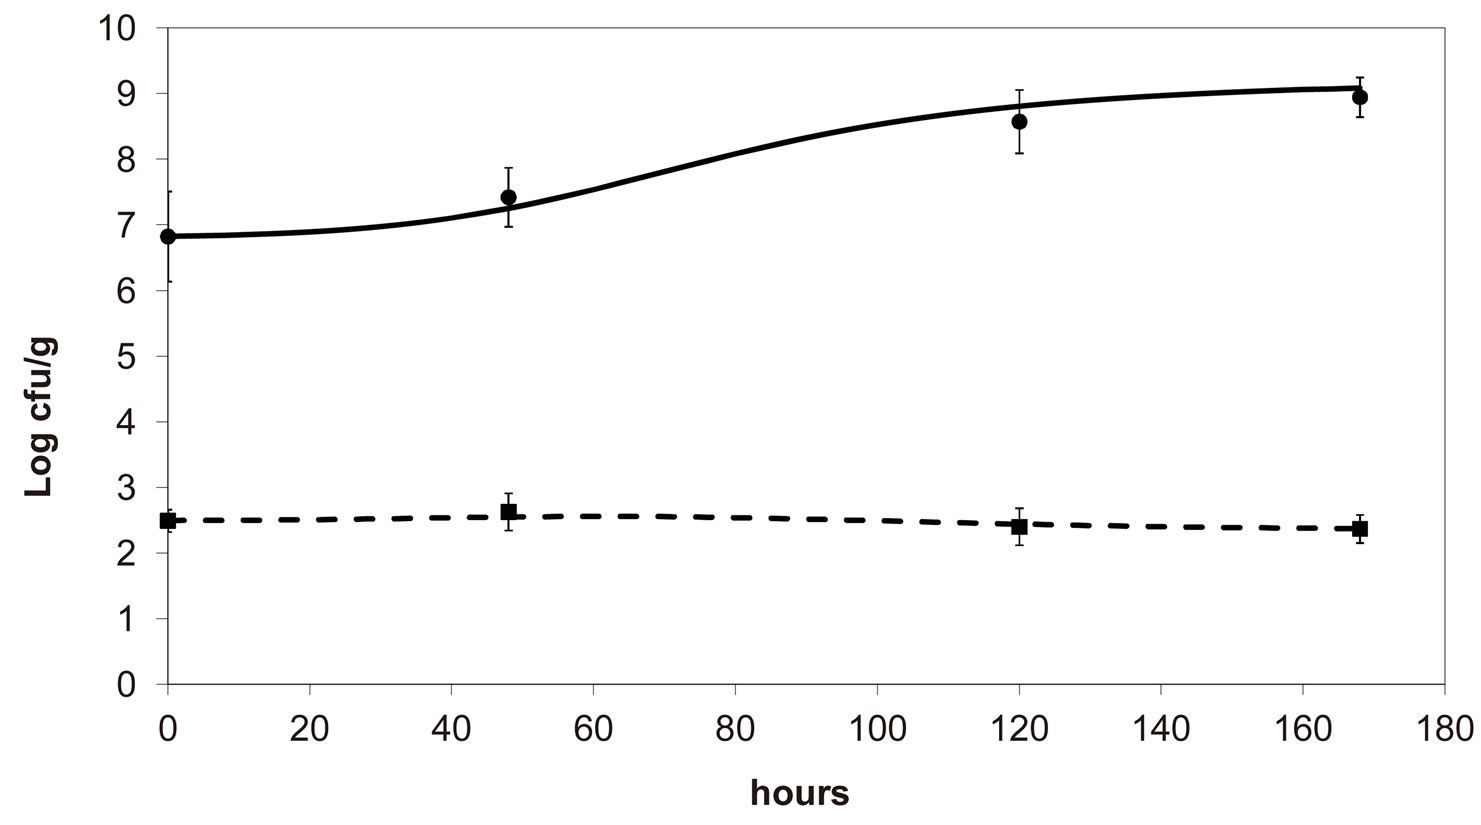
Figure 2. Theoretical growth curves for L. monocytogenes (dashed black line) and LAB (full black line), and corresponding experimental data (black squares for L. monocytogenes, black circles for LAB). Vertical bars indicate the experimental errors.
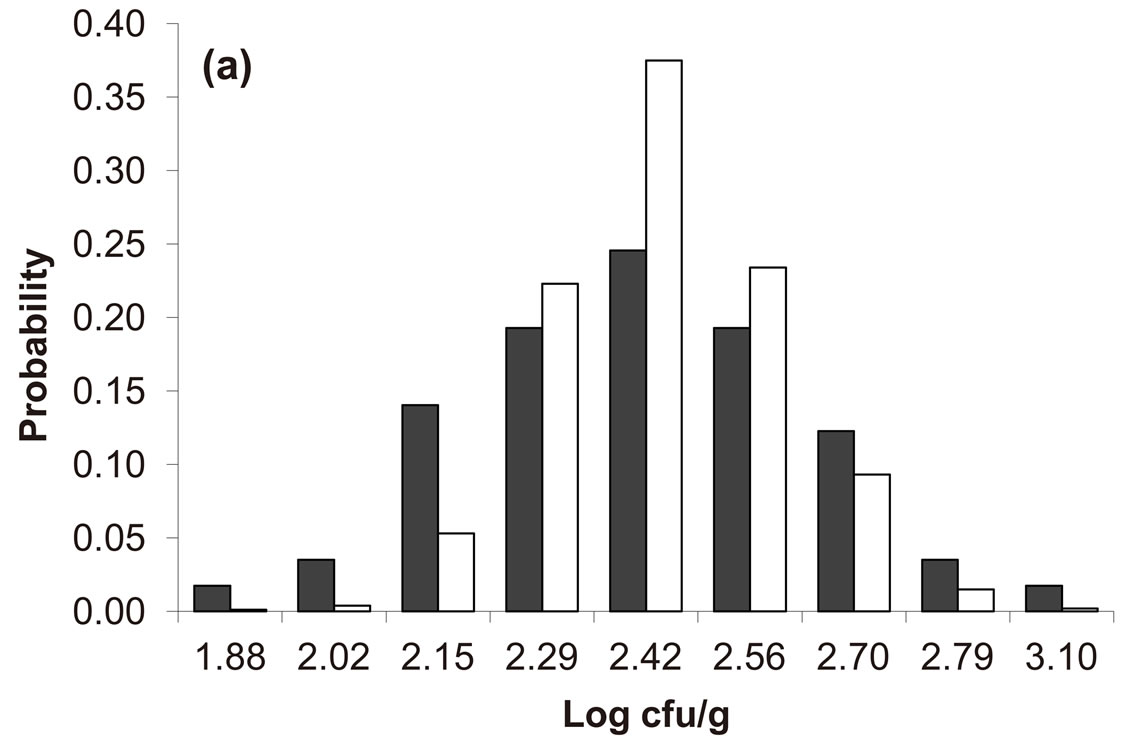
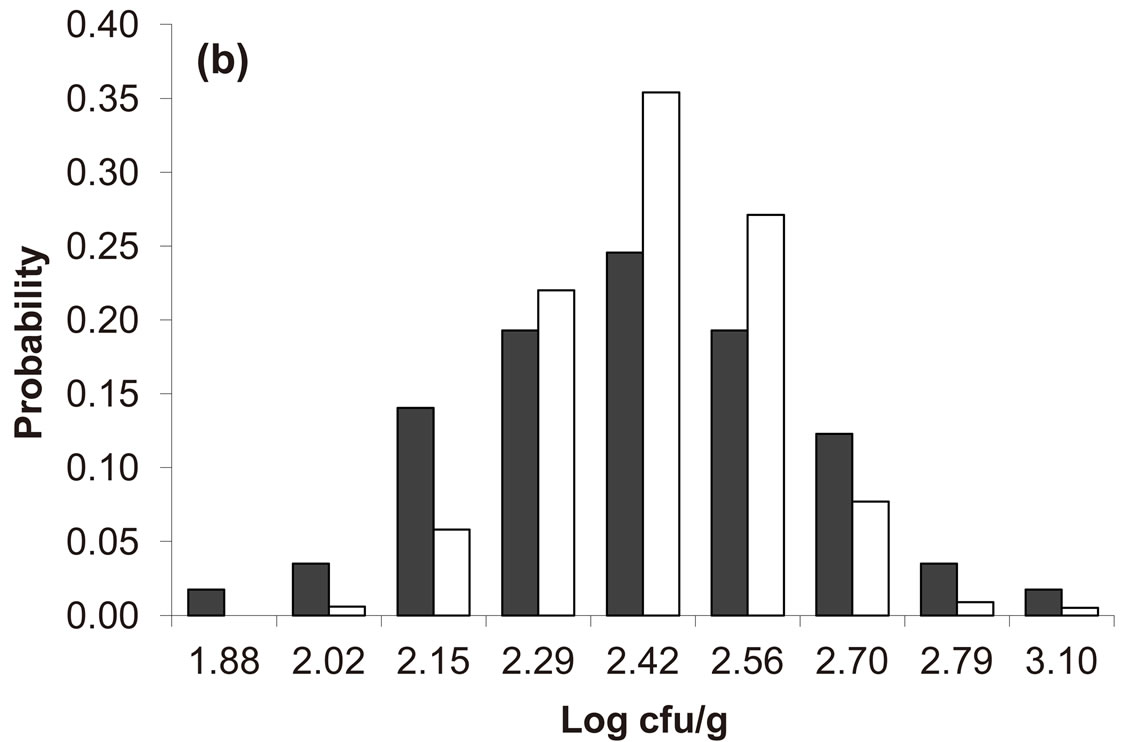
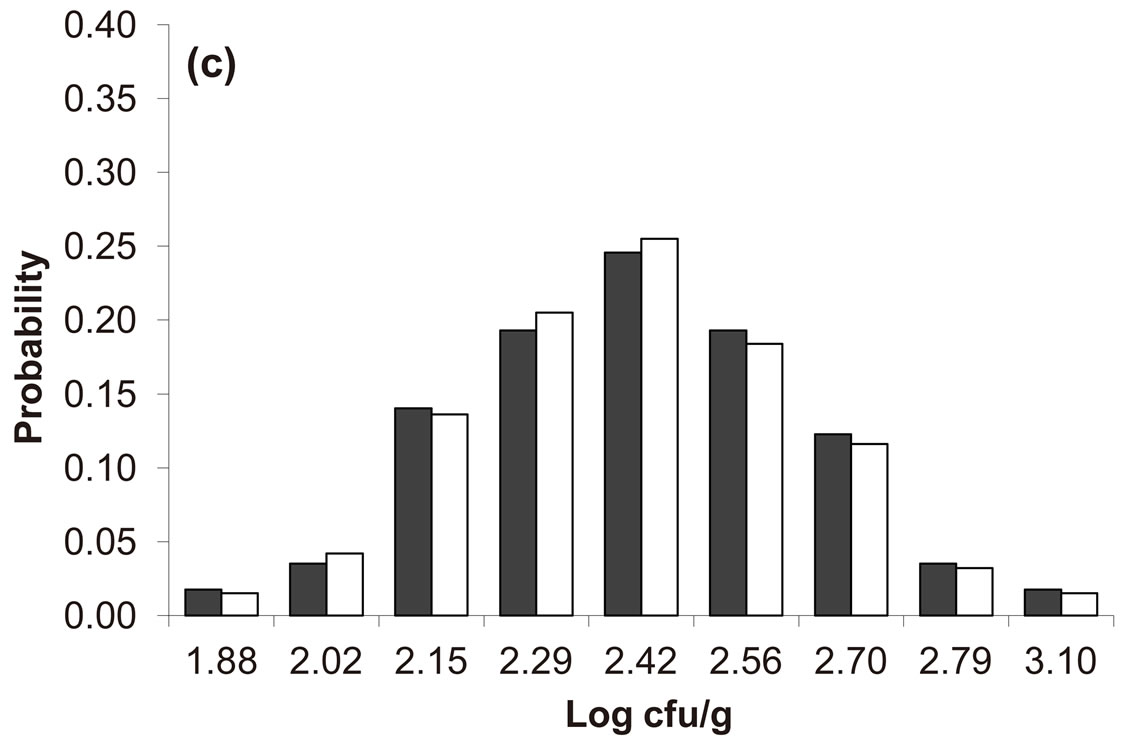
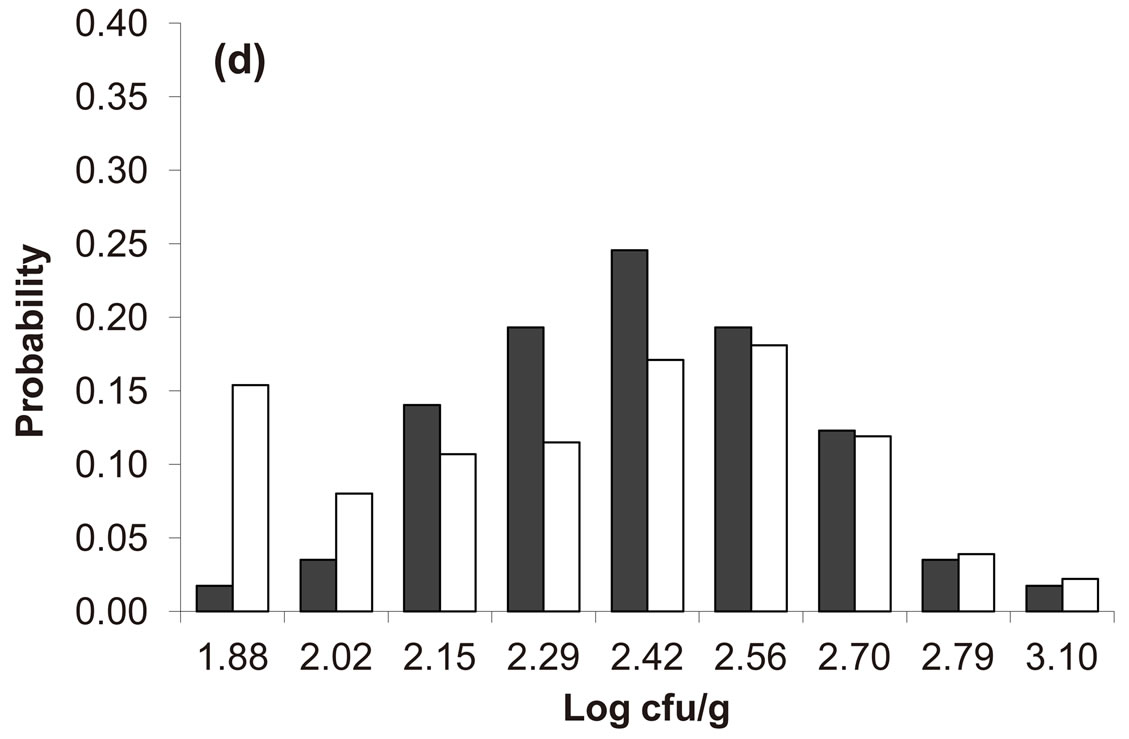
Figure 3. Theoretical distributions (white bars) of the L. monocytogenes concentration at 168 hours for (a) ,
,  ,
,  , (b)
, (b) ,
,  ,
,  , (c)
, (c) ,
,  ,
,  , (d)
, (d) ,
,  ,
, . Black bars represent the corresponding experimental distribution.
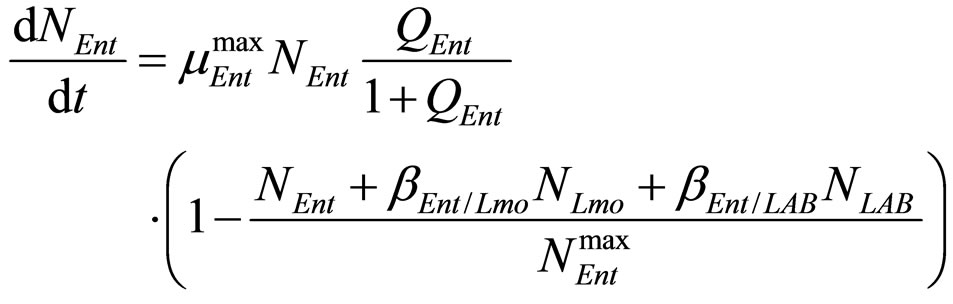
fluctuations. Specifically, the model is obtained starting from Equations (7)-(12) and introducing two additional equations, one for  (Enterobacteria concentration), the other for
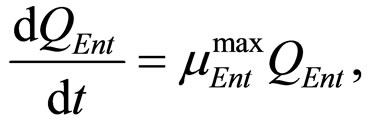
  (physiological state of Enterobacteria). By this way, we obtain the primary model for the three populations [29]
 (18)
(18)
 (19)
(19)
 (20)
(20)
 (21)
(21)
 (22)
(22)
 (23)
(23)
where ,
,  and
and , referring to Enterobacteria, are bacterial concentration, maximum specific growth rate and theoretical maximum population concentration, respectively. The coefficients
  and
and  are the interspecific competition parameters of Enterobacteria on L. monocytogenes and vice-versa. Analogously
  and
and  are the interspecific competition parameters of Enterobacteria on LAB and vice-versa. Finally,
  represents the physiological state of Enterobacteria. All other variables and parameters are the same as defined is the previous section.
The secondary models for  and
and  are the same as those used in the previous section (see Equations (11), (12)). The expression for
 , here not given, is very similar to that for
  (see Equation (6) in Section 2.1) and was devised by using 107 experimental growth curves (see Ref. [29] and references therein). The initial values were chosen according to values measured at time
  for the three bacterial concentrations. The environmental conditions refer to the fermentation period (168 hours) with temperature decreasing from 20˚C to 12˚C. Changes in other environmental variables followed the behaviour measured in experimental observations. Specifically, pH, aw and lactic acid concentrations were characterized by a decreasing behaviour from 5.8 to 5.6, from 0.972 to 0.946 and from 166 mM to 200 mM, respectively. On the same basis, the sodium nitrite concentration was set to the constant value of 90 ppm. The growth curves for the three populations were obtained both in no-interaction regime (
 ,
,  ,
,  ,
,  ,
,  ,
, ), and in the presence of the following interaction effects: action of LAB and Enterobacteria on L. monocytogenes and action of LAB on Enterobacteria (
 ,
,  ,
,  ,
,  ,
,  ,
, ). The results, shown in Figure 4, indicate that neglecting the interspecific bacterial interactions causes the theoretical curves to overestimate the concentrations of L. monocytogenes and Enterobacteria (see panel a), which play a crucial role from the point of view of the human health. Conversely, the presence of interspecific bacterial interactions allow to obtain a very good agreement between expected and observed behaviour (see panel b), providing an improved model in view of possible applications within the production processes.
3. Conclusion
Predictive microbiology is an interesting tool which allows to describe microbial evolution in food products as a function of environmental conditions, especially when models take into account bacterial interactions and random fluctuations of chemical and physical variables. In this perspective, the results presented here can be useful to better understand the role of the microbial interaction and environmental noise. Our findings, obtained in three different systems, indicate that interspecific bacterial interaction and environmental random fluctuations are essential for a more precise and reliable prediction of the bacterial dynamics. In particular we note that the time evolution of the microbial concentration both in fish and meat products shows the same characteristics: a slow increase is present during the first part (lag-time) of the dynamics; afterwards a rapid increase (log-phase) of the bacterial concentration takes place until the curve reaches a saturation value (stationary phase), which corresponds to the maximum bacterial concentration measured. In the case of L. monocytogenes behavior in meat products, the log and stationary phases are not evident since the
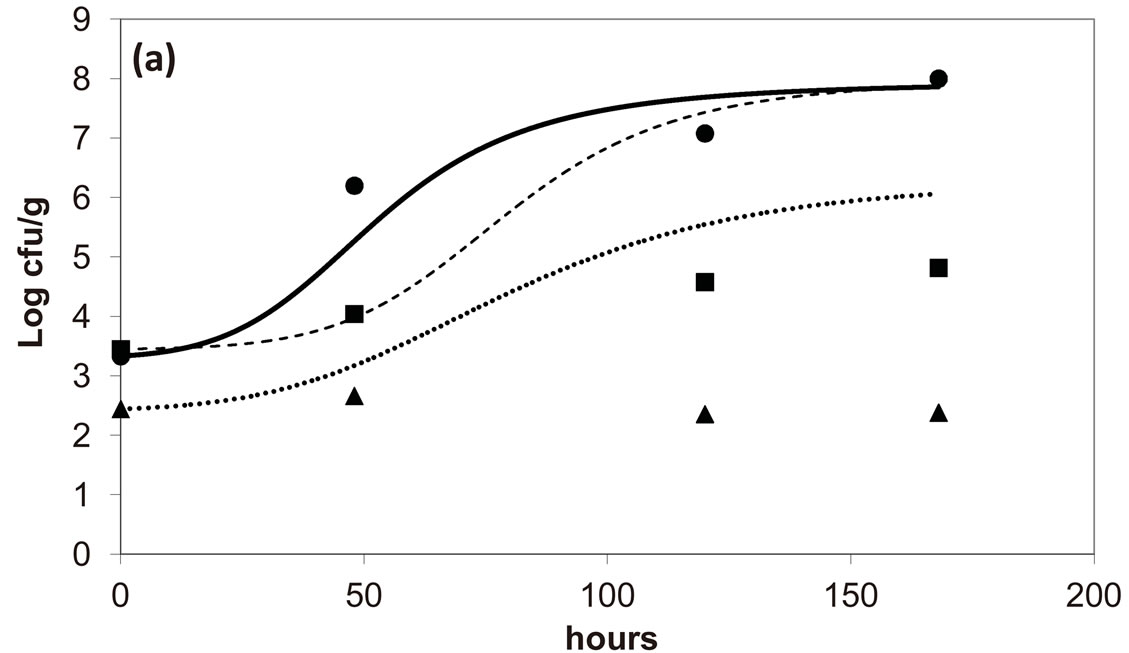
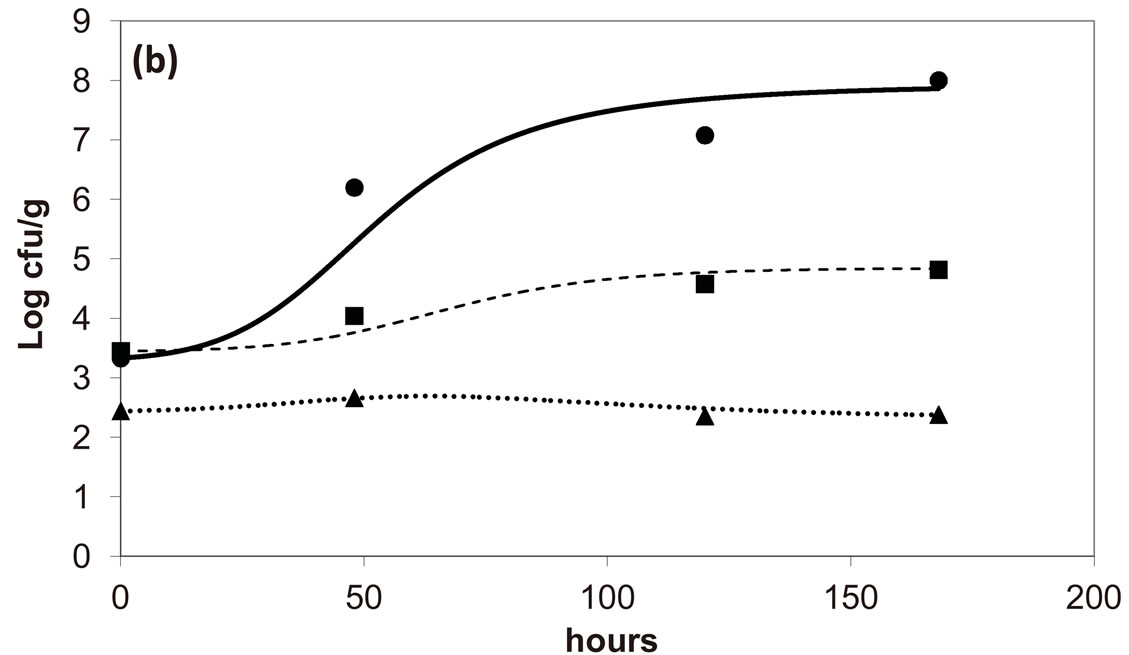
Figure 4. Theoretical growth curves for L. monocytogenes (dotted black line), Enterobacteria (dashed black line), LAB (full black line), obtained (a) in absence of interspecific interactions (
 ,
,  ,
, ) and (b) considering interactions of LAB and Enterobacteria on L. monocytogenes (
 ,
, ) as well as of LAB on Enterobacteria (
 ). The other interaction parameters are set to zero. Corresponding experimental data are also shown (black triangles for L. monocytogenes, black squares for Enterobacteria, black circles for LAB).
bacterial growth is affected by adverse environmental conditions and strong LAB interaction. Finally we note that our study could play a key role in view of incorporating stochastic microbial predictive models into a risk assessment process, contributing to improve the precision of the expected concentrations of a foodborne disease agent. This aspect agrees to the new European approach to food safety assessment and management.
4. Acknowledgements
Authors acknowledge the financial support by Ministero dell’Istruzione, dell’Università e della Ricerca of Italian Government.
REFERENCES
- R. C. Whiting and R. L. Buchanan, Food Microbiology, Vol. 10, 1993, pp. 175-177. doi:10.1006/fmic.1993.1034
- P. Dalgaard, P. Buch and S. Silberg, International Journal of Food Microbiology, Vol. 73, 2002, pp. 343-349. doi:10.1016/S0168-1605(01)00670-5
- A. J. Lotka, Proceedings of the National Academy of Science of USA, Vol. 6, 1920, pp. 410-415. doi:10.1073/pnas.6.7.410
- V. Volterra, Nature, Vol. 118, 1926, pp. 558-560. doi:10.1038/118558a0
- E. J. Dens, K. M. Vereecken and J. F. Van Impe, Journal of Theoretical Biology, Vol. 201, 1999, pp. 159-170. doi:10.1006/jtbi.1999.1021
- M. Powell, W. Schlosserb and E. Ebel, International Journal of Food Microbiology, Vol. 90, 2004, pp. 171-179. doi:10.1016/S0168-1605(03)00106-5
- T. A. McMeekin, J. Olley, D. A. Ratkowsky and T. Ross, International Journal of Food Microbiology, Vol. 73, 2002, pp. 395-407. doi:10.1016/S0168-1605(01)00663-8
- M. J. Nauta, International Journal of Food Microbiology, Vol. 57, 2000, pp. 9-18. doi:10.1016/S0168-1605(00)00225-7
- J. Baranyi, Journal of Theoretical Biology, Vol. 192, 1998, pp. 403-408. doi:10.1006/jtbi.1998.0673
- J. Baranyi and C. Pin, Journal of Theoretical Biology, Vol. 210, 2001, pp. 327-336. doi:10.1006/jtbi.2001.2312
- I. A. M. Swinnen, K. Bernaerts, E. J. J. Dens, A. H. Geeraerd and J. F. Van Impe, International Journal of Food Microbiology, Vol. 94, No. 2, 2004, pp. 137-159. doi:10.1016/j.ijfoodmicro.2004.01.006
- J. M. Ponciano, F. P. J. Vandecasteele, T. F. Hess, L. J. Forney, R. L. Crawford and P. Joyce, Applied Environmental Microbiology, Vol. 71, 2005, pp. 2355-2364. doi:10.1128/AEM.71.5.2355-2364.2005
- R. L. Buchanan and S. A. Palumbo, Journal of Food Safety, Vol. 7, 1985, pp. 15-29. doi:10.1111/j.1745-4565.1985.tb00490.x
- H. Daskalov, Food Control, Vol. 17, 2006, pp. 474-483. doi:10.1016/j.foodcont.2005.02.009
- C. R. Fricker and S. Tompsen, International Journal of Food Microbiology, Vol. 9, 1989, pp. 17-23. doi:10.1016/0168-1605(89)90033-0
- P. Gobat and T. Jemmi, International Journal of Food Microbiology, Vol. 20, 1993, pp. 117-120. doi:10.1016/0168-1605(93)90099-3
- K. Krovacek, A. Faris, S. B. Badola, M. Prererz, T. Lindberg and I. Mansson, Food Microbiology, Vol. 9, 1992, pp. 29-36. doi:10.1016/0740-0020(92)80059-D
- Y. Nishikawa and T. Kishi, Epidemiology and Infection, Vol. 101, 1988, pp. 213-223. doi:10.1017/S0950268800054121
- J. Baranyi and T. A. Roberts, International Journal of Food Microbiology, Vol. 23, 1994, 277-294. doi:10.1016/0168-1605(94)90157-0
- C. Pin, R. Velasco de Diego, S. George, G. D. Garca de Fernando and J. Baranyi, Applied Environmental Microbiology, Vol. 70, 2004, pp. 3925-3932. doi:10.1128/AEM.70.7.3925-3932.2004
- A. Giuffrida, G. Ziino, D. Valenti, G. Donato and A. Panebianco, Archiv für Lebensmittelhygiene, Vol. 58, 2007, pp. 136-141.
- A. Giuffrida, D. Valenti, G. Ziino, B. Spagnolo and A. Panebianco, European Food Research and Technology, Vol. 228, 2009, pp. 767-775. doi:10.1007/s00217-008-0988-6
- A. Giuffrida, G. Ziino, F. Rago, F. Giarratana, A. Taviano and A. Panebianco, “Behaviour of Lysteria monocytogenes during the Seasoning of a Typical Sicilian Dried Salami,” Proceedings of INTRADFOOD 2005 (Innovation in Traditional Food), 25-28 October 2005, Valencia, pp. 537-540.
- D. Valenti, A. Fiasconaro and B. Spagnolo, Acta Physica Polonica B, Vol. 35, 2004, pp. 1481-1489.
- D. Valenti, L. Tranchina, M. Brai, A. Caruso, C. Cosentino and B. Spagnolo, Ecological Modelling, Vol. 213, 2008, pp. 449-462. doi:10.1016/j.ecolmodel.2008.01.023
- A. Fiasconaro, D. Valenti and B. Spagnolo, Acta Physica Polonica B, Vol. 35, 2004, pp. 1491-1500.
- M. Campanini, I. Pedrazzoni, S. Barbuti and P. Baldini, International Journal of Food Microbiology, Vol. 20, 1993, pp. 169-175. doi:10.1016/0168-1605(93)90109-T
- M. Trüssel and T. Jemmi, Fleischwirtschaft, Vol. 69, 1989, pp. 1586-1592.
- A. Giuffrida, D. Valenti, G. Ziino and A. Panebianco, Veterinary Research Communications, Vol. 33, 2009, S229-S232. doi:10.1007/s11259-009-9293-5