Applied Mathematics
Vol.5 No.13(2014), Article ID:47623,9 pages DOI:10.4236/am.2014.513181
Fourier and Wavelet Spectral Analysis of EMG Signals in 1-km Cycling Time-Trial
Marcelo Bigliassi1, Paulo Rogério Scalassara2, Thiago Ferreira Dias Kanthack1, Taufik Abrão3, Antonio Carlos de Moraes4, Leandro Ricardo Altimari1
1Group of Study and Research in Neuromuscular System and Exercise, CEFE-State University of Londrina, Londrina, Brazil
2Department of Electrical Engineering, Federal Technological University of Paraná, Cornélio Procópio, Brazil
3Department of Electrical Engineering, CTU-State University of Londrina, Londrina, Brazil
4Laboratory of Electromyography Studies, FEF-State University of Campinas, Campinas, Brazil
Email: bigliassi@live.com, prscalassara@utfpr.edu.br, thiago_fdk@hotmail.com, taufik.abrao@gmail.com, acmoraes@fef.unicamp.br, altimari@uel.br
Copyright © 2014 by authors and Scientific Research Publishing Inc.
This work is licensed under the Creative Commons Attribution International License (CC BY).
http://creativecommons.org/licenses/by/4.0/


Received 18 April 2014; revised 21 May 2014; accepted 4 June 2014
ABSTRACT
Frequency domain analyses in electromyographic (EMG) signals are frequently applied to assess muscle fatigue and similar variables. Moreover, Fourier-based approaches are typically used for investigating these procedures. Nonetheless, Fourier analysis assumes the signal as stationary which is unlikely during dynamic contractions. As an alternative method, wavelet-based treatments do not assume this pattern and may be considered as more appropriate for joint time-frequency domain analysis. Based on the previous statements, the purpose of the present study was to compare the application of Short-Time Fourier Transform (STFT) and Continuous Wavelet Transform (CWT) to assess muscle fatigue in dynamic exercise of a 1-km of cycling (time-trial condition). The results of this study indicated that CWT and STFT analyses have provided similar fatigue estimates (slope) (p > 0.05). However, CWT application represents lesser dispersion (
Keywords:Exercise, Dynamic Exercise, Wavelet Analysis, Fourier Analysis

1. Introduction
The use of surface electromyography (EMG) has been applied as a valuable and non-invasive method to study the human movement and its neurophysiological mechanisms of fatigue. The tool works through the electric activity in the excitable membranes of myofibrils, which comprise the motor units of the muscular system determining the output of muscle activation [1] .
Fatigue can be defined as a decrease on the capacity of muscle to produce force [2] [3] . EMG technique is applied to measure the excitability of the muscle fibers and signal speed. This provides meaningful information regarding fatigue process [4] [5] . EMG cues may be analyzed in two different domains: time and frequency. At this paper, we are going to focus on frequency perspective. Frequency domain provides variables such as median frequency (MDF), variance, and MDF slope. The MDF slope is understood as the decrease rate in median frequency [1] [6] . It is important to highlight that a decrease in median frequency is categorized as the onset of muscle fatigue process [6] .
When the signal is presented in the frequency domain, a variety of problems might appear, the spectral decomposition of muscle generally uses mathematical algorithms such as the Fast Fourier Transform (FFT) [6] . But difficulties occur in the signal process due to the variations in muscle force, length and contraction speed, creating barriers for applying this strategy. Thus, it would be important to use this technique in stationary signals [7] [8] . Taking the limitations of the FFT into account, the wavelet transform (WT), in its discrete or continuous versions (DWT and CWT, respectively), has been suggested as an alternative way of decomposing the EMG signal in this type of contraction, since it presents more accurate and precise measurements [9] [10] . This technique consists in mapping the signal in frequency and time from a series of base functions that can be designed depending of the analysis needs and are built based on a “mother” wavelet, forming an orthogonal signals basis [11] .
The suitable application of short-time Fourier Transform is much less restrictive than Fourier transform since the former only needs local stationarity, i.e., stationarity within its running window. Hence the spectral analysis over dynamic exercises signals will be more effective using the Short-Time Fourier Transform (STFT) than FFT if a representative number of samples (this number defines the granularity of frequencies scale in frequency domain) could be obtained into each running time-domain windows such as the signal samples in each running window results approximately stationary.
Some studies showed that STFT and CWT may yield comparable results regarding muscle fatigue in highly standardized protocols, both in static or dynamic exercise [7] [12] -[21] . However, the comparisons between methods of EMG signal analysis, especially in dynamic exercise without total standardization of the task performed are still needed. Moreover, few studies are looking for those results in real conditions as time trial tasks involving a total time work.
Thus, the purpose of this study was to compare STFT and CWT analysis in assessing muscle fatigue in dynamic exercise, in 1-km cycling time-trial (approximately 8 min of analysis).
2. Experimental Procedures
2.1. Subjects
Ten male cyclists (27 ± 8 years, 71 ± 10 kg, 173 ± 6 cm) participated in this study. All participants have practiced cycling for 7 ± 4 years with an average of 5.0 ± 1.0 training sessions per week, and also declared to have an average weekly training volume of 345 ± 92 km. This study was approved by the Research and Ethics Committee of the State University of Londrina.
2.2. 1-km Cycling Time-Trial
The 1-km time-trial was performed in a cyclesimulator (Velotron CS 2008™, RacerMate®, USA). The subjects were required to complete the test as fast as they could. During the time-trial, the volunteers received strong verbal encouragement to motivate and ensure that they reached their maximum peak performance.
2.3. Collection and Processing EMG Signals
The EMG signals were recorded according to the guidelines of the International Society of Electrophysiology and Kinesiology, using a 8-channel electromyography (TeleMyo 2400 TG2, NORAXON Inc. USA) with sampling rate of 2000 Hz. The raw EMG signals were filtered using a band-pass filter of 20 Hz and 500 Hz. The bipolar electrodes (TeleMyo 2400, NORAXON Inc. USA), were placed in the quadriceps muscles (QD): vastus lateralis (VL), vastus medialis (VM) and rectus femoris (RF) according to the SENIAM orientations [17] , with a common-mode rejection ratio ≤95 dB.
For the spectral analysis, the values of MDF were obtained applying the STFT and CWT (Daubechies: db4) techniques. Short term Fourier transform is obtained applying recursively (over 1.0 sec time-windowed signal) a 1024-point fft (Fast Fourier Transform) with rectangular processing window algorithm, available at MatLab® v.7.7. While the continuous wavelet transform is performed applying the CWT algorithm (overall the EMG signal, but analyzing the same 1.0 sec windows), available at Wavelet Toolbox™ of MatLab® v.7.7.
Using these techniques, the following parameters were obtained: MDF, Variance , and Slope of MDF during the exercise. The Slope of MDF was determined by linear regression between the MDF and the duration of the exercise.
The MDF is the value of frequency that divides the EMG signal spectrum into two parts with equal energy, as demonstrated by Equation (1).
 (1)
(1)
where  is the upper cutoff frequency of the pass-band filter,
  is the normalized power spectral density (PSD) of the EMG signal, given by Equation (2).
 (2)
(2)
where  is the time-window (
 seconds) Fourier transform version of the EMG signal
 .
.
As an example, both techniques were applied to a 10 sec EMG signal (Figure 1). For the STFT analysis, the signal is decomposed using a 1 sec time-window. The first window signal is shown in Figure 2 and its Fourier Transform in Figure 3. The latter already depicts the MDF: the straight line with frequency , obtained using Equation (1).
For the whole 10 sec signal, the STFT analysis results in nine MDF values (Figure 4), with average of 86.10 Hz, variance of 30.99 Hz2, and slope of 0.51 Hz/sec.
For the CWT analysis, the whole 10 sec signal is used to obtain the wavelet coefficients using 128 scales, Figure 5. The coefficients are related to the position of the EMG bursts. Therefore, in order to obtain the MDF values, we use the same windowing of the STFT method, but applied to the coefficients. The portion of the coefficients used for the first window is shown in Figure 6.
The contour of this portion of the CWT coefficients is used to estimate the envelope of the power spectrum of the signal as shown in Figure 7 (the scales are already converted to the appropriate frequencies using the sam-
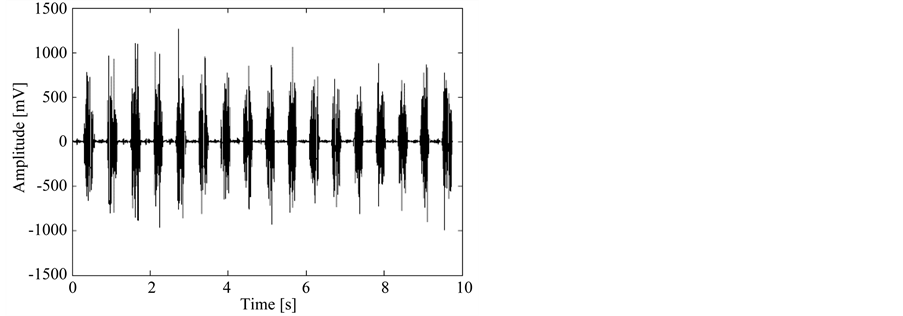
Figure 1. Example 10 sec EMG signal used for illustration of both methods: STFT and CWT analysis.

Figure 2. First 1 sec window of the example signal used in the STFT analysis.

Figure 3. Fourier Transform of the first 1 sec window of the example signal.
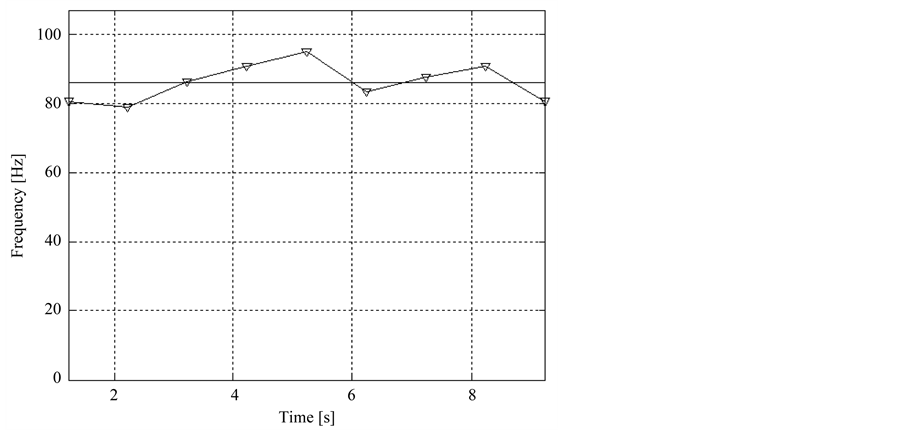
Figure 4. MDF values of the nine time-windowed signals of the 10 sec example EMG signal using the STFT technique.
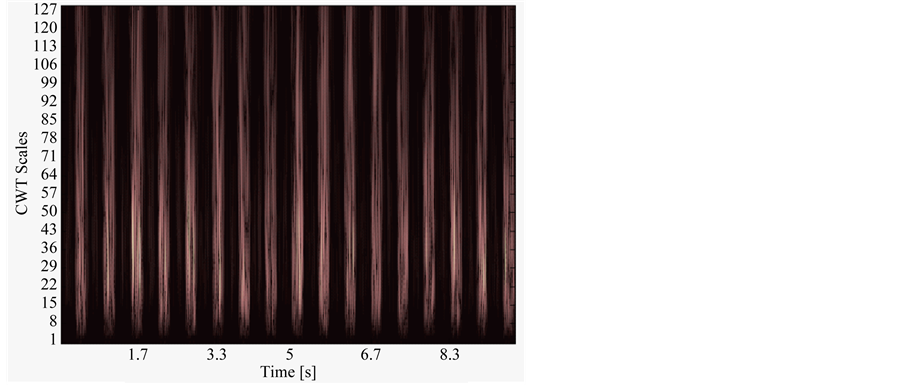
Figure 5. CWT coefficients of the 10 sec EMG example signal.

Figure 6. Portion of the CWT coefficients used in the first windowing.

Figure 7. Envelope of the power spectrum of the signal using the previous portion of the CWT coefficients.
pling period). This figure also shows the MDF: the straight line at 89.29 Hz. The MDF values of the nine windows of the 10 sec signal is presented in Figure 8, with average value of 94.63 Hz, variance of 64.98 Hz2, and slope of 0.32 Hz/sec. We present the slope results only as an illustration of the techniques, because for a proper value, more samples should be used for the estimation.
2.4. Statistical Treatment
The data were processed in the software package SPSS® for Windows version 17.0. The distribution of the data was verified by the Shapiro-Wilk’s test and comparison of data regarding the STFT and CWT techniques by Student’s  test for independent samples. The threshold for statistical significance was set at 5% (p < 0.05).
3. Results
3.1. Performance Parameters
The subjects showed a maximal workload of 390 ± 65 W. The mean workload during the 1-km time-trial was 376 ± 59 W, the mean speed was 43 ± 3 km∙h−1 and total time was 84 ± 6 sec.
3.2. Spectral Parameters
Table 1 shows the variance, slope and standard deviation for VL, VM and RF. It demonstrates a possible difference variation between the same amounts of muscle. The only statistical difference were found for VL and VM variances between STFT and CWT. RF showed any differences (p < 0.05).
The MDF from STFT and CWT means for quadriceps muscles are shown in Figure 9. No significant differences were found (p > 0.05). In Figure 10, we show a typical time-domain EMG signal from VL muscle for a random subject and typical VL median frequency via STFT and CWT techniques respectively.
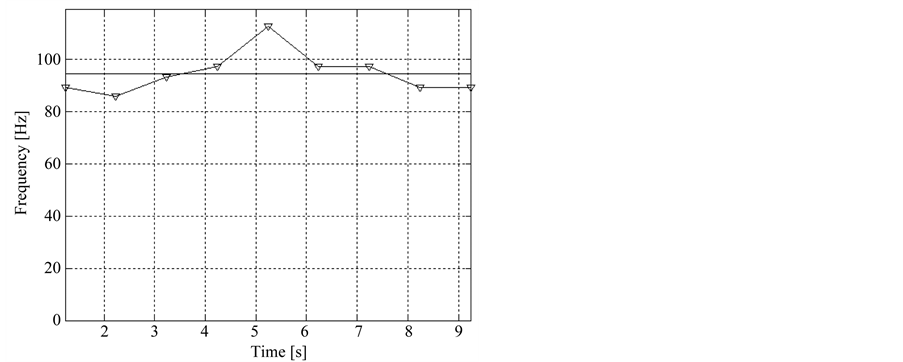
Figure 8. MDF values of the nine windowed signals of the 10 sec example EMG signal using the CWT technique.

Figure 9. Variations of mean outcome between STFT and CWT during 1-km cycling time-trial analysed in quadriceps integrated.

Table 1. Values of variance (hz2), and slope of mdf for the vastus lateralis (VL), vastus medialis (VM) and rectus femoris (RF) muscles.
*: Statistically significant differences for p < 0.05.
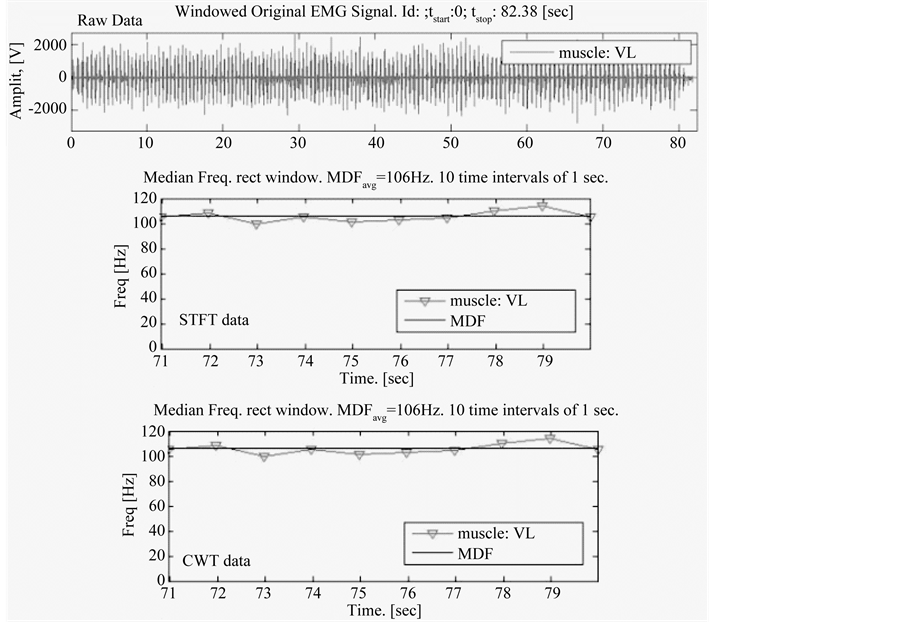
Figure 10. Typical time-domain EMG signal from VL muscle for a random subject and typical VL median frequency via STFT and CWT techniques respectively.
4. Discussion
Some studies compared the use of CWT and STFT in different exercises protocols [7] [9] [15] [16] . Both techniques seem to provide similar information regarding muscular fatigue, when EMG fatigue indices are assessed in dynamic exercise systematically controlling the movement speed, angle and force. Although our protocol involved a sport activity (cycling) without possibility of controlling these variables properly, our results suggest that both STFT and CWT may be applied to evaluate muscle fatigue using EMG fatigue indices in a time-trial dynamic exercise. These findings are in line with some studies that show that both techniques provide similar information about muscle fatigue, both in isometric and dynamic conditions [7] [9] [12] -[18] [21] .
Thus, the stationarity assumption may not be the sole factor responsible for affecting the Fourier based estimates. The findings of this study corroborate the findings of Da Silva et al. (2008) [15] that indicates less accuracy, i.e., greater variability, in the data obtained with the STFT analysis compared to the CWT.
Considering these findings some authors have suggested the CWT as an alternative method to decompose the EMG signal in dynamic contraction, since it presents more accurate and precise measurements [9] [10] . We conclude that despite the EMG signal does not change (p > 0.05) between different methods, CWT presents a more consistent outcome compared to STFT. In the same way, other studies provided similar information about this kind of signal process compared among different protocols [16] -[18] , a factor which increases the importance of thinking about the theme in many kinds of exercise and verifies the possibilities of finding the best strategy to use one or another method to process the EMG signal.
References
- De Luca, C.J., Adam, A., Wotiz, R., Gilmore, L.D. and Nawab, S.H. (2006) Decomposition of Surface EMG Signals. Journal of Neurophysiology, 96, 1646-1657. http://dx.doi.org/10.1152/jn.00009.2006
- Allen, D.G., Lamb, G.D. and Westerblad, H. (2008) Skeletal Muscle Fatigue: Cellular Mechanisms. Physiological Reviews, 88, 287-332. http://dx.doi.org/10.1152/physrev.00015.2007
- Gandevia, S.C. (2001) Spinal and Supraspinal Factors in Human Muscle Fatigue. Physiological Reviews, 81, 1725-1789.
- Abbiss, C.R. and Laursen, P.B. (2005) Models to Explain Fatigue during Prolonged Endurance Cycling. Sports Medicine, 35, 865-898. http://dx.doi.org/10.2165/00007256-200535100-00004
- Ng, J.K., Richardson, C.A., Kippers, V., Parnianpour, M. and Bui, B.H. (1996) Clinical Applications of Power Spectral Analysis of Electromyographic Investigations in Muscle Function. Manual Therapy, 1, 99-103. http://dx.doi.org/10.1054/math.1996.0257
- De Luca, C.J. (1997) The Use of Surface Electromyography in Biomechanics. Journal of Applied Biomechanics, 13, 135-163.
- Sparto, P.J., Parnianpour, M., Barria, E.A. and Jagadeesh, J.M. (1999) Wavelet Analysis of Electromyography for Back Muscle Fatigue Detection during Isokinetic Constant-Torque Exertions. Spine (Phila Pa 1976), 24, 1791-1798.
- Bonato, P., Roy, S.H., Knaflitz, M. and De Luca, C.J. (2001) Time-Frequency Parameters of the Surface Myoelectric Signal for Assessing Muscle Fatigue during Cyclic Dynamic Contractions. IEEE Transactions on Biomedical Engineering, 48, 745-753. http://dx.doi.org/10.1109/10.930899
- Hostens, I., Seghers, J., Spaepen, A. and Ramon, H. (2004) Validation of the Wavelet Spectral Estimation Technique in Biceps Brachii and Brachioradialis Fatigue Assessment during Prolonged Low-Level Static and Dynamic Contractions. Journal of Electromyography and Kinesiology, 14, 205-215. http://dx.doi.org/10.1016/S1050-6411(03)00101-9
- So, R.C., Ng, J.K., Lam, R.W., Lo, C.K. and Ng, G.Y. (2009) EMG wavelet analysis of quadriceps muscle during repeated knee extension movement. Medicine & Science in Sports & Exercise, 41, 788-796. http://dx.doi.org/10.1249/MSS.0b013e31818cb4d0
- Barria, E.A. and Jagadeesh, J.M. (1994) Multiresolution Estimation of Motion Using the Wavelet Transform. SPIE the International Society for Optical Engineering, 2303, 542-553.
- Kremenic, I.J., Glace, B.W. and McHugh, M.P. (2002) Fouriervs. Wavelet-Based Time-Frequency Analysis of Fatiguing Quadriceps Contractions. Medicine & Science in Sports & Exercise, 34, S261. http://dx.doi.org/10.1097/00005768-200205001-01459
- Weir, J.P., Heuszel, E., Witte, T., Worley, K. and Zens, M. (2003) Electromyographic Assessment of Fatigue: Fourier vs. Wavelet Based Estimates. Medicine & Science in Sports & Exercise, 35, S145. http://dx.doi.org/10.1097/00005768-200305001-00804
- Beck, T.W., Housh, T.J., Johnson, G.O., Weir, J.P., Cramer, J.T., Coburn, J.W. and Malek, M.H. (2005) Comparison of Fourier and Wavelet Transform Procedures for Examining the Mechanomyographic and Electromyographic Frequency Domain Responses during Fatiguing Isokinetic Muscle Actions of the Biceps Brachii. Journal of Electromyography & Kinesiology, 15, 190-199. http://dx.doi.org/10.1016/j.jelekin.2004.08.007
- Da Silva, R.A., Lariviere, C., Arsenault, A.B., Nadeau, S. and Plamondon, A. (2008) The Comparison of Waveletand Fourier-Based Electromyographic Indices of Back Muscle Fatigue during Dynamic Contractions: Validity and Reliability Results. Electromyography and Clinical Neurophysiology, 48, 147-162.
- Dantas, J.L., Camata, T.V., Brunetto, M.A.O.C., Moraes, A.C., Abrao, T. and Altimari, L.R. (2010) Fourier (STFT) and Wavelet (db4) spectral analysis of EMG signals in isometric and dynamic maximal effort exercise. IEEE Engineering in Medicine and Biology Society Conference, 1, 5979-5982.
- Vitor-Costa, M., Pereira, L.A., Oliveira, R.S., Pedro, R.E., Camata, T.V., Abrao, T., Brunetto, M.A.O.C. and Altimari, L.R. (2010) Fourier (STFT) and Wavelet (db4) Spectral Analysis of EMG Signals in Maximal Cosntant Load Dynamic Exercise. IEEE Engineering in Medicine and Biology Society Conference, 1, 4622-4625.
- Camata, T.V., Dantas, J.L., Abrao, T., Brunetto, M.A.O.C., Moraes, A.C. and Altimari, L.R. (2010) Fourier (STFT) and Wavelet (db4) Spectral Analysis of EMG Signals in Supramaximal Constant Load Dymic Exercise. IEEE Engineering in Medicine and Biology Society Conference, 1, 1364-1367.
- Van Ingen Schenau, G.J., Dorssers, W.M., Welter, T.G., Beelen, A., De Groot, G. and Jacobs, R. (1995) The Control of Mono-Articular Muscles in Multijoint Leg Extensions in Man. Journal of Physiology, 484, 247-254.
- Hermens, H.J., Freriks, B., Disselhorst-Klug, C. and Rau, G. (2000) Development of Recommendations for SEMG Sensors and Sensor Placement Procedures. Journal of Electromyography and Kinesiology, 10, 361-374. http://dx.doi.org/10.1016/S1050-6411(00)00027-4
- Karlsson, S., Yu, J. and Akay, M. (2000) Time-Frequency Analysis of Myoelectric Signals during Dynamic Contractions: A Comparative Study. IEEE Transactions on Biomedical Engineering, 47, 228-238.