Applied Mathematics
Vol.4 No.5A(2013), Article ID:31574,10 pages DOI:10.4236/am.2013.45A004
Finite Element Method Study on the Squats Growth Simulation
Department of Mechanical and Aerospace Engineering, Monash University, Victoria, Australia
Email: daren.peng@monash.edu
Copyright © 2013 Daren Peng, Rhys Jones. This is an open access article distributed under the Creative Commons Attribution License, which permits unrestricted use, distribution, and reproduction in any medium, provided the original work is properly cited.
Received January 14, 2013; revised April 23, 2013; accepted April 30, 2013
Keywords: FEM; Squats; Complex Crack Growth; Genetic Algorithm
ABSTRACT
A simplified finite element analysis on the squats growth simulation and the effect different contact stresses has been presented. This analysis is based on the element removal study to simulate squat growth in a rail track under cyclic loading. The major principal stress (maximum principal stress failure theory) has been used as failure criteria. Evolution strategies are derived from the biological process of evolution, to find squats growth path solution to a complex rail/ wheel contact problem.
1. Introduction
Rail squats/damage/failure is a problem of considerable economic cost. More and more track in numerous railway systems throughout the world is being affected by squats. In Australia, they first occurred in the Hunter Valley in the early 1990’s and Railcorp passenger lines in the early 2000’s becoming very prolific in some locations since then, with over 500 counted in 1.4 km of the Down North Shore Line. Squats now affect a large proportion of the RailCorp System (nearly 18%) covering a wide spectrum of infrastructure configurations and traffic types [1]. Squats patterns are not consistent. They are not strongly associated with any one infrastructure feature or traffic type and they don’t appear to be strongly linked to sleeper type or rail type, age or quality.
There are many recent studies on squats, such as [2- 12]. Those work included extensive reviews on squats, mechanisms of squat initiation and growth, field investigations and etc. Squats are easily identified visually, as they appear as dark spots or “bruises” on the running surface of the rails, as illustrated in Figure 1.
As indicated in [1], the sectioning and microscopic examination of the rails containing squat defects reveals the following main aspects: a “white etching” surface layer (WEL) is present in most mild and moderate running surface squats, which can be up to 0.15 - 0.20 mm deep. The “white etching” layer is brittle and develops small vertical cracks. Some of these cracks (at least initially) continue to grow into the parent material, both longitudinally and laterally, at an angle of about 10˚ - 30˚ to the running surface (refer to Figure 2). Others return to the surface and form a spall and at a certain depth below the rail surface the cracks begin to branch and grow on multiple planes. Two typical tangent track squats on freight line were shown in Figures 3 and 4 [13].
Observed squats are non-planar 3D features [1,6,8] that nucleate from areas of high stress concentrations in geometrically complex regions of the rail. Since the actual development pathway of squats is very complicated, a general analytical solution does not exist. A series of approximate methods are currently used for the analysis squat growth problems. The FEM (finite element method), BEM (boundary element method) and mesh free
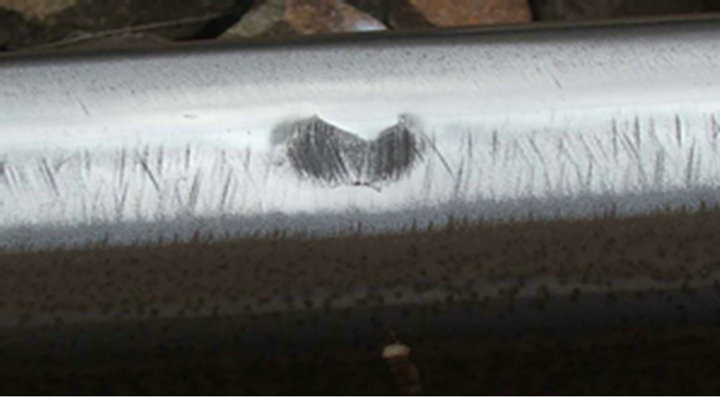
Figure 1. Squat defect on the running surface or ball of the rail head.
method [14-26] are perhaps the most widely used technique for solving simulating 3D crack growth related problems. In fact, those approaches are either really pseudo-3D (as the modeled crack surface remains planar) or need re-mesh to perform crack automated propagation (This usually involves substantial computational effort). A non re-meshing algorithm for modelling cracks growth is provided in [27]. But it limits to solve 2D problems. All mentioned techniques are not suitable for simulating squats propagation.
The aim of this paper is to simulate the formation and growth of squats on railway tracks using numerical analysis. By successfully simulating the initiation and growth of squats in railway tracks, a simple prognosis tool can be created. This tool would be able to help identify problem areas on the tracks or as an early detection system for possible failures. This will then allow measures to be taken to minimize squat growth or prevent squat formation altogether which will in turn decrease maintenance costs and down times of railway services.
2. Methodology
This section describes the development pathways of squats growth under alternating loads. A simple evolutionary procedure has been developed to simulate squats growth. Evolution strategies are derived from the biological process of evolution to find squats growth path solution to a complex rail/wheel contact problem. This technique is called ‘Nibbling Algorithm’ that is based on genetic algorithms and the whole field of evolutionary computation. Due to its simplicity, this genetic algorithm has also been successfully implemented in other fields such as topology optimization called “Evolutionary
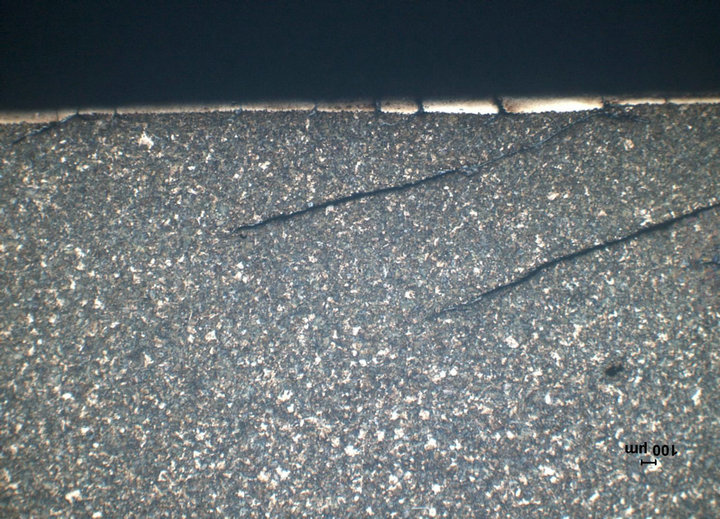
Figure 2. Early growth of running surface squat defects.
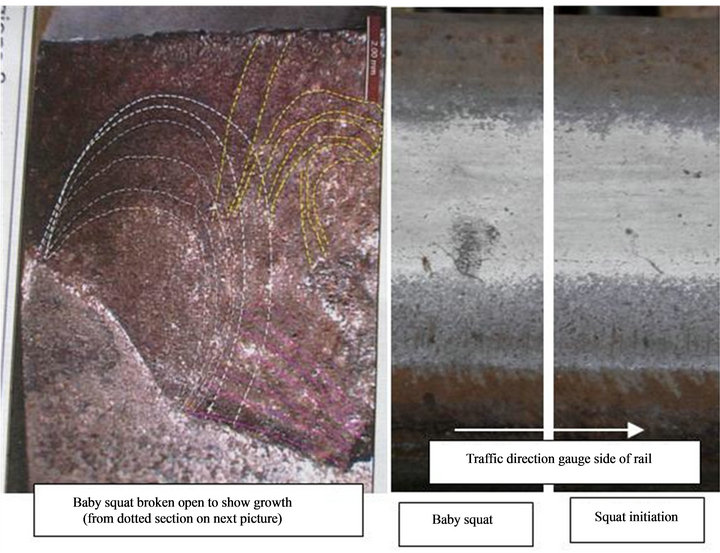
Figure 3. The initial squat growth appears to arise from a similar crack position and orientation.
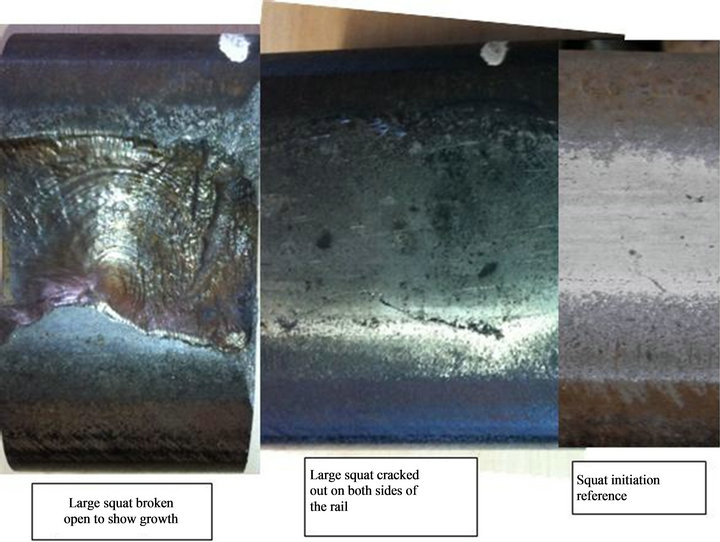
Figure 4. Zoomed in view of the region of initial growth.
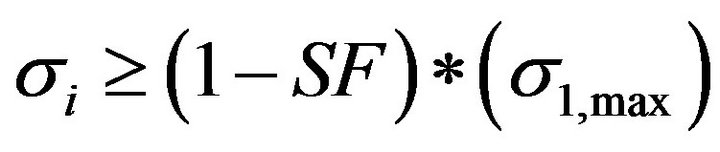
Structural Optimisation” (ESO) [28]. The “Nibbling Algorithm” is a heuristic method. It works by removing elements from highly stressed regions. In this study, a representative maximum principal stress for each element and ultimate tensile strength are chosen as the selection criterion. Here we adopted an average stress for each element derived from the corresponding gauss point stresses. In a given stage (iteration), the ith element is removed if:
 (1)
(1)
where  is the representative average maximum principal stress for the
  element,
  is the peak maximum principal stress for all the elements in the structure and SF is a elimination factor. The elimination factor plays an important role in controlling the iteration process. A high value will lead to a rapid convergence, but may cause instability. The instability may drive the solution away from a correct pathway of crack growth. In contrast, a very low value will require a large number of iterations and can dramatically increase the solution time.
The procedure is explained in more detail below. Finite element modelling is generally used for structural response evaluation with the alternating method. Based on certain predefined criteria, failed material is removed from the structure. The term “failure” means that the element is cracked or is not taking part or contributing to the overall performance of the structure. The maximum principle stress at the centroid of each element is chosen as alternating criteria. The elements with highest maximum principle stress will be eliminated at each evaluation. After which, a new FE model will be created by using updated mesh and replacing its old loading set with new one from load store.
The updated structure will be re-analysed. Depending on the response of the new structure, the algorithm will again identify elements with alternating criteria and eliminate them from the structure. This process is continued until the resulting structure satisfies some sort of convergence criteria like an allowable value of loading influence factor or schedule iteration number.
One major advantage of alternating method is that it uses the initial finite element mesh for the structural analysis. It does not require re-meshing every time. This is advantageous as it improves CPU time and allows more control over the objective functions.
3. Numerical Examples
The first example considers the evaluation the development pathway of fatigue crack growth of a plate with an inclined crack, see Figure 5. The material was taken to be an aluminium alloy 2024-T3 with a Young’s modulus and a Poisson’s ratio of  MPa, and
  respectively. The width (2W), thickness (t), and the height (H) of the plate were taken to be 76 mm, 3.1 mm and 152 mm respectively. The initial crack length was 28.3 mm and the angle of inclination was 450. The elimination factor used in this example was 0.001.
The results of the crack growth program on the validation test case are shown in Figure 6. It can be seen that the crack travels from tips towards the edges of the plate. It also progresses slightly downwards toward the line of symmetry. Agreement between present predictions and data obtained in [29,30] was very well, see Figure 7. The results achieved were deemed satisfactory to proceed to the next stage of the project which is the analysis on the rail track model.
Let us next consider a 3 dimensional rail track model of crack growth pathway. This model is set on 6 sleepers.
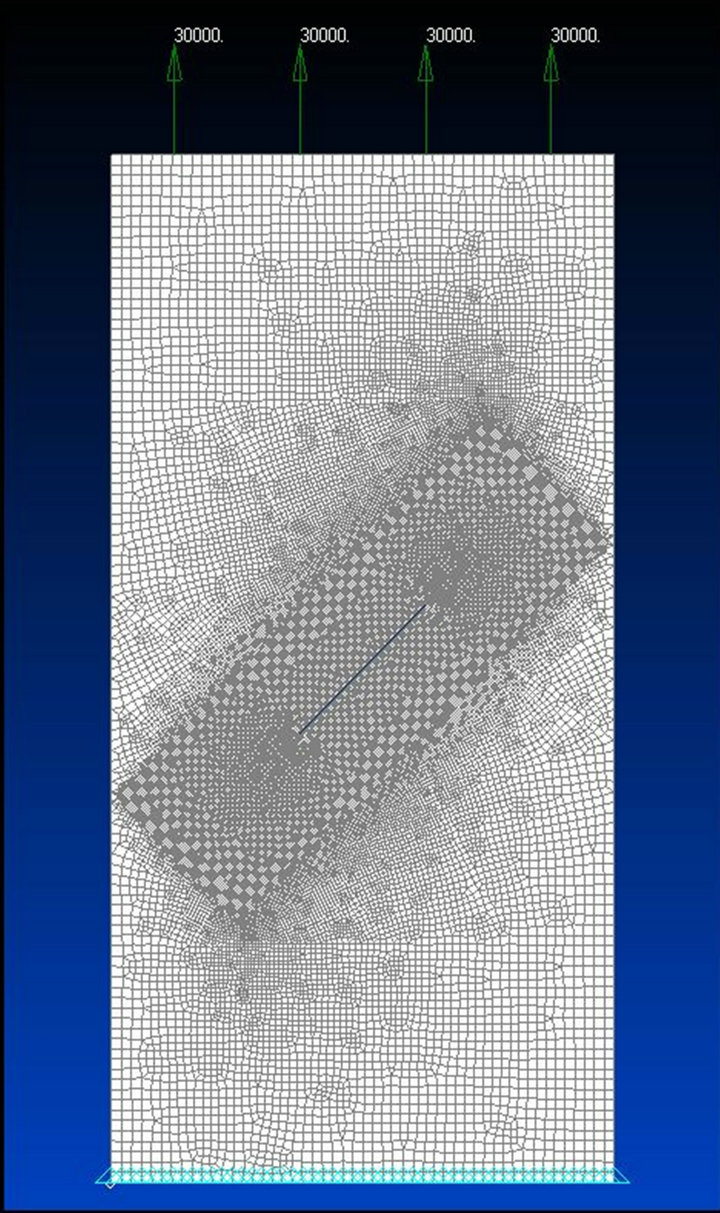
Figure 5. FEA model.
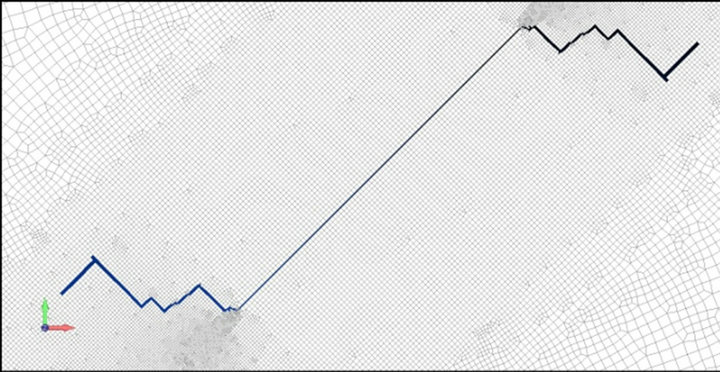
Figure 6. The crack growth result of the validation model.
3000 mm rail span was modeled with support out at 600 mm apart. The geometry of the 3D rail track model is shown in Figure 8. Support is assigned different material properties to simulate the behavior of sleepers and ballast. The Young’s modulus and Poisson’s ratio of rail and sleeper were assumed to be  and
and  respectively. Wheel/Rail contact load applied mid span.
Prior studies on the growth cracks in head hardened rail (track) steel, which was provided by Rail Corp, taken from the field in NSW revealed that the growth of small sub mm cracks was not time dependent and could be modelled using linear elastic fracture mechanics [31]. Indeed, as in [32] which examines the growth of near micron size initial cracks, the fatigue threshold for small sub mm cracks in this rail head hardened steel was found to be negligible.
Two different cases of the squat growth correspond to a V-set motor with two bogies car in curve and hunting contact have been considered. The location of loads applied and the result of contact forces on the lower and high rail with the leading axle the car in a transition, see Figures 9 and 10. The simulation is for light traction force of about 0.08 adhesion case. Rail friction is 0.5 in the simulation for dry rail given the 70 km/h speed. The curve radius of the rail is 300 meter.
The first case considers the rate of applied loads are  and
and . Here, the symbols P,Q and L represent vertical, longitudinal and lateral loading respectively. In second case, the rate of applied loads are
 . The contact patches for case 1 and case 2 are shown in Figures 11 and 12. The Vermeulen-Johnson method has been used to evaluate contact stress [33]. The elimination factor for both cases was 0.01.
A sufficient fine mesh has been taken in the vicinity of the applied contact loading (0.1 mm × 0.1 mm × 0.1 mm) for the both cases. The resultant mesh for the case 1 has 1064700 nine-noded elements and 1213872 nodes. The corresponding Maximum principle stress distribution of the rail under contact loads with no squats is shown in Figure 13.
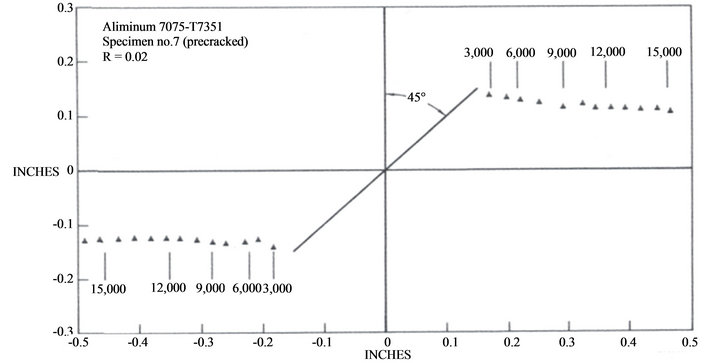
Figure 7. Crack growth path [30].

Figure 8. The geometry view of the rail track model.
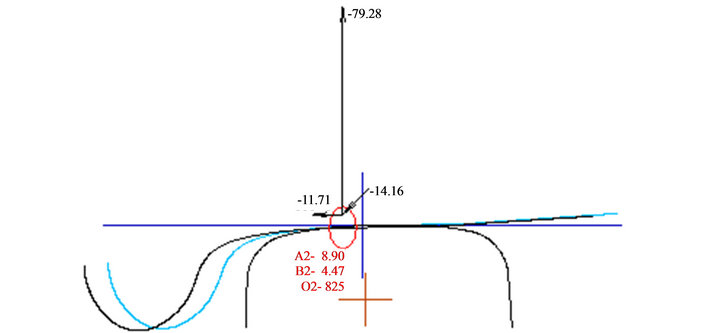
Figure 9. Contact forces at low rail [7].
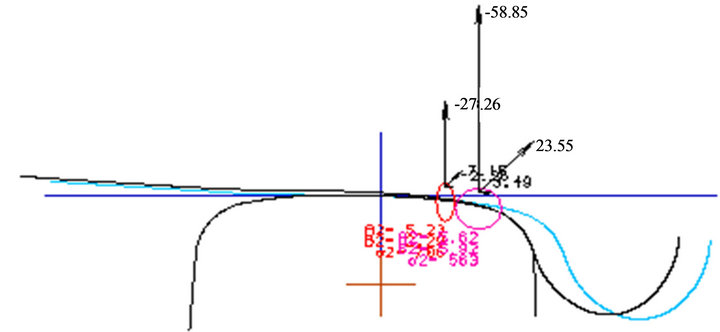
Figure 10. Contact forces at high rail [7].
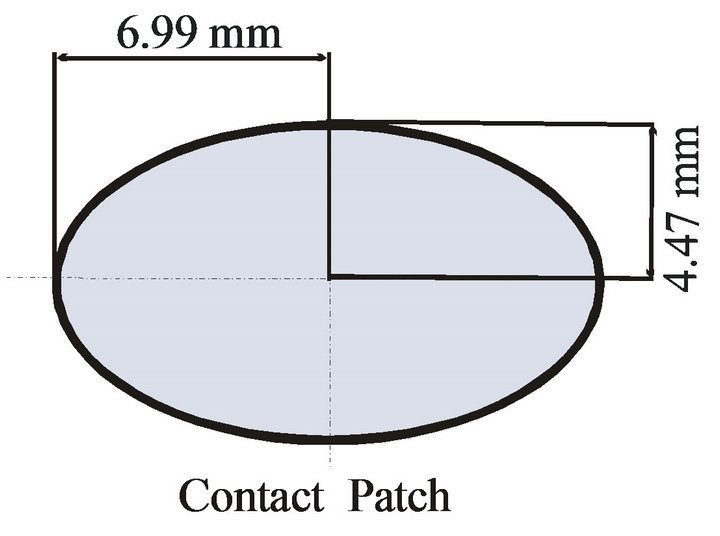
Figure 11. Contact area for the case 1.
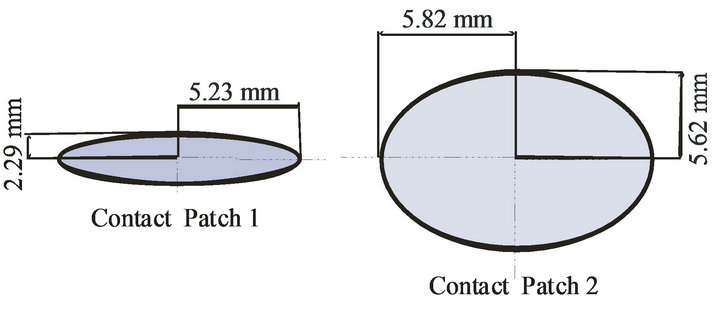
Figure 12. Contact area for the case 2.
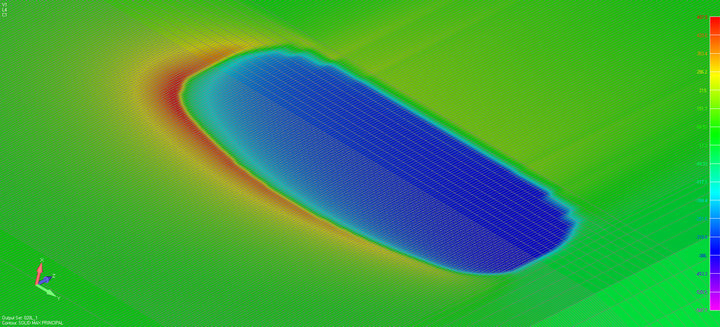
Figure 13. Maximum principle stress of the rail under contact loads at initial time.
The patterns in the iteration range 1000 - 1005 were very close. Thus, selecting any of them could have made practically no difference. The outlines of prediction of the squats growth pathway on the rail for this are shown in Figures 14 and 15.
The finite element model of case 2 contained 653315 nine-noded elements and 673936 nodes. Figure 16 shows the Maximum principle stress distribution of the rail under contact loads with no squats. Figures 17 and 18 show the results of the squats growth pathway at 1476 iteration. It then increased slightly until the structure completely collapsed at iteration 1478. Therefore, the configuration shown in Figure 18 can be taken as the prediction result of squat growth corresponding to this loading case. Crack propagates from the contact patch. As they grow, a point is reached where the stress applied to the contact patch is no longer of significance to the crack—the crack propagation thus stops.
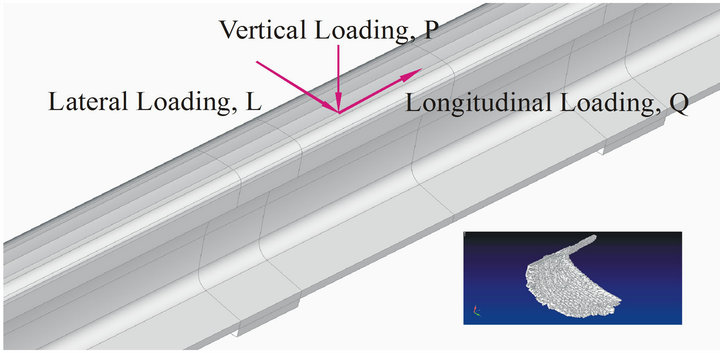
Figure 14. Squat growth result (after 1000 iterations).
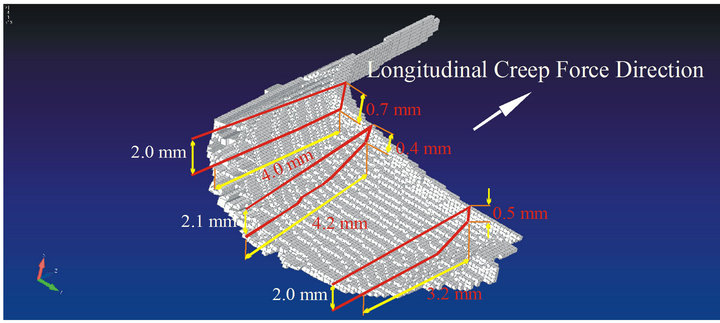
Figure 15. Local detail of the squat.
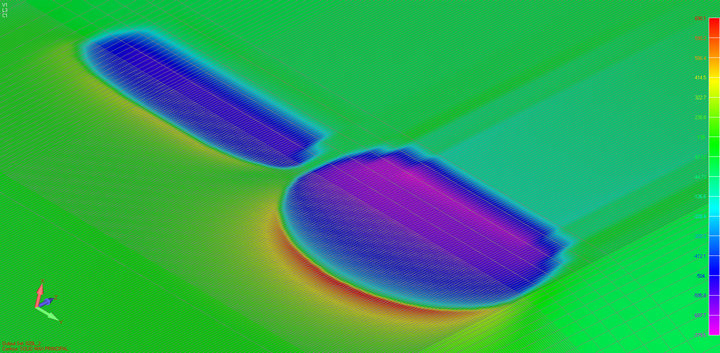
Figure 16. Maximum principle stress of the rail under contact loads at initial time.
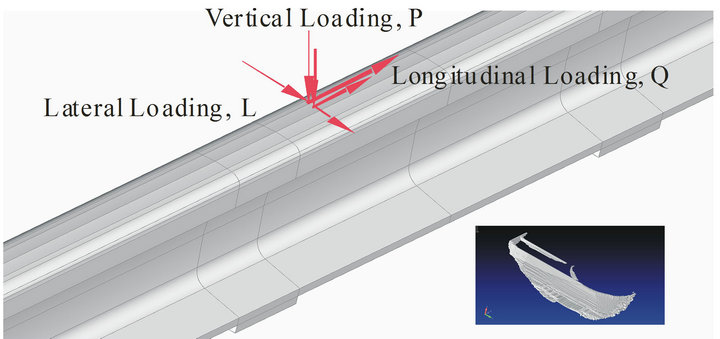
Figure 17. Squat growth result (after 1476 iterations).

Figure 18. Local detail of the squat.
The 3D squat growth simulation obtained here were similar to those real squats such as shown in Figures 3 and 4.
4. Conclusions
The 3D element removal study provides in this paper is the only study that attempted to model the 3D growth of a squat from a small initiating defect to a large size. In this study, it can be found that 3D modelling technique captures the intrinsic features of squat growth. One advantage of this methodology is very easy to use and the various model parameters could be easily modified to observe their effects. The 3D squat growth simulation method presented in this paper is based on linear elastic analysis without including the residual stress field we predict a squat shape that is in reasonable agreement with reality.
The analysis runs on any PC computer and the computational time is not very long although it depends on the mesh size of the model, the type of analysis and the number of iterations.
It should be stressed here that the flexibility of this alternating technique would easily allow the study of problems associated with multiple random contact loading sets.
5. Acknowledgements
This work was funded by the Commonwealth Research Centre for Railway Innovation through CRC Rail Squat Project R3-105. The authors wish to acknowledge the assistance of Mr. A. Dhaliwal in providing help for finite element analysis model the plate with an inclined crack.
REFERENCES
- M. Kerr, A. Wilson and S. Marich, “The Epidemiology of Squats and Related Rail Defects,” Proceedings of CORE 2008 Conference on Railway Engineering: Rail-the-Core of Integrated Transport, Perth, 7-10 September 2008, pp. 83-96.
- S. Mohan, S. Simson, M. Spyriagin and C. Cole, “Early Detection of Rail Squats Using Eddy Current Inspection,” 10th International Heavy Haul Association Conference on Railroading in Extreme Environments, Calgary, 19-22 June 2011.
- M. J. M. M. Steenbergen, G. W. van Bezooijen and R. P. B. J. Dollevoet, “The Mechanisms of Squat Initiation and Growth on Train Rails,” 10th International Heavy Haul Association Conference on Railroading in Extreme Environments, Calgary, 19-22 June 2011.
- S. L. Grassie, D. I. Fletcher, E. A. Gallardo-Hernandez and P. Summers, “‘Squats’ and ‘Studs’ in Rails: Similarities and Differences,” 10th International Heavy Haul Association Conference on Railroading in Extreme Environments, Calgary, 19-22 June 2011.
- H.-K. Jun and W.-H. You, “Estimation of Crack Growth Life in Rail with a Squat Defect,” Key Engineering Materials, Vol. 417-418, 2010, pp. 313-316. doi:10.4028/www.scientific.net/KEM.417-418.313
- S. L. Grassie, “Squats and Squat-Type Defects in Rails: The Understanding to Date,” Proceedings of the Institution of Mechanical Engineers, Part F: Journal of Rail and Rapid Transit published online 24 October 2011. doi:10.1177/0954409711422189
- S. Simson and S. Mohan, “Wheel Rail Contact Conditions Causing Rail Squats,” CORE 2010: Rail, Rejuvenation and Renaissance, Wellington, 12-14 September 2010.
- S. Marich and S. Mackie, “A Discussion on the Rail Squat Defects in the Hunter Valley (Version 2),” RSA Hunter Valley Internal Technical Note, Rail Corporation New South Wales, Sydney, 3 April 2001.
- S. Marich, “Practical/Realistic Implementation of Wheel/ Rail Contact Technologies: The Australian Experience,” Proceedings of the Seventh International Conference on Contact mechanics and Wear of Rail/Wheel Systems, Brisbane, 24-27 September 2006, pp. 3-21.
- Z. Li, X. Zhao, C. Esveld, R. Dollevoet and M. Molodova, “An Investigation into the Causes of Squats: Correlation Analysis and Numerical Modeling,” Wear, Vol. 265, No. 9-10, 2008, pp. 1349-1355. doi:10.1016/j.wear.2008.02.037
- Z. Li, “Squats on Railway Rails,” In Wheel/Rail Interface Handbook,” In: R. Lewis and O. Olofsson, Eds., Woodhead Publishing Ltd, Oxford, pp. 409-436.
- Z. Li, R. Dollevoet, M. Molodova and X. Zhao, “Squat Growth: Some Observations and the Validation of Numerical Predictions,” Wear, Vol. 271, No. 1-2, 2011, pp. 148-157. doi:10.1016/j.wear.2010.10.051
- M. Kerr, “Squat Growth Review,” Railcorp Report, Rail Corporation New South Wales, Sydney, 2011.
- P. Krysl and T. Belytschko, “Application of the Element Free Galerkin Method to the Propagation of Arbitrary 3D Cracks,” International Journal for Numerical Methods in Engineering, Vol. 44, No. 6, 1999, pp. 767-800. doi:10.1002/(SICI)1097-0207(19990228)44:6<767::AID-NME524>3.0.CO;2-G
- R. Galdos, “Finite Element Technique to Simulate the Stable Shape Evolution of Planar Cracks with an Application to Semi-Elliptical Surface Crack in a Bimaterial Finite Solid,” International Journal for Numerical Methods in Engineering, Vol. 40, No. 5, 1997, pp. 905-917. doi:10.1002/(SICI)1097-0207(19970315)40:5<905::AID-NME94>3.0.CO;2-3
- J. Cervenka and V. E. Saouma, “Numerical Evaluation of 3-D SIF for Arbitrary Finite Element Meshes,” Engineering Fracture Mechanics, Vol. 57, No. 5, 1997, pp. 541- 563. doi:10.1016/S0013-7944(97)00024-6
- P. E. O’Donoghue, S. N. Atluri and D. S. Pipkins, “Computational Strategies for Fatigue Crack Growth in Three Dimensions with Application to Aircraft Components”, Engineering Fracture Mechanics, Vol. 52, No. 1, 1995, pp. 51-64. doi:10.1016/0013-7944(94)00329-G
- Y. Mi and M. H. Aliabadi, “Three-Dimensional Crack Growth Simulation Using BEM,” Computers and Structures, Vol. 52, No. 5, 1994, pp. 871-878. doi:10.1016/0045-7949(94)90072-8
- L. F. Martha, P. A. Wawrzynek and A. R. Ingraffea, “Arbitrary Crack Representation Using Solid Modeling,” Engineering with Computers, Vol. 9, No. 2, 1993, pp. 63-82. doi:10.1007/BF01199046
- M. D. Gilchrist and R. A. Smith, “Finite Element Modelling of Fatigue Crack Shapes,” Fatigue & Fracture of Engineering Materials & Structures, Vol. 14, No. 6, 1991, pp. 617-626. doi:10.1111/j.1460-2695.1991.tb00691.x
- P. Köster, C.-P. Fritzen, H. Knobbe, H.-J. Christ and U. Krupp, “Simulation of Stage I-Crack Growth Using a 3DModel,” Proceedings in Applied Mathematics and Mechanics (PAMM), Vol. 9, 2009, pp. 201-202. doi:10.1002/pamm200910075
- H. A. Richard, M. Sander, M. Fulland and G. Kullmer, “Development of Fatigue Crack Growth in Real Structures,” Engineering Fracture Mechanics, Vol. 75, No. 3-4, 2008, pp. 331-340. doi:10.1016/j.engfracmech.2007.01.017
- N. Moes, A. Gravouil and T. Belytschko, “Non-Planar 3D Crack Growth by the Extended Finite Element and Level Sets—Part I: Mechanical Model,” International Journal for Numerical Methods in Engineering, Vol. 53, No. 11, 2002, pp. 2549-2568. doi:10.1002/nme.429
- B. J. Carter, P. A., Wawrzynek and A. R. Ingraffea, “Automated 3D Crack Growth Simulation,” Gallagher Special Issue of International Journal for Numerical Methods in Engineering, Vol. 47, 2002, pp. 229-253.
- P. A. Wawrzynek, B. J. Carter and A. R. Ingraffea, “Advances in Simulation of Arbitrary 3D Crack Growth Using FRANC3D/NG,” Proceedings of ICF12, Ottawa, 12-17 July 2009, pp.344-354.
- K. Kolk and G. Kuhn, “The Advanced Simulation of Fatigue Crack Growth in Complex 3D Structures,” Archive of Applied Mechanics, Vol. 76, No. 11-12, 2006, pp. 699-709. doi:10.1007/s00419-006-0092-y
- N. Moes, J. Dolbow and T. Belytschko, “A Finite Element Method for Crack Growth without Remeshing,” International Journal for Numerical Methods in Engineering, Vol. 46, No. 1, 1999, pp. 131-150. doi:10.1002/(SICI)1097-0207(19990910)46:1<131::AID-NME726>3.0.CO;2-J
- Y. M. Xie and G. P. Steven, “Evolutionary Structural Optimization,” Springer, Heidelberg, 1997. doi:10.1007/978-1-4471-0985-3
- Y. C. Lam, “Mixed Mode Fatigue Crack Growth and the Strain Energy Density Factor,” Theoretical and Applied Fracture Mechanics, Vol. 12, 1989, pp. 67-72. doi:10.1016/0167-8442(89)90016-5
- R. Badaliance, “Mixed Mode Fatigue Crack Propagation,” Proceedings of First USA-Greece symposium on Mixed Mode Crack Propagation, Athens, 18-22 August 1980, pp. 77-98.
- D. Peng, R. Jones and T. Constable, “An Investigation of the Influence of Rail Chill on Crack Growth in a Railway Wheel Due to Braking Loads,” Engineering Fracture Mechanics, Vol. 98, 2013, pp. 1-17. doi:10.1016/j.engfracmech.2012.12.001
- R. Jones, S. Pitt and D. Peng, “The Generalised FrostDugdale Approach to Modelling Fatigue Crack Growth,” Engineering Failure Analysis, Vol. 15, No. 8, 2008, pp. 1130-1149. doi:10.1016/j.engfailanal.2007.11.007
- P. J. Vermeulen and K. L. Johnson, “Contact of Non Spherical Bodies Transmitting Tangential Forces,” Journal of Applied Mechanics, Vol. 31, No. 2, 1964, pp. 338- 340. doi:10.1115/1.3629610