Advances in Bioscience and Biotechnology
Vol.2 No.4(2011), Article ID:6857,7 pages DOI:10.4236/abb.2011.24031
Effect of magnetic field on the fermentation kinetics of Saccharomyces cerevisiae
![]()
1Department of Electrical and Computer Engineering, Iowa State University, Ames, Iowa;
2Department of Agricultural and Biosystems Engineering, Iowa State University, Ames, Iowa;
3Department of Agricultural and Biological Engineering, Purdue University, West Lafayette, Indiana.
E-mail: *pandey@iastate.edu
Received 11 March 2011; revised 27 June 2011; accepted 22 July 2011.
Keywords: Saccharomyces cerevisiae; Bioethanol; Fermentation; Magnetic Field
ABSTRACT
Published literature has shown conflicting results regarding the effects of magnetic fields on the fermentation kinetics or cellular growth of various Saccharomyces cerevisiae strains. Here, two sets of experiments were conducted to characterize the role of magnetic fields on cell growth and ethanol production during fermentation. The first experiment was completed for 25 h at a 2% dextrose loading rate under influence of homogeneous and non-homogeneous static magnetic fields on the order of 100 and 200 mT, respectively. The second experiment was completed for 30 h at a 6% dextrose loading rate under the influence of a non-homogeneous static magnetic field on the order of 200 mT. It was found that homogeneous magnetic fields have no significant effect on the yeast cell growth, while non-homogeneous static magnetic fields produced an increase (~8% over the control) in peak ethanol concentration with 2% dextrose loading.
1. INTRODUCTION
The inevitable depletion of non-renewable energy sources and environmental concerns of burning fossil fuels has created increased demand for the development of eco -friendly, renewable energy sources such as ethanol. Maximizing the efficiency of ethanol production is important to increasing its efficacy as a long-term, renewable energy source.
Magnetic field enhanced fermentation has been proposed as a method to increase the efficiency of ethanol production [1,2]. In a recent study, it was demonstrated that exposure to 220 mT static magnetic fields produced a 2.5 fold increase in biomass (g/L) and 3.4 fold increase in ethanol concentration within magnetized cell cultures [1]. The initial density of yeast cells (S. cerevisiae strain, DAUFPE-1012) was around 6 × 10⁴ cells/mL and the growth medium comprised yeast extract and glucose. The culture was placed in test tubes (closed with rubber stoppings) attached to ends of an electric motor for synchronous agitation of the cell suspension. Permanent magnets were fixed to test tubes for the application of magnetic fields and the fermentation process was observed for a 24 hour period. While the ethanol production started its progression in the 2nd hour and saturated around 10 g/L after 4 hours, the magnetized culture showed rising ethanol production up to the 24th hour. It was suggested that, in control experiments, the alcohol produced eventually inhibited the yeast cell cycle after a certain threshold. However, exposure to magnetic fields may have increased the alcohol tolerance of yeast cells. In a related report [2], low frequency magnetic fields (5 mT and 20 mT) were produced in a BIOFLO-III stirred glass fermentor where the cellular suspension was constantly recycled. The magnetic fields were created by using a combination of permanent magnets and a solenoid coil. Under these conditions, the ethanol yield increased from 83.5% of the theoretical value for the control to 86.7% of the theoretical value for magnetized culture. The authors indicated that this increase may be attributed to the specific strain (not mentioned), initial cell density (not mentioned) and the inoculum (sugar molasses) used. A direct comparison of the experimental results in the two published reports [2] is rather difficult because of some differences in their experimental design. While one group used glucose in the growth medium [1], the other group used sugar molasses as a glucose substitute [2]. The exact S. cerevisiae strains and the initial cell density used in the two studies may also be different, which is indicated by different rates of sugar consumption. In addition, the nature/strength of magnetic field and their individual fermentation apparatus are different to draw a reasonable conclusion.
Prior to these two studies [1,2], there has been considerable research in understanding the positive or negative effects of magnetic fields on cellular proliferation. In most cases, the production of carbon dioxide was estimated by measuring the pH variations of culture media and the gaseous pressure. In one study, it was reported that magnetic fields accelerated the cell growth processes during fermentation [3]. Static magnetic fields (0.22 T, 0.11 T) exposed to DAUPE-1012 yeast cells were shown to induce some growth alterations and changes in metabolic levels after 22 hours of experiment. Further tests revealed that the lower magnetic field (0.11 T) produced no significant change in the acidification or biomass production of the exposed cultures compared to control cultures. The 220 mT static magnetic field, however, produced better results (enhancement of 260% in biomass production, 100% in acidification, and 1.84% in cellular proliferation) compared to control cultures. It was therefore suggested that exposure to 220 mT magnetic field induced, after 12 hours, a shift in cellular metabolic activity. Another group further confirmed that proliferation of H192 ZIMET yeast strains increased in the presence of weak alternating fields (50 Hz) and at amplitudes of 0.2 mT and 0.5 mT [4]. It was hypothesized that there exists a frequency “window” of 15 to 50 Hz at a certain field amplitude (0.5 mT) where positive effects of magnetic fields on proliferation could be observed. However, the authors also mentioned that rigorous trials with a broader range of physical parameters were needed to confirm this frequency window. In contrast to these findings [3,4], a study demonstrated that static and 50 Hz sinusoidal magnetic field of 0.35 and 2.45 mT have no effect on the cellular growth of WS8105-1C yeast strains in comparison to unexposed control cells [5]. The authors indicated that their results are in disagreement with previous reports showing enhancement in cell growth upon exposure to magnetic fields, attributing their differences to incomplete characterization of magnetic field properties and inconsistent parameters in previous studies. The starting number density of yeast cells was around 1.5 × 10⁷ cells/mL. Their observations were supported by the fact that magnetic fields were not known to be a stress factor for cells because no significant physiological changes (changes in the levels of heat-shock proteins, DNA repair, protein synthesis, cellular respiration, etc.) were observed in the biological specimens. In another study, a static magnetic field was created and the field strength was varied from 0 - 10 T [6]. It was seen that the proliferation of K-7 yeast strains was suppressed by the static magnetic field for up to strengths of 5 T. The effects of magnetic field saturated at around 5 T. In a further study [7], a gradient static magnetic field was created whose magnetic flux densities B were 5 - 14 T with a maximum gradient of 94 T/m. A superconducting magnet was used for the experimental set up, while the control experiments were conducted at a distance of 4 m from the magnet where the magnetic field B = 0.15 mT. A deceleration in yeast proliferation was observed in the presence of magnetic field gradients. It was hypothesized that yeast cells localized in regions of lower magnetic fields where diamagnetic carbon dioxide molecules also gathered. The gradient magnetic field affected the transport of paramagnetic oxygen molecules from lower to higher magnetic fields. The respiratory response of yeast cells were affected by the spatial distribution of gaseous molecules which led to decelerated cell proliferation. Even though the postulated hypothesis is reasonable, it would be worthwhile to conduct the tests on lower magnetic fields and under no magnetic field in control experiments (which was non-zero in this case).
The above experiments on the measurements of cellular proliferation with a.c. magnetic fields and gradient magnetic fields raise some concerns. The effects of a.c. magnetic fields on yeast proliferation may be difficult to detect due to the increase in temperature from joule heating occurring in these experiments [6]. A gradient magnetic field produces magnetic-induced forces on water/oxygen/carbon dioxide molecules. As such, static magnetic field that uniformly present around the culture medium is preferred during magnetic fermentation. Furthermore, most of the abovementioned groups have used different S. cerevisiae strains, which make it difficult to arrive at any definite conclusion. In addition, there is inconsistency among the different groups in choosing the physical parameters (the type, strength, frequency, and duration of magnetic field) and biological samples (growth media, inoculum concentration, experimental parameters extracted). For instance, in the surveyed literature, inoculum concentrations varied from approximately 102 to 107 cells/mL. This affects the results of magnetic fermentation as it determines the initial cell growth rate and the time lag before ethanol production occurs.
The variability among the abovementioned experimental parameters in previous studies [1-7] necessitates the conduction of a well-controlled experiment that explores the fermentation kinetics of a common fermentation organism, creating a baseline for the comparison of magnetic fermentation experiments. The objectives of our study are to characterize the fermentation kinetics of S. cerevisiae and to determine the effects of externally applied magnetic fields on fermentation by measuring cell growth and ethanol production. Specifically, the role of initial inoculum concentration, sugar loading, and non-homogeneous static magnetic fields will be studied.
2. MATERIALS AND METHODS
2.1. Growth Medium
Experiments were conducted with Saccharomyces cerevisiae strain ATCC® 24859. This wild-type diploid strain was chosen because it has been shown to possess high ethanol concentration tolerance [8]. Fermentation medium contained 10% (v/v) 10X YP (yeast extract, peptone) medium and 5% (v/v) 1.0 M citrate buffer (pH 4.8). In order to test the effects of magnetic fields on fermentation medium’s sugar concentration, two different dextrose loading rates were chosen: “low” loading fermentation medium containing 2% (w/v) dextrose and “high” loading fermentation medium containing 6% (w/v) dextrose.
2.2. S. cerevisiae Characterization Setup
The characterization of S. cerevisiae’s fermentation kinetics was conducted through three simultaneous repetitions of six fermentations per repetition, inoculated with cell densities evenly spaced on a logarithmic scale from approximately 102 to 107 colony forming units (CFU) per mL. Fermentations were completed in eighteen 150 mL DeLong fermentation flasks, each containing 100 mL working volume of inoculated 2% fermentation medium. The fermentation flasks were vortexed and incubated for 72 h at 35˚C in a shaking water bath (New Brunswick Scientific, NJ) at 150 rpm. In addition, 5 mL samples were collected at hours 0, 4, 12, 24, 48, and 72.
2.3. Magnetic Fermentation Setup
The apparatus for magnetic fermentation required slight changes from the one used for S. cerevisiae characterization to facilitate the use of magnets. The shaking water bath was replaced with a Model 307C low temperature incubator (Fisher Scientific, Fair Lawn, NY) which housed two Innova 2000 shaker stages (New Brunswick Scientific, NJ). To increase magnet stability and magnetic field strength, DeLong fermentation flasks were replaced with BD Falcon 250 mL tissue culture flasks.
Magnetic fields were generated by ultra-high-pull neodymium-iron-boron permanent magnets. Two 7.6 × 0.64 cm, non-plated disc magnets with 222 N of pull force (McMaster-Carr, Elmhurst, IL) produced a homogeneous, static magnetic field (HMF). Eight 2.5 × 1.3 cm, nickel plated disc magnets with 169 N of pull force (McMaster-Carr) created a non-homogeneous, static magnetic field (NHMF). With magnets placed on the sides of tissue culture flasks, the magnetic field strengths of both homogeneous and non-homogeneous configurations were measured with a Lake Shore Model 410 gaussmeter and a Lake Shore Model 410 transverse probe (Lake Shore Cryotronics Inc., Westerville, OH). The results of these measurements are plotted as contour maps of magnetic field strength for the HMF (Figure 1(a)) and NHMF (Figure 1(b)) configurations.
Two sets of magnetic fermentations were conducted. The first was at 2% dextrose loading with control, HMF, and NHMF groups. The second was at 6% dextrose loading with control and NHMF groups. For reasons discussed later, the HMF group was excluded from the second set of experiments. Fermentation medium for magnetic fermentations was inoculated with approximately 103 CFU/ mL.
2.4. Experimental Analyses
The optical absorption of cell suspensions was measured at a wavelength of 600 nm with a Genesys 6 spectrophotometer (Thermo Electron Corp., Waltham, MA) and translated to CFU density determined through spectrophotometer calibration. Fermentation filtrates were analyzed for ethanol concentration by high-performance liquid chromatography (HPLC) with a Varian Prostar 355 refractive index detector (Varian, Palo Alto, CA) using an Aminex® HPX-87H column (Bio-Rad Laboratories, Hercules, CA). Separations were made using 0.01 N sulfuric acid as the mobile phase at a flow rate of 0.6 mL/min, a column temperature of 65˚C, and an injection volume of 20 μL. The fermentation trials were conducted using a randomized complete block design with four replications. Statistical analysis was done using Graphpad Prism software. Trends in cell growth data were fitted with a logistic growth model [9].
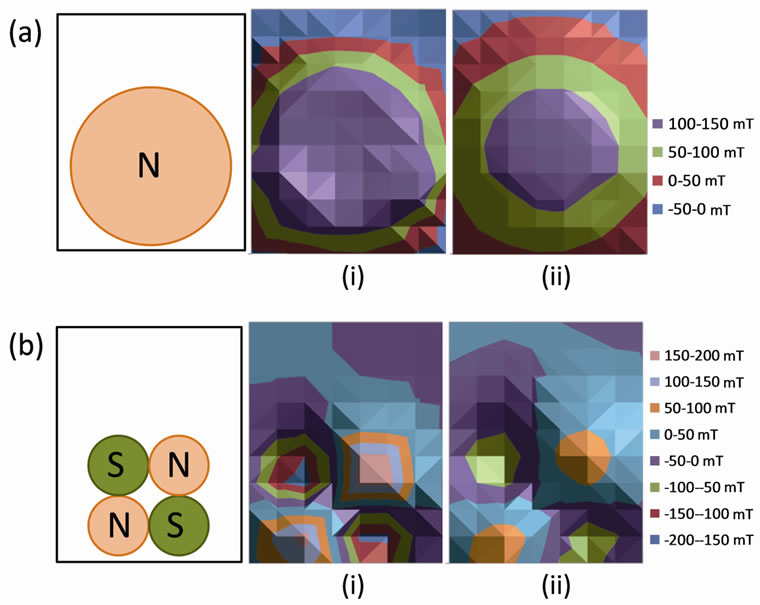
Figure 1. (a) Contour maps of homogeneous magnetic field strength (mT) for a permanent magnet placed at 0.5 cm (i) and 1.5 cm (ii) from flask surface, (b) Contour maps of non-homogeneous magnetic field strength (mT) for permanent magnets placed at 0.5 cm (i) and 1.5 cm (ii) from flask surface.
3. RESULTS AND DISCUSSION
3.1. Characterization of S. cerevisiae Fermentation
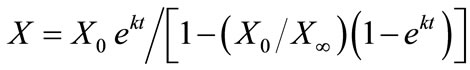
Fermentation cell growth was modeled by the standard logistic growth model as [9]:
 (1)
(1)
where X is the cell concentration at time t, X0 is the starting cell concentration, X¥ is the final cell concentration, and k is the rate constant. The model parameters for all inoculum concentrations are listed in Table 1. A plot of the cell growth data, cell growth models and ethanol concentrations versus time for all starting cell concentrations are shown in Figure 2. The results show that both cell growth and ethanol production were completed within 24 to 30 h for all inoculum concentrations.
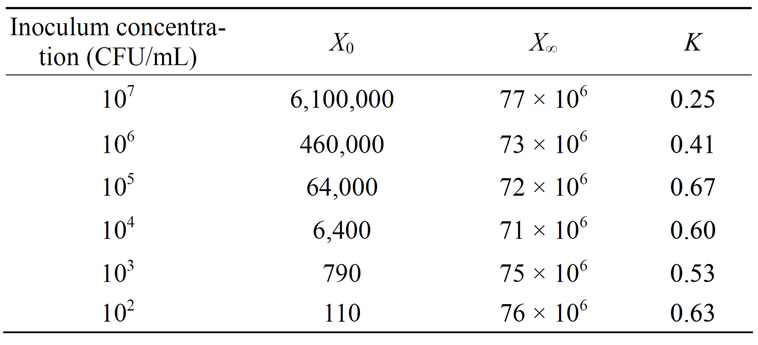
Table 1. Logistic cell growth model parameters obtained from S. cerevisiae characterization for inoculum concentrations from 102 to 107 CFU/mL.
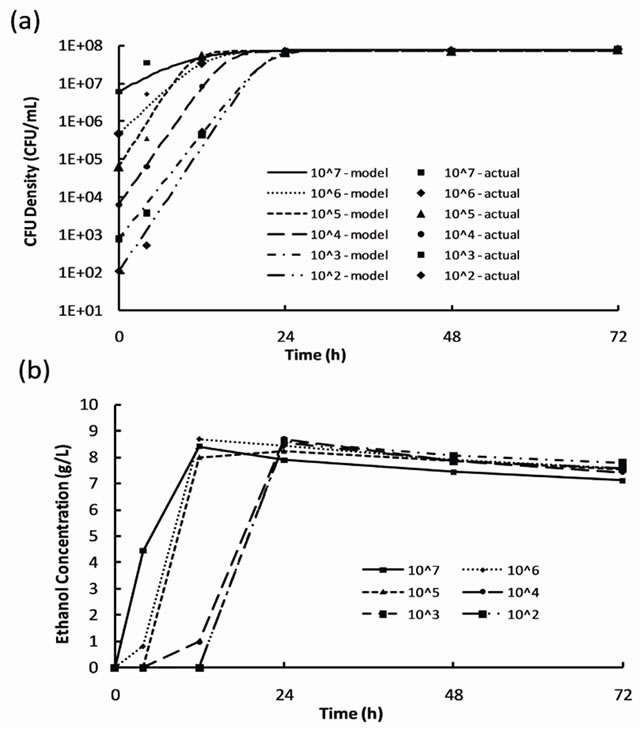
Figure 2. Results of S. cerevisiae characterization experiments for inoculum concentrations from 102 to 107 CFU/mL: (a) cell growth data and growth models and (b) ethanol production.
3.2. Within 24 to 30 h for All Inoculum Concentrations
2% dextrose loading magnetic fermentation cell growth was modeled with the logistic growth model [9]. The model parameters for all data sets are listed in Table 2" target="_self"> Table 2. A plot of cell growth data, growth models and ethanol concentration versus time for the control and experimental groups are shown in Figure 3" target="_self"> Figure 3. Cell growth data shown in Figure 3(a) suggest no significant difference (P-value > 0.05) between the control group and experimental groups in terms of growth rate and final CFU concentration. Figure 3" target="_self"> Figure 3(b) shows that ethanol production begins sometime between hours 10 and 15 for all groups, after the CFU density surpasses approximately 105 CFU/mL. The peaks in ethanol concentration at hour 20 were used to calculate ethanol yields of 86.9%, 86.6%, and 94.6% of the theoretical yield for the control, HMF, and NHMF groups, respectively. The peak ethanol concentration increased by approximately 8% of the
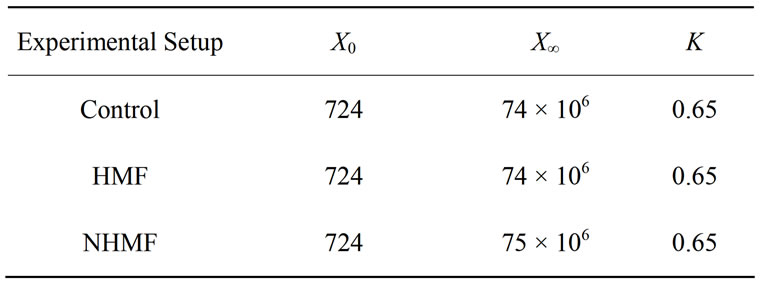
Table 2. Logistic cell growth model parameters from 2% dextrose loading magnetic fermentation experiments reveal no significant difference between the cell growth of the control and experimental groups.
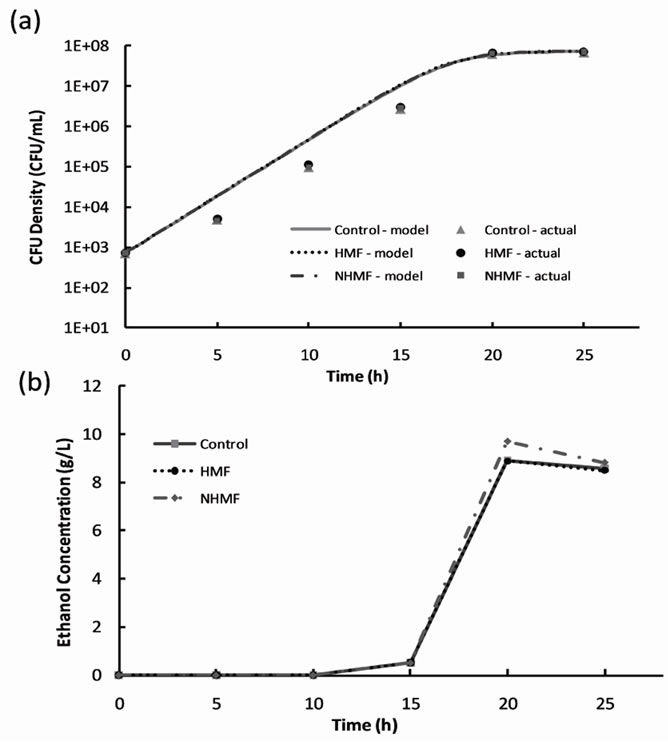
Figure 3. Results of 2% dextrose loading magnetic fermentation experiments: (a) cell growth data and growth models and (b) ethanol production.
theoretical yield for the NHMF group compared to the control and HMF groups. Statistical analysis of the ethanol data using the general linear model procedure confirmed no significant difference between the peak ethanol production of the control, HMF and NHMF groups (P-value > 0.05).
3.3. 6% Dextrose Loading Magnetic Fermentation
The HMF was excluded from the experimental tests because it produced no significant effects during 2% dextrose loading magnetic fermentation experiments. The 6% dextrose loading magnetic fermentation cell growth was modeled with the logistic growth model; the model parameters for all data sets are listed in Table 3. A plot of cell growth data, growth models and ethanol production versus time for the control and experimental groups are shown in Figure 4. Similar to the 2% dextrose loaded experiments, the cell growth data shown in Figure 4(a) suggests no significant difference (P-value > 0.05) between the cell growth of the control group and
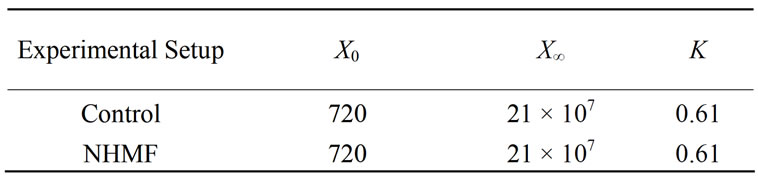
Table 3. Logistic cell growth model parameters from 6% dextrose loading magnetic fermentation experiments reveal no significant difference between the cell growth of the control and experimental groups.
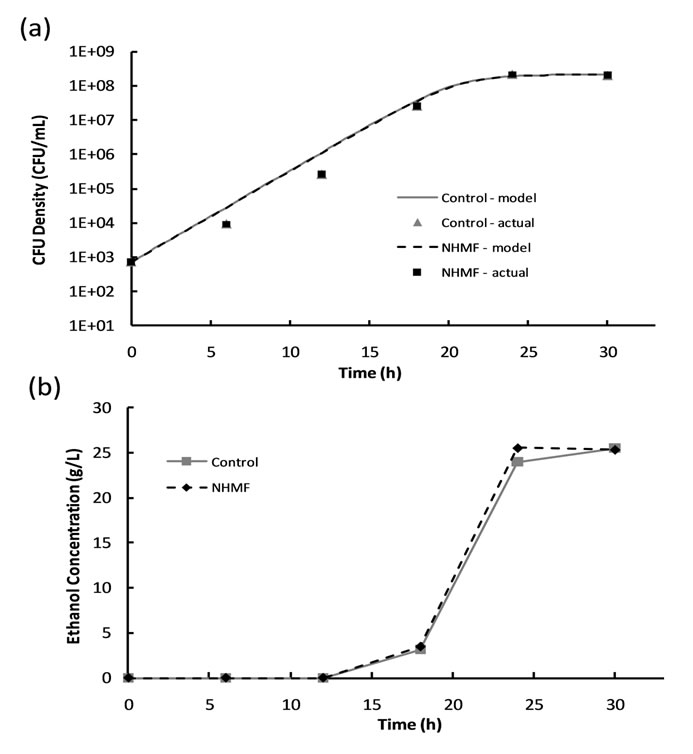
Figure 4. Results of 6% dextrose loading magnetic fermentation experiments: (a) cell growth data and growth models and (b) ethanol production.
experimental group. Figure 4(b) shows that ethanol production begins sometime between hours 12 and 18, after the CFU density surpasses approximately 3 × 10⁵ CFU/ mL. The peak in ethanol concentration at hour 24 was used to calculate an ethanol yield of 83.0% of the theoretical yield for the NHMF group, and the peak at hour 30 was used to calculate an ethanol yield of 82.9% of the theoretical yield for the control group. This suggests that there is no significant difference (P-value > 0.05) between the peak ethanol concentrations of the NHMF group and the control group, despite a possible increase in ethanol production rate as indicated by the NHMF ethanol concentration peak occurring before the control peak. Analysis of the ethanol data using the general linear model procedure confirms no significant difference (P-value > 0.05) between the two groups.
The goal of our magnetic fermentation experiments was to determine the effects of magnetic field on cell growth and ethanol production. Magnetic field induced enhancement of ethanol production rate was observed previously [1,2]. We hypothesized that magnetic field enhancement could also result in the reduction of ethanol production lag time, making it necessary to choose a low inoculum concentration. In this regards, Reference [1] had also observed increased cell growth rate under magnetic fermentation. We further hypothesized that magnetic field enhancement could result in a change in the CFU growth rate, making it again necessary to choose an inoculum concentration that exhibits logistic growth over a large time window. Both of these traits were demonstrated by our results of the 103 CFU/mL inoculum concentration data; thus, it was selected as the inoculum concentration for the magnetic fermentation experiments. This chosen cell concentration is in accordance with previous work [1] which inoculated the fermentations with 6 × 10⁴ cells per 120 mL of growth medium.
Our cell growth results in the 2% dextrose loading magnetic fermentation experiments showed no increase in cell growth rate under magnetic fields. These results are in contrast to those reported previously [1,3] where static magnetic fields on the order of hundreds of mT significantly affected cell growth when compared to a control setup. Our ethanol production data for the 2% dextrose loading magnetic fermentation suggests some possible scenarios: The results may indicate that nonhomogeneous static magnetic fields promote (8% increase over the control data) enhancement in ethanol production while homogeneous static magnetic fields do not. This case partially supports the enhanced ethanol production reported previously [1,2] in the presence of non-homogeneous static magnetic fields of 220 mT and 5 or 20 mT, respectively. However, Reference [1] also reported magnetically enhanced cell growth which contradicts the results of our experiment. Another scenario is that ethanol production enhancement is a function of magnetic field strength, which would require conducting tests at various magnetic fields. Our cell growth results of the 6% dextrose loading magnetic fermentation experiments also showed no increase in cell growth rate under magnetic fields. These results are in contrast to previous reports [1] where a non-homogeneous static magnetic field on the order of hundreds of mT significantly enhanced cell growth when compared to a control group with no magnetic fields. Our analysis of ethanol production for this experiment indicates no statistically significant difference between the experimental and control groups.
This study provides some key insights into the role of experimental parameters in magnetic fermentation. We quantified the cell proliferation with a wide range of initial inoculum and found the optimum value of cell density to conduct the magnetic fermentation experiments. This point has been largely ignored by previous researchers who conduct their experiments at one initial inoculum concentration. We think that, to adequately quantify the cell growth rate, a relatively small cell density is needed where we can observe the time lag before the progression of ethanol production. If the initial cell density is high (over 106 cell/mL as used in [4-7]), there is minimal lag time whereas a high cell density results in a longer lag time which may span beyond the experimental timeframe (~24 hours). Besides testing different inoculum concentrations, our experiments were conducted with two different sugar loading concentrations to test whether the initial sugar concentration has an effect on the progression of ethanol fermentation. Previous groups conducted their tests on magnetic fermentation with one (~2% dextrose) sugar loading [5]. In addition, we tested two configurations of static magnetic field: homogeneous and non-homogeneous. While the homogeneous field was created by a single magnet, the non-homogeneous field was created by a set of four magnets. We measured the spatial distribution of the field lines around the test setup to ensure the field is applied throughout the beaker having the culture media. We chose to use static magnetic fields in both configurations to avoid any joule heating from using a.c. magnetic fields. Previous studies using static magnetic fields have used the static homogeneous configuration, while nonhomogeneous a.c. fields were created by solenoid coils. We attempted to carefully calibrate the fermentation runs with several repeats, fitting with a model, and statistical analysis. We measured different parameters (cell growth rate, ethanol production and sugar consumption) over the time period of experimentation and fitted the cell growth data to a growth model to extract the theoretical parameters. Each experiment on fermentation kinetics was conducted three times, each time with six fermentation runs. Statistical analysis on the measured data was then used to calculate the P-values.
Some interesting points can be inferred from our experiments. First, the initial inoculum concentration affects the measured parameters of fermentation kinetics. As shown in Figure 2, an inoculum concentration above 104 cell/mL provides a small lag time to notice the significant rise in ethanol production from the initial zero value. Second, a lower sugar loading (2%) shows better results on the effects of magnetic field than a higher sugar loading (6%) where any biological effects from yeast may appear suppressed. Third, non-homogeneous static magnetic fields have a more pronounced effect on magnetic fermentation compared to homogeneous static magnetic fields. It may be reasonable to assume that yeast cells are responding (or stimulating) more favorably to non-homogeneous fields than homogeneous fields, consistent with their applications in microfluidic devices for trapping and sorting single cells. Unlike test tubes, we preferred to use large-volume beakers (150 mL) placed on a stirrer which offers greater oxygen supply and enhances proliferation. Future experiments will assess the optimum combination of physical and biological parameters on the magnetically-induced stimulation of yeast cells towards improving the efficiency of magnetic fermentations for large-scale industrial application.
4. CONCLUSIONS
The fermentation kinetics of S. cerevisiae was characterized by conducting a series of fermentations with starting cell concentrations from 102 to 107 CFU/mL. It was found that a starting cell concentration of approximately 103 CFU/mL exhibited consistent logistic cellular growth and a notable time lag (~10 hours) in ethanol production, which are both desirable traits for observing the effects of magnetic fermentations. Magnetic fermentation tests with homogeneous and non-homogeneous static magnetic fields showed that cellular growth was unaffected by static magnetic fields. This observation was consistent across the two fermentation medium dextrose loadings. Experimental results show an 8% increase in peak ethanol concentration (from 86.9% of theoretical yield in control setup to 94.6% of theoretical yield in experimental setup) during non-homogeneous static magnetic field enhanced fermentations with 2% dextrose loading. The ethanol yield with homogeneous static magnetic field was relatively unchanged compared to control experiments. Together, the results of our study suggest that ethanol productivity during magnetic fermentation can be enhanced using non-homogeneous static magnetic fields. Translating these preliminary results to large-scale industrial application would require more experimental runs to characterize the underlying role of non-homogeneous static magnetic fields in regulating fermentation kinetics.
REFERENCES
- Motta, M.A., Muniz, J.B.F., Schuler, A. and Da-Motta, M. (2004) Static magnetic fields enhancement of Saccharomyces cerevisiae ethanolic fermentation. Biotechnology Progress, 20, 393-396. doi:10.1021/bp034263j
- Perez, V.H., Reyes, A.F., Justo, O.R., Alvarez, D.C. and Alegre, R.M. (2007) Bioreactor coupled with electromagnetic field generator: Effects of extremely low frequency electromagnetic fields on ethanol production by Saccharomyces cerevisiae. Biotechnology Progress, 23, 1091-1094.
- Motta, M.A., Montenegro, E.J.N., Stamford, T.L.M., Silva, A.R. and Silva, F.R. (2001) Changes in Saccharomyces cerevisiae development induced by magnetic fields. Biotechnology Progress, 17, 970-973. doi:10.1021/bp010076e
- Mehedintu, M. and Berg, H. (1997) Proliferation response of yeast Saccharomyces cerevisiae on electromagnetic field parameters. Bioelectrochemistry and Bioenergetics, 43, 67-70. doi:10.1016/S0302-4598(96)05184-7
- Ruiz-Gomez, M.J., Prieto-Barcia, M.I., Ristori-Bogajo, E. and Martinez-Morillo, M. (2004) Static and 50 Hz magnetic fields of 0.35 and 2.45 mT have no effect on the growth of Saccharomyces cerevisiae. Bioelectrochemistry, 64, 151-155. doi:10.1016/j.bioelechem.2004.04.003
- Ostabe, E.S., Kuroki, S., Nikawa, J., Matsumoto, Y., Ooba, T., Kiso, K. and Hayashi, H. (2009) Yeast cells proliferation on various strong static magnetic fields and temperatures. Journal of Physics: Conference Series, 156, 1-8.
- Iwasaka, M., Ikehata, M., Miyakoshi, J. and Ueno, S. (2004) Strong static magnetic field effects on yeast proliferation and distribution. Bioelectrochemistry, 65, 59- 68. doi:10.1016/j.bioelechem.2004.04.002
- Ismail, A.A. and Ali, A.M.M. (1971) Selection of high ethanol-yielding Saccharomyces. Folia Microbiology, 16, 346-349. doi:10.1007/BF02875751
- Schuler, M.L. and Kargi, F. (2001) Bioprocess engineering: Basic concepts. 2nd Edition, Prentice Hall PTR, Upper Saddle River.