Modern Economy
Vol.5 No.4(2014), Article ID:44528,10 pages DOI:10.4236/me.2014.54030
The Association between Commonality in Liquidity and Corporate Disclosure Practices in Taiwan
Alpha Lowe
Department of Finance, Feng Chia University, Taichung, Chinese Taipei
Email: halowe@fcu.edu.tw
Copyright © 2014 by author and Scientific Research Publishing Inc.
This work is licensed under the Creative Commons Attribution International License (CC BY).
http://creativecommons.org/licenses/by/4.0/


Received 8 January 2014; revised 8 February 2014; accepted 15 February 2014
ABSTRACT
With a sample of stocks listed on the Taiwan stock exchange (TWSE), this paper examines whether a firm’s disclosure practices influence its institutional ownership and inclusion of ETFs and, hence, its commonality in liquidity. Using the grade of Taiwan SFI’s Information Disclosure and Transparency Rankings System (IDtrs) as a proxy for corporate disclosure practices, my findings robustly indicate that TWSE-listed stocks with good (bad) corporate disclosure practices exhibit high (low) commonality in liquidity. I further show that this positive disclosure-commonality relation can be partly attributed to institutional investing and index trading. Overall, consistent with a demandside explanation of commonality in liquidity, I conclude that stocks with good (bad) disclosure practices would have a high (low) likelihood of institutionalization and indexation, which should imply a high (low) commonality in their liquidity.
Keywords:Commonality in Liquidity, Disclosure Practices, IDtrs, Institutional Ownership, Index Trading

1. Introduction
As proposed first by Chordia et al. [1] , individual stock liquidity co-moves with marketand industry-wide liquidity. The existence of liquidity commonality is now widely accepted (e.g., Karolyi et al. [2] ) and motivates the development of asset pricing model (e.g., Acharya and Pedersen [3] , Kamara et al. [4] , and Korajczyk and Sadka [5] ). Current literature focuses on the fundamental determinants of liquidity commonality. Building upon the demand-side hypothesis that institutional investing and index-related basket trading increase co-movement in stock liquidity (Kamara et al. [4] , Koch et al. [6] , Corwin and Lipson [7] , and Karolyi et al. [2] ), this paper contributes to the literature by studying whether a firm’s disclosure practices influence its institutional ownership and inclusion of ETFs and, hence, its commonality in liquidity.
There are several interesting and important reasons to use the Taiwan stock market as a sample to investigate the impact of corporate disclosure practices on liquidity commonality. First, since 2003, Taiwan’s Securities and Futures Institute (SFI) introduce the Information Disclosure and Transparency Rankings System (IDtrs) to evaluate the level of corporate transparency. By placing a great focus on the IDtrs, TWSE-listed companies could improve disclosure practices and enable investors to better protect their interests. As a result, it is expected that higher (lower) IDtrs rank stocks would attract more (fewer) institutional investors, who are usually required to satisfy the prudent man rule (Kamara et al. [4] ). Bushee and Noe [8] also suggest that, to reduce monitoring costs, institutional investors prefer firms with better disclosure rankings.
Second, the first tradable index for the Taiwan stock market, the FTSE TWSE Taiwan 50 Index (henceforth TW50 index), select the top 50 stocks by market capitalization, free float, and liquidity. Given the fact that higher (lower) IDtrs rank stocks tend to exhibit greater (smaller) corporate transparency, which should imply a high liquidity (Healy et al. [9] ), it is expected that stocks with higher (lower) IDtrs rank are more (less) likely to be included in ETFs such as TW50 index.
Third, prior literature has documented significant co-movement in liquidity among stocks listed on the Taiwan stock market (e.g., Lee et al. [10] , Brockman et al. [11] , and Karolyi et al. [2] ). However, there is little evidence of the determinants of liquidity commonality in this market. My findings, therefore, contribute to liquidity commonality literature by filling this gap.
As suggested by prior literature, the trading behavior of institutional investors and index-related basket trading play a key role in explaining commonality in liquidity (e.g., Kamara et al. [4] , Koch et al. [6] , Corwin and Lipson [7] , and Karolyi et al. [2] ). For example, Kamara et al. [4] suggest that the divergence of liquidity commonality in the cross-section of U.S. stocks can be attributed to the substantial increase in institutional investing and index trading. Focusing on correlated trading of mutual funds, Koch et al. [6] find that the liquidity of stocks with high mutual fund ownership experiences strong commonality.
Motivated by the suggestion above, I hypothesize that corporate disclosure practices would be positively related to institutionalization and indexation, which drive a correlated increase in the demand for liquidity and hence a high commonality in liquidity. My hypothesis therefore predicts that good (bad) corporate disclosure practices would be related to high (low) commonality in liquidity.
With a sample of common stocks listed on the Taiwan Stock Exchange (TWSE) during 2005-2012, I show that, in the cross-section of TWSE-listed stocks, the sensitivity of individual stock liquidity to market liquidity shocks increases with corporate disclosure practices. That is, TWSE-listed stocks with good (bad) disclosure practices exhibit high (low) commonality in liquidity. The discovery of this positive disclosure-commonality relation is important as it implies a possible demand-side explanation (i.e. institutional investing and index/basket trading) for liquidity commonality.
To confirm this possibility, I further examine the institutional ownership and the inclusion of TW50 index across portfolios grouped by disclosure practices. My univariate results indicate that the average institutional ownership and fraction of TW50 index inclusion monotonically increase with corporate disclosure practices, suggesting stocks with good (bad) disclosure practices tend to be held more (less) by TWSE three major institutional investors and be included in the TW50 index.
Given the fact that institutional holding/investing and index trading are more concentrated in stocks with good disclosure practices stocks than in stocks with bad disclosure practices, I also examine the impacts of institutional ownership and TW50 index inclusion on liquidity commonality across portfolios grouped by disclosure practices. My regression results show that the positive impacts of institutional ownership and TW50 index inclusion on liquidity commonality are stronger among stocks with good disclosure practices, which tend to be those stocks most favored by TWSE institutional investors or included in the ETFs of TW50 index. In contrast, I find that the institutional ownership and TW50 index inclusion have no significant effects on liquidity commonality among stocks with bad disclosure practices, which is not surprising because this type of stocks are less likely to be the constitutes of TW50 index and to be traded/held by TWSE institutional investors.
The overall conclusion of this paper is that, in a sample of the Taiwan stock market, stocks with good (bad) disclosure practices will exhibit a high (low) likelihood of institutionalization and indexation and thus a high (low) commonality in their liquidity, which is consistent with the demand-side explanation of commonality in liquidity.
The rest of the paper is organized as follows. Section 2 contains a data description and a measure of liquidity commonality. Section 3 presents the association between commonality in liquidity and corporate disclosure practices, using a univariate analysis and a regression analysis. Section 4 tests the role of institutionalization and indexation in explaining why stocks with good (bad) disclosure practices have high (low) liquidity commonality. Section 5 concludes the paper.
2. Data Description
2.1. Sample Selection
The primary data source for my sample of stocks listed on the Taiwan stock market is the Taiwan Economic Journal (TEJ) over the period 2005-2012. To measure the firm-year commonality in liquidity, I collect the daily stock return, daily dollar trading volume, and daily market capitalization from the TEJ. To measure corporate disclosure practices for individual stocks, I download firm-year grade of Information Disclosure and Transparency Rankings System (IDtrs) from Taiwan’s Securities and Futures Institute (SFI). Since my focus is the implication of corporate disclosure practices for institutionalization and indexation, I require institutional ownership data and constitutes of the FTSE TWSE Taiwan 50 Index. After deleting stocks with missing data, my final sample comprises a total of about 5,200 firm-year observations.
2.2. Measuring Commonality in Liquidity
Following Chordia et al. [1] and Kamara et al. [4] , I define commonality in liquidity as the sensitivity of individual stock liquidity to market liquidity shocks. In particular, I run the following time-series regression for each stock i for each year t:
 (1)
(1)
where  is my first proxy for commonality in liquidity for stock i in year t, which measures the sensitivity of changes in stock i’s liquidity to changes in market liquidity. Stock i is dropped from the market portfolio when estimating its
 .
.  is stock i’s daily change in Amihud’s [12] illiquidity measure on day d of year t.
  is daily change in value-weighted market illiquidity measure on day d of year t.
As suggested by Hameed et al. [13] , the R2 statistics of the regression model in Equation (1) also can be used to measure commonality in liquidity. I therefore store the R2 statistics estimated from Equation (1) as my second proxy of commonality in liquidity (denoted as ).
).
As robustness, I follow Chordia et al. [1] to generate another beta-based measure of commonality in liquidity by controlling for any lagged adjustment in commonality, the volatility in individual stock returns, and the effect of daily market return. Particularly, I run the following time-series regression for each stock i for each year t:
 (2)
(2)
where  is my third proxy for commonality in liquidity for stock i in year t, which measures the sensitivity of changes in stock i’s liquidity to changes in market liquidity by controlling for any lagged adjustment in commonality, the volatility in individual stock returns, and daily market return.
  and
and are daily change in value-weighted market illiquidity on day d + 1 and d − 1 of year t, respectively, which are incorporated to capture any lagged adjustment in commonality.
  is the daily change in stock i’s squared stock return on day d of year t, which is used to measure the change in return volatility.
 ,
,  , and
, and  are daily market returns (proxied by the return of the Taiwan Stock Exchange Weighted Index (TAIEX)) on day d, d + 1, and d − 1 of year t, respectively.
2.3. Descriptive Statistics
Table 1 summarizes descriptive statistics on the main variables used in this paper. For the TWSE-listed stocks during 2005-2012, the average sensitivity of changes in individual stock liquidity to market liquidity shock ( )
)

Table 1. Descriptive Statistics. This table summarizes descriptive statistics on the main variables for the Taiwan Stock Exchange (TWSE) listed common stocks during 2005-2012. Commonality in liquidity is proxied by three measures: β1, β2, and RSQ , which areestimated from Equation (1) and (2). CDP is the score of corporate disclosure practices. Taiwan SFI’s Information Disclosure and Transparency Rankings System (IDtrs) ranks TWSE-listed stocks as Grade A++, A+, A, A-, B, C, and C-. I define CDP as 5 if stocks are ranked as A++ or A+; 4 if stocks are ranked as A or A-; 3 if stocks are ranked as B; 2 if stocks are ranked as C; and 1 if stocks are ranked as C-. IO is total ownership by TWSE three major institutional investors (QFIIs, mutual funds, and securities dealers). TW50 is an indicator variable if stocks are the constituents of the FTSE TWSE Taiwan 50 Index. MV is the year-end market value. TURN is the time aggregate of daily share turnover over the year. ILLIQ is the average of Amihud’s [12] daily return-to-volume illiquidity measures over the year. Firm-year observations (N) change due to data unavailability. Data on CDP is collected from Taiwan’s SFI and other variables are collected from the TEJ.
is 0.615. After controlling for any lagged adjustment in commonality, the volatility in individual stock returns, and the market return, the average sensitivity ( ) declines to 0.316. When I set corporate disclosure practices (CDP ) as 5 if stocks’ IDtrs are ranked as A++ or A+; 4 if stocks’ IDtrs are ranked as A or A-; 3 if stocks’ IDtrs are ranked as B; 2 if stocks’ IDtrs are ranked as C; and 1 if stocks’ IDtrs are ranked as C-, I find that the average of CDP is 3.179, suggesting that on average, TWSE-listed companies have relatively good disclosure practices. Also, the average ownership held by TWSE three major institutional investors is about 14.46%.
3. Commonality in Liquidity and Corporate Disclosure Practices
3.1. Univariate Analysis
To examine the association between commonality in liquidity and corporate disclosure practices, I start with my univariate analysis. Table 2 presents the average degree of liquidity commonality for portfolios grouped by corporate disclosure practices (CDP) at the end of previous year. As shown in Panel A of Table 2, for the whole sample, TWSE-listed stocks with good (bad) disclosure practices tend to have high (low) commonality in liquidity. This finding is robust to each proxy of commonality in liquidity. For example, good (bad) disclosure practices stocks have a positive average β2 of 0.511 (0.236), which leads to a statistically significant difference in average of 0.275 at the 1% level.
To see the patterns of positive CDP-commonality relation more clearly, I plot the average commonality in liquidity for each of CDP portfolios. As shown in Figure 1, commonality in liquidity increases monotonically with the quality of a firm’s disclosure practices, suggesting that good-CDP(bad-CDP) stocks have more (less) sensitive to market-wide liquidity variations.
To ensure that the effect of corporate disclosure practices (CDP) is not driven by firm size, I examine the
Table 2. Average of Liquidity Commonality across CDP Groups. This table reports the average degree of liquidity commonality for portfolios grouped by corporate disclosure practices (CDP) at the end of previous year. The sample consists of the Taiwan Stock Exchange (TWSE) listed common stocks during 2005-2012. Panel A (B) reports the results for the whole sample (two firm-size sorted subsamples). In panel B, stocks are first grouped into two portfolios based on their firm size (MV) at the end of previous year. Within each of MV portfolios, I then group stocks into 5 portfolios (denoted as HIGH, Q4, Q3, Q2, and LOW) based on their corporate disclosure practices (CDP) at the end of previous year. Commonality in Liquidity is proxied by three measures: β1, β2, and RSQ, which are estimated from Equation (1) and (2). Differences in average between HIGH and LOW are assessed using a t-test and their corresponding t-statistics are reported in parentheses. ***, **, and * separately represent 1%, 5%, and 10% significance levels. Data on CDP is collected from Taiwan’s SFI and other variables are collected from the TEJ.
average commonality in liquidity for CDP portfolios, controlling for firm size. In particular, I first sort stocks into two portfolios (denoted as Large and Small) based on their firm size (MV) at the end of previous year. Within each of MV portfolios, I then group stocks into 5 portfolios (denoted as HIGH, Q4, Q3, Q2, and LOW) based on their CDP at the end of previous year. As a result, the average liquidity commonality across 10 (2 × 5) MV-CDP portfolios are calculated. Panel B of
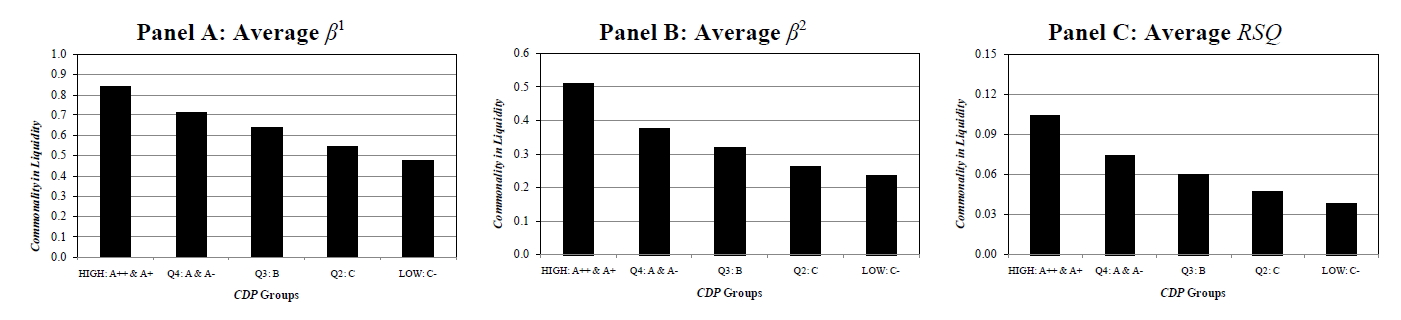
Figure 1. Average of liquidity commonality across CDP Groups.
3.2. Regression Analyses
In this subsection, I test the relation between corporate disclosure practices and liquidity commonality using a multivariate regression analysis. Following Kamara et al. [4] , the regression equation is given as follows:
 (3)
(3)
where  is stock i’s liquidity commonality measures in year t:
 ,
,  , and
, and , which are estimated from Equation (1) and (2).
  is stock i’s score of corporate disclosure practices in year t − 1. Taiwan SFI’s Information Disclosure and Transparency Rankings System (IDtrs) ranks TWSE-listed stocks as Grade A++, A+, A, A-, B, C, and C-. I define
  as 5 if stocks are ranked as A++ or A+; 4 if stocks are ranked as A or A-; 3 if stocks are ranked as B; 2 if stocks are ranked as C; and 1 if stocks are ranked as C-. As robustness,
  is also used as a main independent variable, where
  is an indicator variable which equals to 1 if stocks are ranked as Grade A++, A+, A or A-, and 0 otherwise.
  is stock i’s market value at the end of year t − 1.
  is the stock i’s annualized share turnover in year t − 1.
  is stock i’s average of Amihud’s [12] daily return-to-volume illiquidity measures in year t − 1.
  are year dummies.
Table 3 reports the results of estimating regression (3). In the first two columns, I show the impact of my two primary measures of disclosure practices ( and
and ) on the liquidity commonality (proxied by
 ). I find that corporate disclosure practices is significantly and positively associated with liquidity commonality, after controlling for firm size (
 ), turnover (
 ), and liquidity (
 ) that could affect commonality. The coefficient on
  (
( ) is 0.0571 (0.0732) with a significance at 1% level. When I use
  as a dependent variables in model (2a) and (2b); and use
  as a dependent variables in model (3a) and (3b), the coefficients on
  and
and  is consistently positive and significant.
Consistent with the univariate results in Table 2, the overall results in Table 3 suggest again that TWSEstocks with good (bad) corporate disclosure practices have more (less) sensitive to market-wide liquidity variations, after controlling for potential determinants of commonality such as firm size, turnover, and liquidity.
4. Why Do Stocks with Good (Bad) Disclosure Practices Have High (Low) Liquidity Commonality?
So far, my findings robustly suggest that stocks with good (bad) corporate disclosure practices have high (low) commonality in liquidity. Motivated the view that indexation and institutionalization could have different effects on the behavior of good disclosure practices stocks than on the behavior of bad disclosure practices stocks, this section is devoted to understanding why corporate disclosure practices is positively associated with commonality in liquidity.
If the positive disclosure-commonality relation can be attributed to the indexation and institutionalization, it should be seen that stocks with good (bad) disclosure practices are held more (less) by institutional investors and are more (less) possibly to be included in the ETFs of TW50 index. I begin my analysis of this possibility by comparing the institutional ownership and the TW50 index inclusion of good disclosure practices stocks with those of bad disclosure practices stocks.
Table 4 reports the average institutional ownerships ratio (IO) and fraction of the constituents of the FTSE TWSE Taiwan 50 Index (TW50) across CDP portfolios. The evidence in Table 4 indicates that relative to bad disclosure practices stocks, good disclosure practices stocks exhibit higher institutional ownerships ratio (IO)
Table 3. Regression Analysis of CDP in Explaining Commonality in Liquidity. This table reports regressions results of CDP in explaining liquidity commonality in the cross section for the Taiwan Stock Exchange (TWSE) listed common stocks during 2005-2012. Following Kamara et al. [4] , the regression equation is given as Equation (3).
Table 4. Average of IO and TW50 across CDP Groups. This table reports the average institutional ownerships (IO) and fraction of the constituents of the FTSE TWSE Taiwan 50 Index (TW50) for portfolios grouped by corporate disclosure practices (CDP) at the end of previous year. The sample consists of TWSE listed common stocks during 2005-2012. Taiwan SFI’s Information Disclosure and Transparency Rankings System (IDtrs) ranks TWSE-listed stocks as Grade A++, A+, A, A-, B, C, and C-. I define that HIGH contains stocks with grade A++ or A+; Q4 contains stocks with grade A or A-; Q3contains stocks with grade B; Q2contains stocks with grade C; and LOW contains stocks with grade C-. IO is total ownership by TWSE three major institutional investors (QFIIs, mutual funds, and securities dealers). TW50 is an indicator variable if stocks are the constituents of the FTSE TWSE Taiwan 50 Index. Differences in IO and TW50 between HIGH and LOW are assessed using a t-test and their corresponding t-statistics are reported in parentheses. ***represents 1% significance levels. Data on CDP is collected from Taiwan’s SFI and other variables are collected from the TEJ.
and tend to be included in TW50 ETFs. A t-test rejects the equality of average IO and TW50 for the good and bad disclosure practices stocks (the difference in average IO (TW50) between good and bad disclosure practices stocks is 21.907% (0.394) with a t-statistic of 11.32 (9.90)). I also plot the average IO and TW50 across CDP portfolios in Figure 2. From Figure 2, it is more clearly to see that institutional ownerships (IO) and fraction of TW50 monotonically increase with corporate disclosure practices.
Given the fact that institutional investing and index trading are more concentrated in good disclosure practices stocks than in bad disclosure practices stocks, it is expected that the positive impacts of institutional ownership and TW50 index inclusion on commonality in liquidity are stronger (weaker) among stocks with good (bad) disclosure practices.
To provide further evidence on this issue, I estimate regressions of IO and TW50 in explaining liquidity commonality across CDP groups:
Panel A: IO by CDP Groups Panel B: TW50 by CDP Groups


Figure 2. Average of IO and TW50 across CDP Groups.
 (4)
(4)
where  is stock i’s liquidity commonality measures in year t, which is estimated from Equation (2).
  is stock i’s total ownership by TWSE three major institutional investors (QFIIs, mutual funds, and securities dealers) in year t − 1.
  is an indicator variable if stock i is the constituent of the FTSE TWSE Taiwan 50 Index in year t − 1.
  is stock i’s market value at the end of year t − 1.
  is the stock i’s annualized share turnover in year t − 1.
  is stock i’s average of Amihud’s [12] daily return-to-volume illiquidity measures in year t − 1.
  are year dummies. The t-statistics based on standard errors robust to clustering by firm are reported.
The regression results in Table 5 indicate that compared to stocks with bad disclosure practices, the positive impacts of institutional ownership and TW50 index inclusion on liquidity commonality are stronger among stocks with good disclosure practices. For example, when I combine  and
and  as main independent variables into regression in model (3a) and (3c), the coefficients on
  and
and  are 0.1505 (t = 3.16) and 0.0863 (t = 3.27) with significances at 1% level, respectively, among stocks in HIGH
  group, while the coefficients on
  and
and  are 0.0840 (t = 1.42) and −0.1079 (t = −0.91), respectively, among stocks in LOW
  group.
In sum, consistent with the expectation, the positive impacts of institutional ownership and TW50 index inclusion on liquidity commonality are stronger among stocks with good disclosure practices, which tend to be those stocks most favored by TWSE institutional investors or included in the TW50 index. Nevertheless, the institutional ownership and TW50 index inclusion have no significant effects on liquidity commonality among stocks with bad disclosure practices, which is not surprising because this type of stocks are less likely to be the constitutes of TW50 index and to be traded/held by TWSE institutional investors.
5. Conclusions
Previous studies have found that individual stock liquidity co-moves with market-wide liquidity shock and that this commonality in liquidity can be partly explained by demand-side forces: institutional investing and index trading. In this paper, I extend this literature by analyzing whether a firm’s disclosure practices influence its institutional ownership and inclusion of ETFs and, hence, its commonality in liquidity. Using the grade of Taiwan SFI’s Information Disclosure and Transparency Rankings System (IDtrs) as a proxy for corporate disclosure practices, my findings robustly indicate that TWSE-listed stocks with good (bad) disclosure practices exhibit high (low) commonality in liquidity.
Why does good (bad) disclosure practices stocks’ liquidity experience more (less) sensitivity to market liquidity shock? My analysis indicates that good (bad) disclosure practices stocks tend to be held more (less) by TWSE institutional investors and are more (less) possibly to be included in the FTSE TWSE Taiwan 50 Index. As a result, the institutionalization and indexation are more (less) prevalent in stocks with good (bad) disclosure practices, which should imply a high (low) commonality in liquidity. Evidently, I also show that that compared to stocks with bad disclosure practices, the positive impacts of institutional ownership and TW50 inclusion on liquidity commonality are stronger among stocks with good disclosure practices, which tend to be those stocks
Table 5. The Impacts of IO and TW50 on Commonality Using Regressions across CDP groups. This table reports regressions results of IO and TW50 in explaining liquidity commonality across CDP groups for the Taiwan Stock Exchange (TWSE) listed common stocks during 2005-2012. Taiwan SFI’s Information Disclosure and Transparency Rankings System (IDtrs) ranks TWSE-listed stocks as Grade A++, A+, A, A-, B, C, and C-. For this regression analysis, I group my whole sample into three portfolios based on their information disclosure and transparency rankings grade at the end of previous year: HIGH contains stocks with A++, A+, A, or A-; MEDIUM contains stocks with B; and LOW contains stocks with C or C-. I then estimate the regression across CDP groups: , where
  is stock i’s liquidity commonality measures in year t, which is estimated from Equation (2).
  is stock i’s total ownership by TWSE three major institutional investors (QFIIs, mutual funds, and securities dealers) in year t − 1.
  is an indicator variable if stock i is the constituent of the FTSE TWSE Taiwan 50 Index in year t − 1.
  is stock i’s market value at the end of year t − 1.
  is the stock i’s annualized share turnover in year t − 1.
  is stock i’s average of Amihud’s [12] daily return-to-volume illiquidity measures in year t − 1.
  are year dummies. The t-statistics based on standard errors robust to clustering by firm are reported in parentheses. a, b, and c separately represent 1%, 5%, and 10% significance levels. Firm-year observations (N) change due to data unavailability. Data on CDP is collected from Taiwan’s SFI and other variables are collected from the TEJ.
most favored by TWSE institutional investors or included in the TW50 index.
To summarize, in a sample of stocks listed on the Taiwan stock market, stocks with good (bad) disclosure practices tend to exhibit a high (low) likelihood of institutionalization and indexation and, hence, a high (low) commonality in their liquidity, which is consistent with the demand-side explanation of commonality in liquidity.
References
- Chordia, T., Roll, R. and Subrahmanyam, A. (2000) Commonality in Liquidity. Journal of Financial Economics, 56, 3-28. http://dx.doi.org/10.1016/S0304-405X(99)00057-4
- Karolyi, G.A., Lee, K.H. and Van Dijk, M.A. (2012) Understanding Commonality in Liquidity around the World. Journal of Financial Economics, 105, 82-112. http://dx.doi.org/10.1016/j.jfineco.2011.12.008
- Acharya, V. and Pedersen, L. (2005) Asset Pricing with Liquidity Risk. Journal of Financial Economics, 77, 375-410. http://dx.doi.org/10.1016/j.jfineco.2004.06.007
- Kamara, A., Lou, X. and Sadka, R. (2008) The Divergence of Liquidity Commonality in the Cross-section of Stocks. Journal of Financial Economics, 89, 444-466. http://dx.doi.org/10.1016/j.jfineco.2007.10.004
- Korajczyk, R.A. and Sadka, R. (2008) Pricing the Commonality across Alternative Measures of Liquidity. Journal of Financial Economics, 87, 45-72. http://dx.doi.org/10.1016/j.jfineco.2006.12.003
- Koch, A., Ruenzi, S. and Starks, L. (2010) Commonality in Liquidity: A Demand-Side Explanation. Unpublished Working Paper, University of Texas at Austin and University of Mannheim, Austin and Mannheim.
- Corwin, S.A. and Lipson, M.L. (2011) Order Characteristics and the Sources of Commonality in Prices and Liquidity. Journal of Financial Markets, 14, 47-81. http://dx.doi.org/10.1016/j.finmar.2010.07.004
- Bushee, B.J. and Noe, C.F. (2000) Corporate Disclosure Practices, Institutional Investors, and Stock Return Volatility. Journal of Accounting Research, 38, 171-202. http://dx.doi.org/10.2307/2672914
- Healy, P., Hutton, A. and Palepu, K. (1999) Stock Performance and Intermediation Changes Surrounding Sustained Increases in Disclosure. Contemporary Accounting Research, 16, 485-520. http://dx.doi.org/10.1111/j.1911-3846.1999.tb00592.x
- Lee, J.H., Lin, S.Y., Lee, W.C. and Tsao, C.Y. (2006) Common Factors in Liquidity: Evidence from Taiwan’s OTC Stock Market. International Review of Financial Analysis, 15, 306-327. http://dx.doi.org/10.1016/j.irfa.2004.12.004
- Brockman, P., Chung, D.Y. and Pérignon, C. (2009) Commonality in Liquidity: A Global Perspective. Journal of Financial and Quantitative Analysis, 44, 851-882. http://dx.doi.org/10.1017/S0022109009990123
- Amihud, Y. (2002) Illiquidity and Stock Returns: Cross-Section and Time-Series Effects. Journal of Financial Markets, 5, 31-56. http://dx.doi.org/10.1016/S1386-4181(01)00024-6
- Hameed, A., Kang, W. and Viswanathan, S. (2010) Stock Market Decline and Liquidity. Journal of Finance, 65, 257- 293. http://dx.doi.org/10.1111/j.1540-6261.2009.01529.x