Wireless Engineering and Technology
Vol.2 No.1(2011), Article ID:3792,7 pages DOI:10.4236/wet.2011.21004
Experimental Analysis of a Node B Coverage Based on the CPICH and Ec/Io Values
![]()
Maestría en Ciencias en Ingeniería de Telecomunicaciones, Instituto Politécnico Nacional, Escuela Superior de Ingeniería Mecánica y Eléctrica, México City, México.
Email: svidalb@ipn.mx
Received November 8th, 2010; revised December 25th, 2010; accepted December 29th, 2010.
Keywords: WCDMA, Coverage Analysis, CPICH, Ec/Io
ABSTRACT
This paper presents experimental results of a coverage analysis in a WCDMA network using the 850 MHz band; an urban electromagnetic propagation environment is considered. Obtained coverage estimation maps are based on Krige statistical method of interpolation. Key performance parameters used in this work are the CPICH and Ec. The results could be used to identify problems and help to optimize cell coverage and capacity in a given service area.
1. Introduction
WCDMA (Wideband Code Division Multiple Access) is a technology of third generation 3G that increases data transmission rates by broadening the signal at the air interface through the Multiple Access Code Division Multiplexing instead of Time Division used by GSM systems. WCDMA supports multimedia services with very high speed and full-motion video, Internet access and videoconferencing. It also easily handles applications that make use intensively of bandwidth such as data and image transmission via Internet. In a communication system based on multiple access, an amount of users want to access the channel simultaneously. To implement a multiple access communication there are several techniques that allow users to share the channel. In the technique of multiple access code division (CDMA), users can access the channel simultaneously and share the same bandwidth. WCDMA is a spread spectrum technology [1], which expands the signals over a bandwidth of 5 MHz and is capable of carrying voice and data at the same time. These features allow a data rate of 384 Kbps in Release 5, and a transfer rate in the downlink of up to 2Mbps in the Release 6, which includes HSPA, and average processing speeds (for file downloads) of 220-320 Kbps [2]. Spread spectrum is a technique used to transmit data on a bandwidth considerably larger. Its basic foundation is the “widening” of the transmitted signal over a very wide frequency band, much wider than the minimum bandwidth required transmitting the information that you want to send. This higher bandwidth can be obtained by encoding information with a pseudo-random signal. The coded information is transmitted in the frequency that works for which the sender uses a much higher bandwidth than no encryption is used (direct sequence). The spreading operation is the multiplication of each bit of user data with a sequence of 8 bits of code, called chips [3,4].
Currently, WCDMA is the wireless access technology broadest deployed worldwide. WCDMA is a wide band system where the transmitted signal with a rate R is spread by combining it with a wideband spreading signal, creating a spread signal with a bandwidth W. The effective bandwidth for a WCDMA air interface is 3.84 MHz and with guard bands, as a result the required bandwidth is 5 MHz [4]. The WCDMA system uses several codes; when the signal is transmitted from the Base Station carries a unique code called Scrambling Code SC, used in the downlink direction for cell/sector separation. This SC is also employed in the uplink direction to separate every user from each other.
The Base Station (BS), also known as Node B, is part of the Network of Terrestrial Radio Access of UMTS (UTRAN). The Node B takes in charge several tasks such as: transmission and reception of radio signals, signal filtering, amplification, modulation and demodulation of the signal and be an interface to the controller of Radio Network (RNC) [1].
Common Pilot Channel (CPICH) transmits a carrier used to estimate the channel parameters. It is the physical reference for other channels. It is used for power control, transmission and coherent detection, channel estimation, measurement of adjacent cells and obtaining the scrambling code (Scrambling Code SC) [2]. Despite receiving a high power level, communication can be poor because of the interference effect. In these situations, UMTS is more tolerant than GSM, rather than producing a disconnection in communication leads to a reduction in transmission rate. This fact, however, produces an additional load on the radio channel. Power level is divided into different paths which, depending on the quality of the Rake receiver (included in the mobile phone), provide a greater or lesser number of signal components. In the case of obtaining different signal delays (delays), the orthogonality of the codes transmitted by a base station fades. This causes all the signals sent by the station, and in particular the signals from other subscribers, would have a high interference. [3]
The RSCP is the power value after the process of correlation/separation (dBm) and should be measured for each code. Denotes the power measured by a receiver on a physical channel communications in particular. It is used as an indicator of signal strength as a criterion for delivery in the downlink control energy and for calculating path loss. And can only be measured once the receiver has found the dominant pilot.
Interference is typically measured by the energy per chip to total received power (Ec/Io) of the CPICH, in other words, how clear is the signal received. Eb/Io is the ratio of energy per bit to interference after despreading. This value is the one that has direct effects on bit error rate. Ec/Io is only defined by the pilot channel, is measured before the despreading; all channels contribute to the total output of Io. Eb/Io is the energy per bit to noise spectral density, is the signal to (noise + interference) after despreading, from some channels except the pilot. There is a one to one relationship between Ec/Io of the pilot and Eb/No traffic channel. At one point in particular, the value of Ec/Io is almost constant, but the value of Eb/No is constantly changing due to forward link power control. The value of Ec/Io should be –9 dB or higher in 95% of the coverage area, as shown in Figure 7, for a UE could be associated with a Node B and could be able to establish a voice call.
2. Test Scenario
Measurements were done, along the test area, (Figure 1) using a BTS Master MT8222A, which is a spectrum
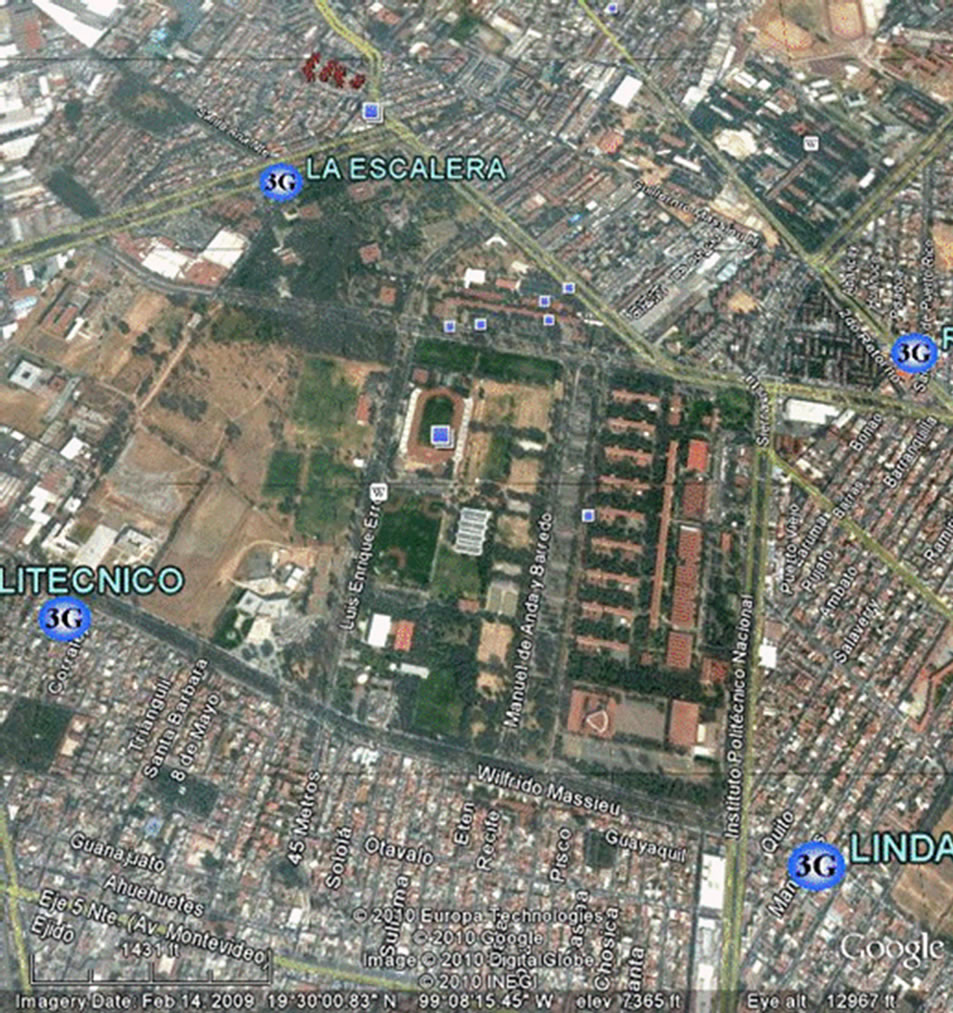
Figure 1. Area under analysis.
analyzer with advanced Software profiles to analyze WCDMA/HSDPA signals [5,6]. The measurement capabilities of this unit include Return Loss, Cable Loss, Distance to Fault, two port gain/loss, one port and two ports magnitude and phase, interference analysis, spectrogram, and power meter. The BTS Master can measure Node B performance Over the Air by connecting an antenna or by connecting Node B equipment directly to the BTS Master MT8222A. Measuring a WCDMA signal over the air, the antenna must be connected appropriately to the frequency band to be measured. Among all the parameters measured by the BTS Master MT8222A [5-7], the CPICH (Common Pilot Indicator Channel) was the main focused.
In the UMTS cellular communication system denotes the power measured by a receiver in a specific communication physical channel. It is used as an indicator of signal strength as a criterion for delivery in the downlink control energy and the calculation of loss per path. In WCDMA systems a physical channel corresponds to a particular spreading code, hence the name. Figure 1 shows the area where measurements took place. This area covers approximately 0.7 Km2, where different electromagnetic scenarios can be found such as, open area, suburban and urban areas. Open area model includes scenarios with open space, and no large trees or buildings in the path [2]. In the field area located in the upper left side of Figure 1, we have an open area because the presence of trees is very low and building is null.
Figure 1 also shows the positions where the 4 nearest Base Stations are located. The suburban model represents a village or a road with scattered trees and houses, some obstacles near the mobile, but not too congested [2]. In this case, academic buildings areas were chosen because present a combination of low and medium buildings heights with some trees. With these features the multipath propagation analysis is very thorough, considering in this way the obstacles that cause mainly this phenomenon. The defined area for the analysis consists of 4 faculties with a mix of 9 administrative and teaching buildings equal space distributed, recreation areas, halls, one stadium, a library and a large teaching building that extends from North to South as shown in Figure 1 and delimited by the red square. Also the closest Node Bs is shown in a blue circle with the 3G label.
Measurements were done specifically in Channel 1087 of WCDMA Band V of additional channels, using the Spectrum Master MS2721B, GPS options and an omnidirectional antenna in the range of 870-960 MHz [7]. Kriging interpolation method [8] was used to get the coverage maps. All measurements were performed with the measuring equipment at a height of 1 meter and 10 cm above the floor and moving with him on foot through the exteriors of buildings [9].
While measurements were obtained, it was necessary to have geo-referenced information at the point where measurements were made. GPS functionality was activated in the menu “System” of the spectrum analyzer and a GPS antenna was connected [6]. This feature requires that the GPS antenna is outside and wait a few minutes to get traced back at least 4 satellites and be able to have the position information of latitude, longitude, altitude and time.
In the analyzed area (see Figure 1), 19 different Scrambling Codes were founded from a total of 1519 measurements, each one of the SCs codes founded with its associated GPS information were separated from each other and their CPICH, Ec, Ec/Io, Pilot Dominance values were extracted from the *.csv files generated in the MST. Kriging methodology [8] application (running over MatLab) requires of position information (Latitude and Longitude) plus one additional value to generate the estimations maps in two dimensions. In this case, the third values considered were the power of the Ec and CPICH, and their respective coverage maps were gotten.
This paper shows the measurements for 226, 181 and 246 Scrambling codes. The next section exhibits the results of the measurements described before.
3. Measurements
The following maps (Figures 2 and 3) belong to Node B
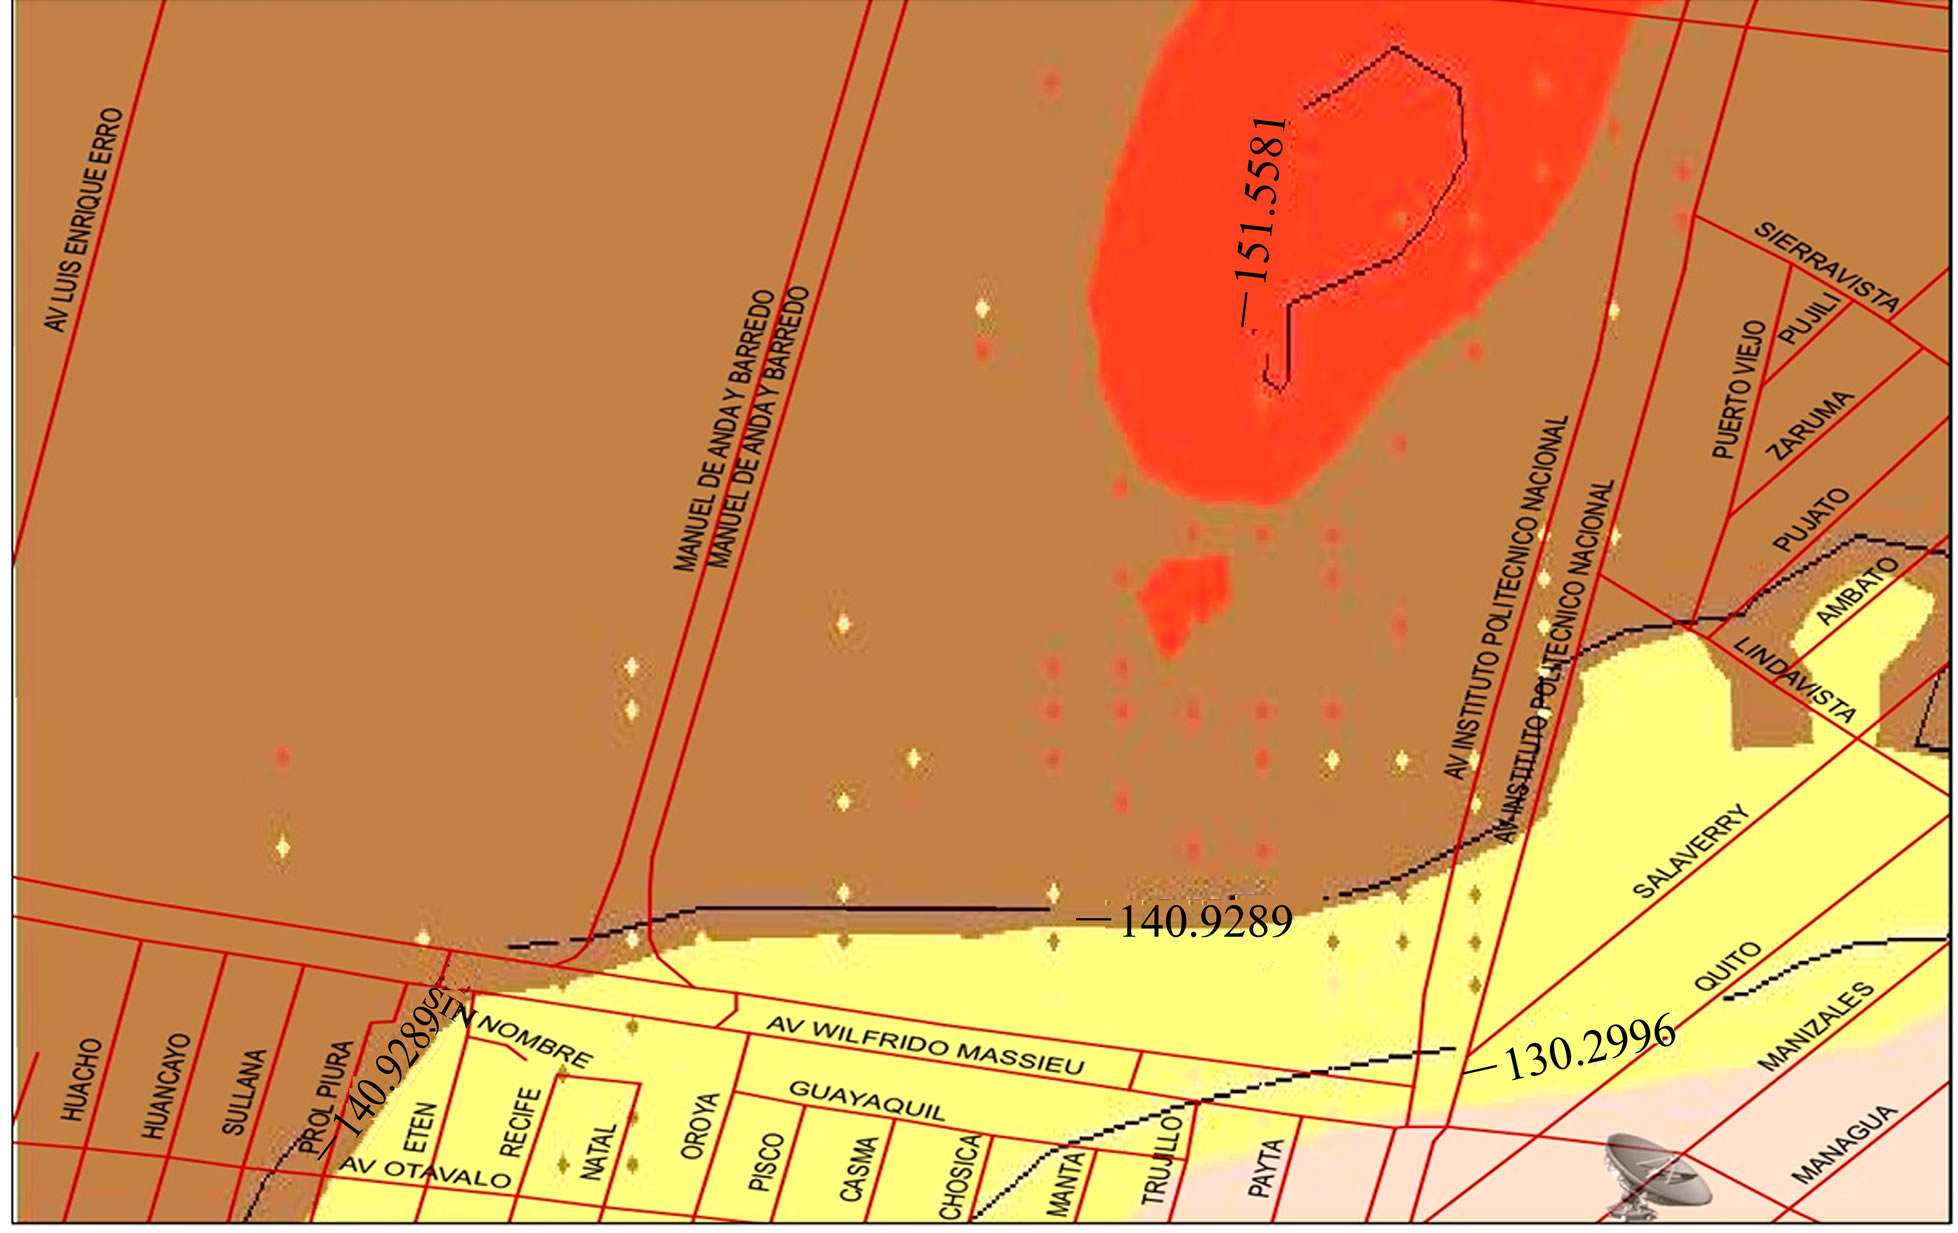
Figure 2. Coverage estimation map for Ec SC 226.
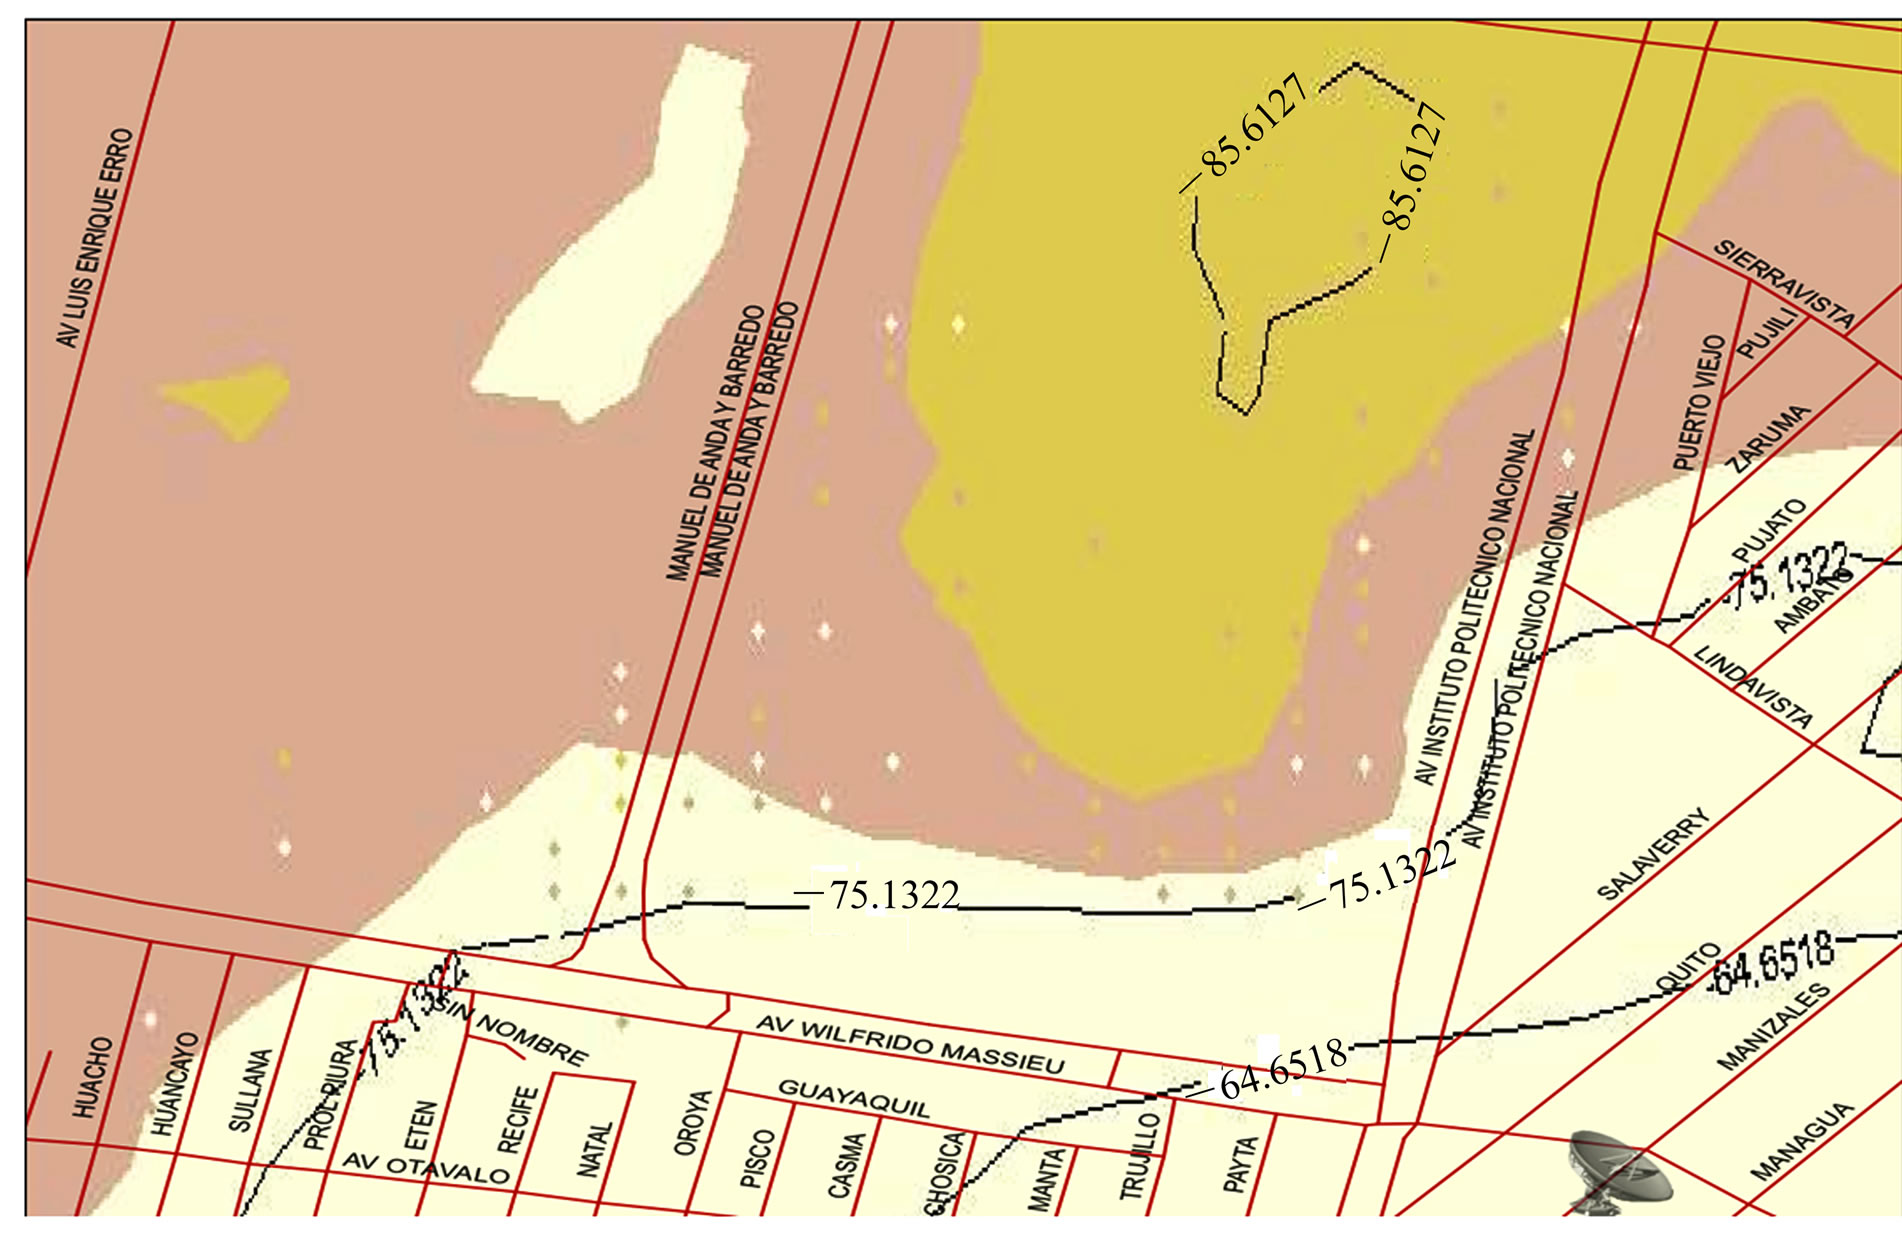
Figure 3. Coverage estimation map for CPICH SC 226.
with SC 226. The Node B is located in the right bottom corner and its SC is 224, 225 and 226. The Antennas height for this Node B is about 18 meters.
Node B is located in the right bottom corner of the Figures 2 and 3; we can see that the strength level of the WCDMA signal decreases when the measurement point is located further from the Node B. The SC 226 is the strongest signal in the studied area.
The higher power levels are identified by the first band of color scale on the bottom of the image-white color. Then the signal strength starts to decrease, and the next level there is a new increase in power levels in a region northwest of the area where the stadium and a wooded area are located, so this increase in power level must be caused by phenomena such as multipath or reflections in the stadium structure which cause this increase in power WCDMA signal. Coverage maps for the Scrambling Code 181 for values of CPICH and Ec associated with the Node B are shown in Figures 4 and 5, respectively. The Node B is located on Wilfrido Massieu Avenue (bottom left of the figures). In this case the attenuation of the signal is observed to be from left to right, going from the lighter shades to darker; Red color identifies the higher attenuation (12 dB at distances no greater than 200 meters)
The Node B, identified as Ticoman, is a node that is located North-East of the area selected, (top-right of the figures). Based on the sector 246, (Scrambling code 246) we were able to get the coverage maps for the CPICH and Ec values shown in Figures 6 and 7, respectively. The Node B is near to the selected area, approximately 500 meters and the observed power levels are defined by the first four colors of power. At the top left of the Figure 6, we can observe a similar behavior to that presents the Node B Lindavista with SC 226 (Stadium Area), where after the power is decreasing, is detected an increased level of power due factors such as multipath.
4. Considerations and Results
Based in the previous sections, we can point out several concerns related to the Ec level, expressed on the Guideline Section [6], where is mentioned that the Ec level should be higher to –88 dBm in the 97% of the coverage area and in this case the higher level for Ec is –125 dBm in a very reduced strip of the area. As can be seen in Figure 1, Node B LINDA is very close to the campus and the farthest measured point (top left corner) is located to 800 mts, where values between –140 to –150 dBm were obtained. Also, it can be seen that the maps generated for both Ec and CPICH follow almost the same pattern, ex-
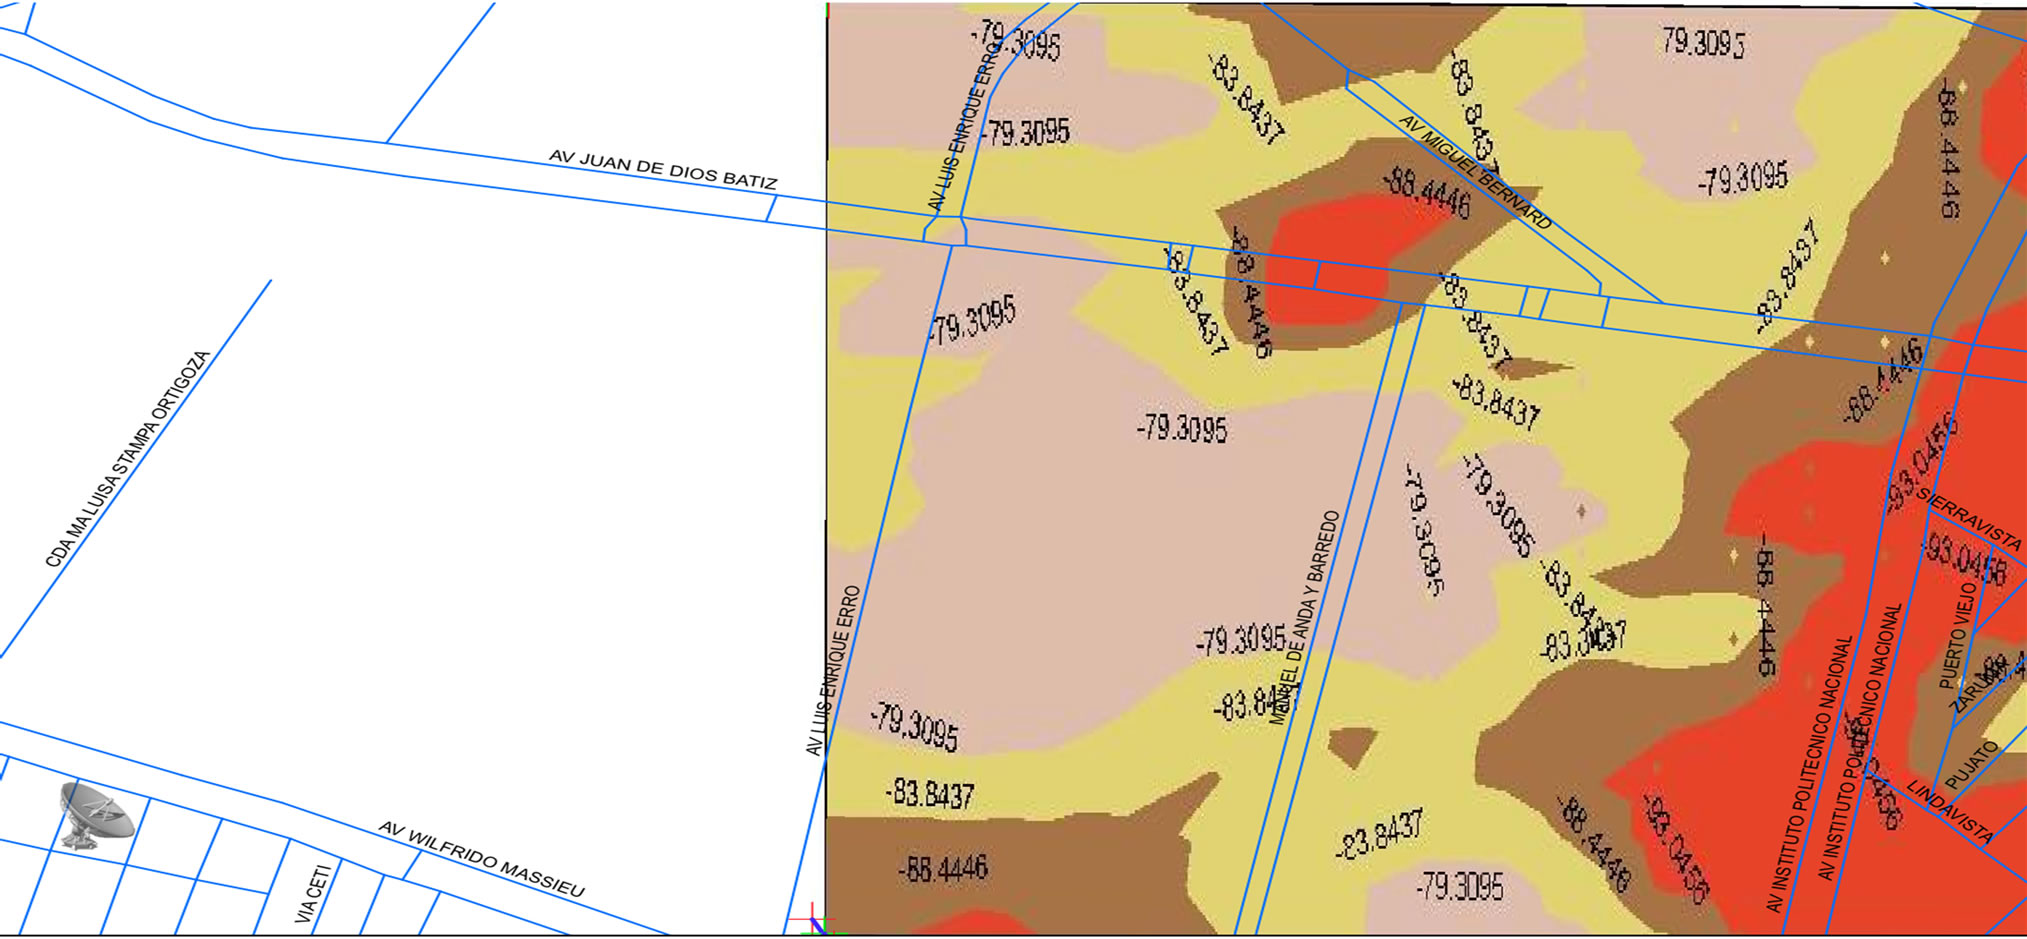
Figure 4. Coverage estimation map for CPICH SC 181.
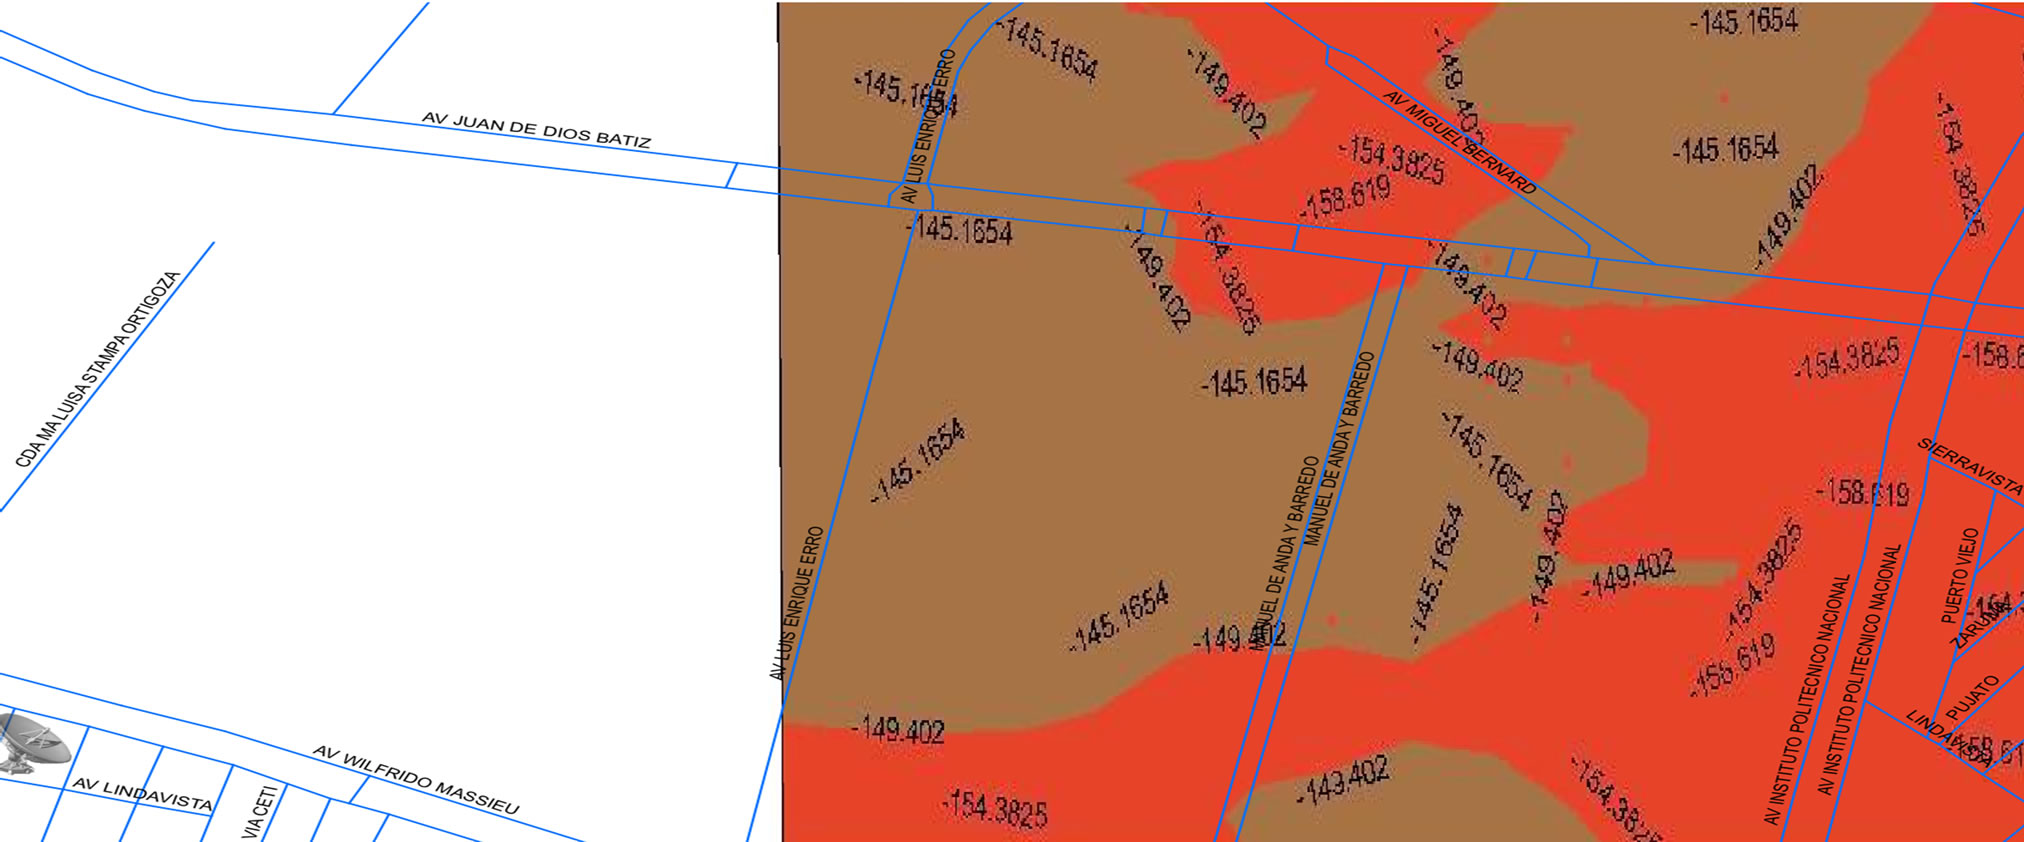
Figure 5. Coverage estimation map for Ec SC 181.
cept for the white area in the top of Figure 3, where an increased of power is shown for CPICH power stadium located in this area. The power level of the CPICH, is useful in order to plan the cell coverage and to determinehow many mobile stations can be connected to the base station [2]. The CPICH power administration implies a tradeoff between power level and coverage; this administration could be applied to balance the load and traffic of the cell and the neighboring cells, this effect could reduce la interference levels, and improve the system capacity.
The cell size can be modified depending on the CPICH power level. If the power of the cell is lower, it could be possible that some areas do not have coverage; in an area without coverage, a mobile station is not able to receive and detect a CPICH dominant (fallen calls, bad voice quality and a lower throughput can be the result of this effect). In the other hand, a very high CPICH power level, can provoke that multiple SC can be detected in the Soft Handover area; fallen calls, blocked calls can be experienced for the mobile stations. This type of experimental analysis is important in order to adequately plan the coverage and capacity of a WCDMA network. It should continue to analyze the presence of other SC in the area and

Figure 6. Coverage estimation map for CPICH SC 246.
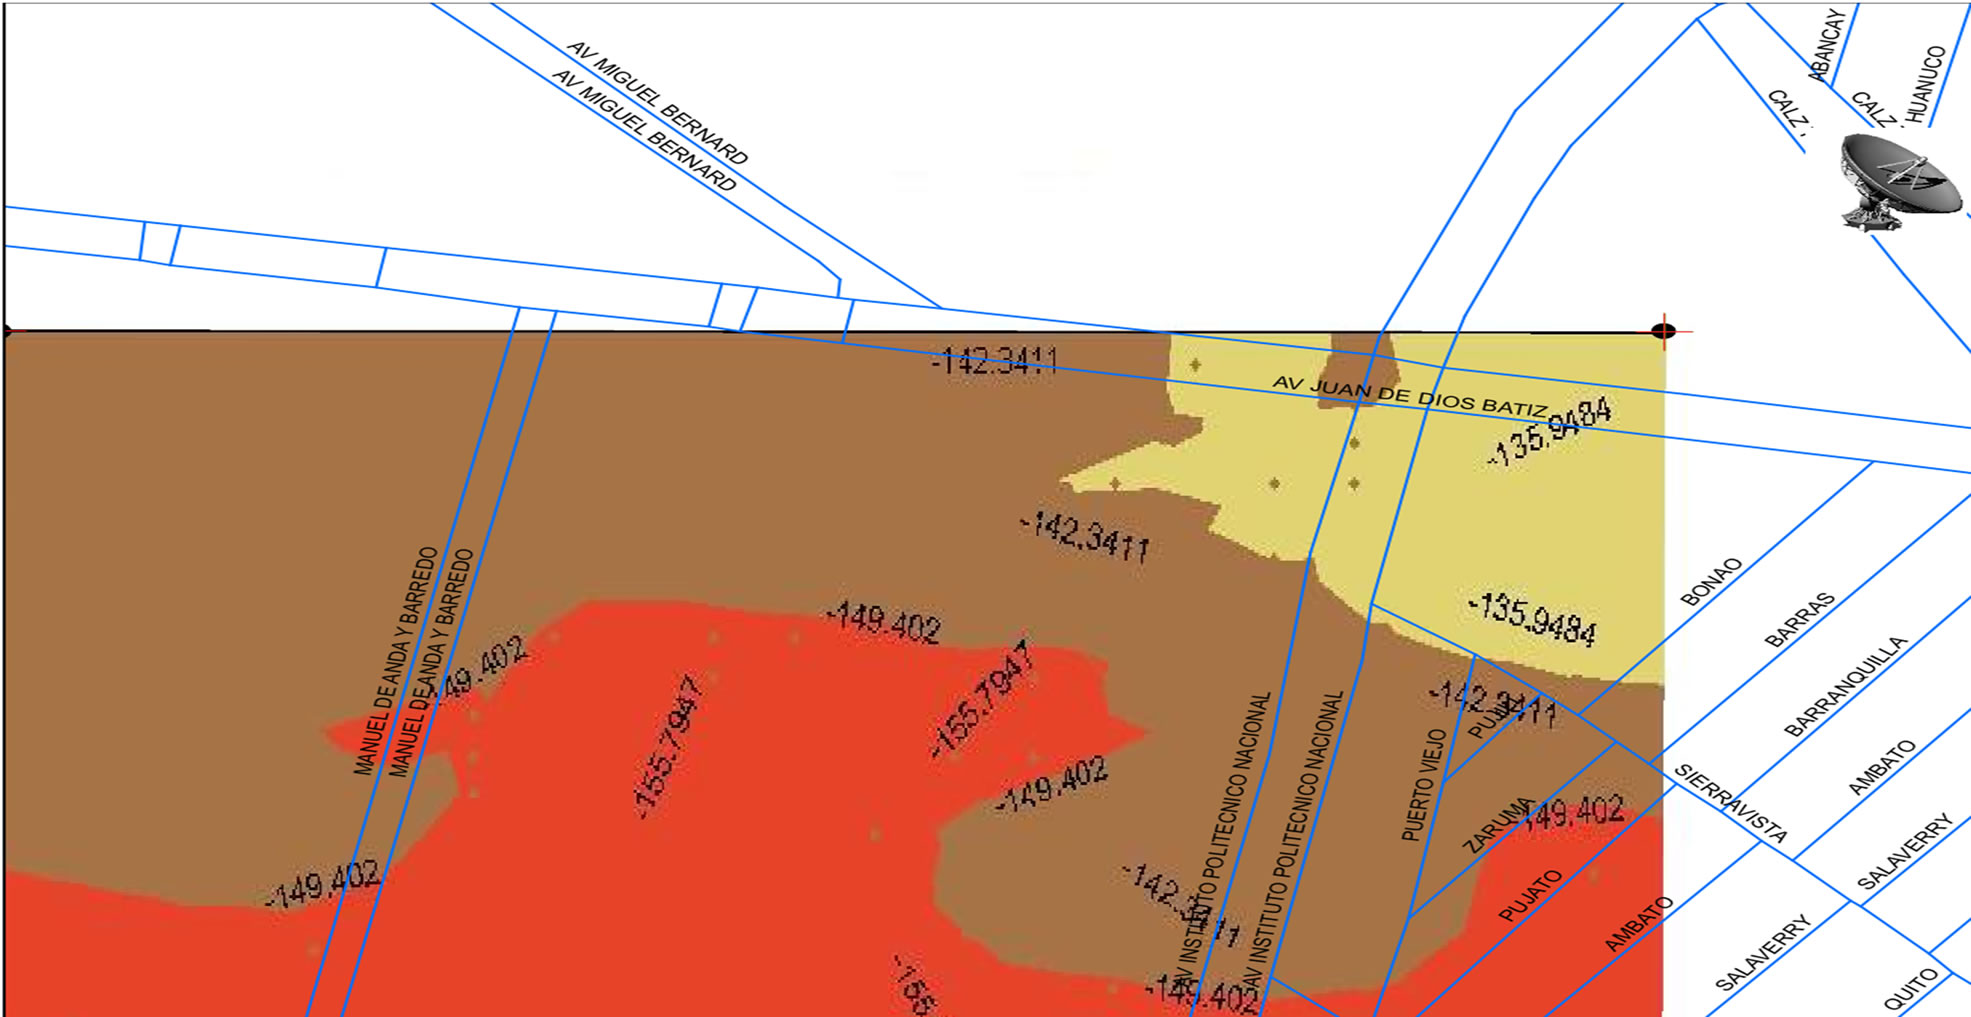
Figure 7. Coverage estimation map for Ec with SC 246.
determine the crosstalk between themselves. It should also make an analysis of coverage taking into account the three sectors of base stations nearest to the studied area.
REFERENCES
- H. Holma and A. Toskala, “WCDMA for UMTS: Radio Access for Third Generation Mobile Communications,” John Wiley & Sons, Ltd., Chichester, 2000.
- R. Tanner and J. Woodard, “WCDMA—Requirements and Practical Design,” John Wiley & Sons, Ltd., Chichester, 2004.
- D. Fox, “Testing UMTS: Assuring Conformance and Quality of UMTS User Equipment,” John Wiley & Sons, Ltd., Chichester, 2008.
- M. Assaad, B. Jouaber and D. Zeghlache, “TCP Performance Over UMTS-HSDPA System,” Telecommunication Systems, Vol. 7, No. 2-4, 2006, pp. 371-391.
- Anritsu Co., Ltd., “Practical Tips on WCDMA Measurements,” 2009. http://www.us.anritsu.com
- Anritsu Document, “WCDMA/HSDPA Base Station Troubleshooting Guide,” http://www.us.anritsu.com
- Anritsu Company, “Spectrum Master MS2721B, MS27 23B, MS2724B,” 2009. http://www.us.anritsu.com
- M. L. Stein, “Interpolation of Spatial Data: Some Theory for Kriging,” Springer, New York, 1999.
- Anritsu Company, “3GPP Signal Analyzer for Anritsu’s RF and Microwave Handheld Instruments,” 2009. http:// www.us.anritsu.com/