Journal of Environmental Protection
Vol.4 No.12B(2013), Article ID:41521,12 pages DOI:10.4236/jep.2013.412A2004
Drinking Water Quality Clinics and Outreach in Delaware Focusing on Educating Master Well Owners
![]()
1College of Agriculture & Related Sciences, Cooperative Extension, Delaware State University, Dover, Delaware, USA; 2Master Well Owner Network, University Park, Pennsylvania, USA; 3Office of Sponsored Research, Delaware State University, Dover, Delaware, USA.
Email: *gozbay@desu.edu, accannon10@students.desu.edu, Amanda_Treher@natureserve.org, water-ninja@comcast.net, aessel@desu.edu, dmarsh@desu.edu, jaustin@desu.edu
Copyright © 2013 Gulnihal Ozbay et al. This is an open access article distributed under the Creative Commons Attribution License, which permits unrestricted use, distribution, and reproduction in any medium, provided the original work is properly cited. In accordance of the Creative Commons Attribution License all Copyrights © 2013 are reserved for SCIRP and the owner of the intellectual property Gulnihal Ozbay et al. All Copyright © 2013 are guarded by law and by SCIRP as a guardian.
Received September 13th, 2013; revised October 11th, 2013; accepted November 8th, 2013
Keywords: Water Quality; Well Water; Drinking Water; Private Well Water; Water Sample Testing
ABSTRACT
The United States Environmental Protection Agency (EPA) has the authority to regulate the public water systems. The EPA does not have the jurisdiction to regulate private drinking water wells. This leaves approximately fifteen percent of the nation’s population without any regulation being held in place to protect their source of drinking water. With that fifteen percent of the US population having private wells for drinking water, it makes the number of people whose drinking water is unprotected by regulation at a little over 15 million US households. This concern is even more acute in areas with groundwater that is close to the surface. Delaware residents live in a region with low elevation which is very close to the coast with low elevation and the shallow groundwater makes us concern about contaminated well water even more intense. As one of the Water Resources Program partners, we have offered free Drinking Water Quality Clinics to local well owners over the past 4 years in Delaware State University. Since 2009, over 400 Delaware residents have benefited from these clinics. At each clinic, an information session was offered in the evening, with an opportunity to hear from and speak with a drinking water well expert. Participants were given sample bottles and water testing performed the following day included pH, nitrite, nitrate, sulfate, alkalinity, fluoride, hardness, iron, lead, cadmium, arsenic, Total Coliform, and E. coli. Over half of the samples returned out of range values for pH, while 72 returned results positive for Total Coliform and Escherichia coli bacterium. Data are examined for correlations, and improved understanding of local well owners. These tests shared with local well owners insights into what may be wrong with their water. In addition, any tests that came back outside of the normal range were reported to homeowners in writing. Mailed with the written reports were also information specific to what test results were outside of the limits, and actions to take to correct the exact problem the well owners encountered. The data reported here are examined to discuss the correlations of information, and ways that the Drinking Water Quality Clinics have improved our understanding of local wells and ownerships. In conclusion, regular testing on a yearly basis is the most effective way to ensure that public health is maintained.
1. Introduction
According to the World Health Organization (WHO), the quality of drinking-water is a strong environmental determining factor of health [1]. Drinking-water safety lays the groundwork for the prevention and control of waterborne diseases [1]. In 2008, the WHO created an International Network of Drinking-Water Regulators (RegNet) due to requests from the Member States [2]. Member States consist of any member of the United Nations that accepts the WHO Constitution [3]. This network was created to address regulatory issues in relation to drinking water in a more organized way [2]. RegNet is an international forum that allows for sharing and discussing the strategies to address all facets of guardianship and the care of public health as it relates to drinking water [2]. RegNet’s mission is “to protect public health, as it relates to drinking water, through the promotion of excellence and the continual improvement of regulatory frameworks and systems [2].
In the Mid-Atlantic region, which includes Pennsylvania, Virginia, Maryland, West Virginia, and Delaware, over 5.5 million people have private drinking water supplies. These systems include well, cisterns, and springs [4]. When a homeowner has a private water supply, they are responsible for multiple aspects of their own water. These people must test their water on a regular basis to ensure that it is safe for drinking and cooking [5]. They are in charge of the care and maintenance of their system, and they also are accountable for solving their own water problems [6]. Many times, these citizens lack the knowledge and resources to make well-informed decisions concerning their water supply. They often wait until a problem arises to take action [6].
In looking at the different kinds of private water systems, there are wells, which are drilled or bored into the ground until the groundwater table is reached [6]. They are between 6 - 300 meters in depth and should be located at least 30 meters away from sources of contamination [7]. There is usually a casing, grouting, or a sanitary well cap to protect the water from contamination [6]. Cisterns are containers used for the catchment of rainwater to be used for private water sources [8]. Springs are formed when the side of a hill, a valley, or excavation meets groundwater. Spring water is highly susceptible to contamination [9].
Drinking Water Quality Clinics held here at Delaware State University have been an extension of the Master Well Owner Network (MWON) that began in 2003 [10]. In the MWON Program, volunteers were taught many subjects regarding private water supplies [10]. Topics included groundwater, well construction and maintenance, land use impacts, water testing, conservation, solution and treatment of water problems [10]. As a continuation of the MWON, we here at Delaware State University, as a part of our Cooperative Extension Program, have offered the public multiple opportunities to attend information sessions regarding their private water supplies. In this way, the free educational program can be shared from community about private drinking water supplies. In addition to the teachings, we offered the public an opportunity to have their water tested on the day following the Drinking Water Quality Clinic, on campus in our Aquatic Sciences Laboratory.
The clinics were held after funding was over for the MWON, and have been supported as part of the 1890 Water Resources Center Program partners, lead by Virginia State University. Since 2012, this program has been funded by the 1890 Water Resources Center Grant. Map 1 illustrates the local Delmarva Peninsula region that includes Delaware to show the uses of land in the area.
The results are available in this article, regarding not only what was found in the testing of the water, but also the effectiveness of the teaching and learning of the seminar format in which homeowners learn about their wells and water quality. The water samples have been tested for pH first, which can be an indicator of other water quality problems [12]. Measurement of pH is important because low pH can allow toxic metallic elements and compounds to become mobile and “available” for uptake by people drinking the water [13]. Chlorine is also measured in the samples, because it can cause eye and nasal irritation, as well as stomach discomfort and potential nervous system effects in infants and children when found in drinking water [14]. We tested for Sulfates, which are important to measure due to a bitter taste that can be brought out in the water from Sulfates, as well as having laxative effects on humans and animals consuming them in water [15]. Water samples were tested for Nitrite due to the fact that infants below the age of six months who drink water containing nitrite in excess of the Maximum Contaminant Level could become seriously ill and, if untreated, may die [16]. Symptoms may show as shortness of breath and blue-baby syndrome [16]. Nitrate levels were also measured considering that Nitrites convert to Nitrates in a baby’s stomach from a bottle made with drinking water, which can also be the cause of blue baby syndrome [17]. Alkalinity is a measure of the ability of water to neutralize acids [18]. This is an important factor in drinking water because a certain level of alkalinity will help raise pH, which will keep toxic metallic elements and compounds from becoming mobile in the drinking water to be consumed [13]. Hardness was also checked in the water samples to show levels of CaCO3 (calcium carbonate) in the water [12]. Although hardness levels do not denote a true health hazard, at certain levels they do help prevent corrosion of metals in pipes and sink fixtures in the home [12]. Iron concentrations were determined to show possible reasons for metallic taste of drinking water, discolored water, and orange or brown stains on laundry [12]. Fluoride levels were tested in the samples because it can cause tooth discoloration and skeletal decay of bone structure [12]. Water samples were also evaluated for E. coli and Total Coliform Bacteria. The importance of measuring the levels of these last two can
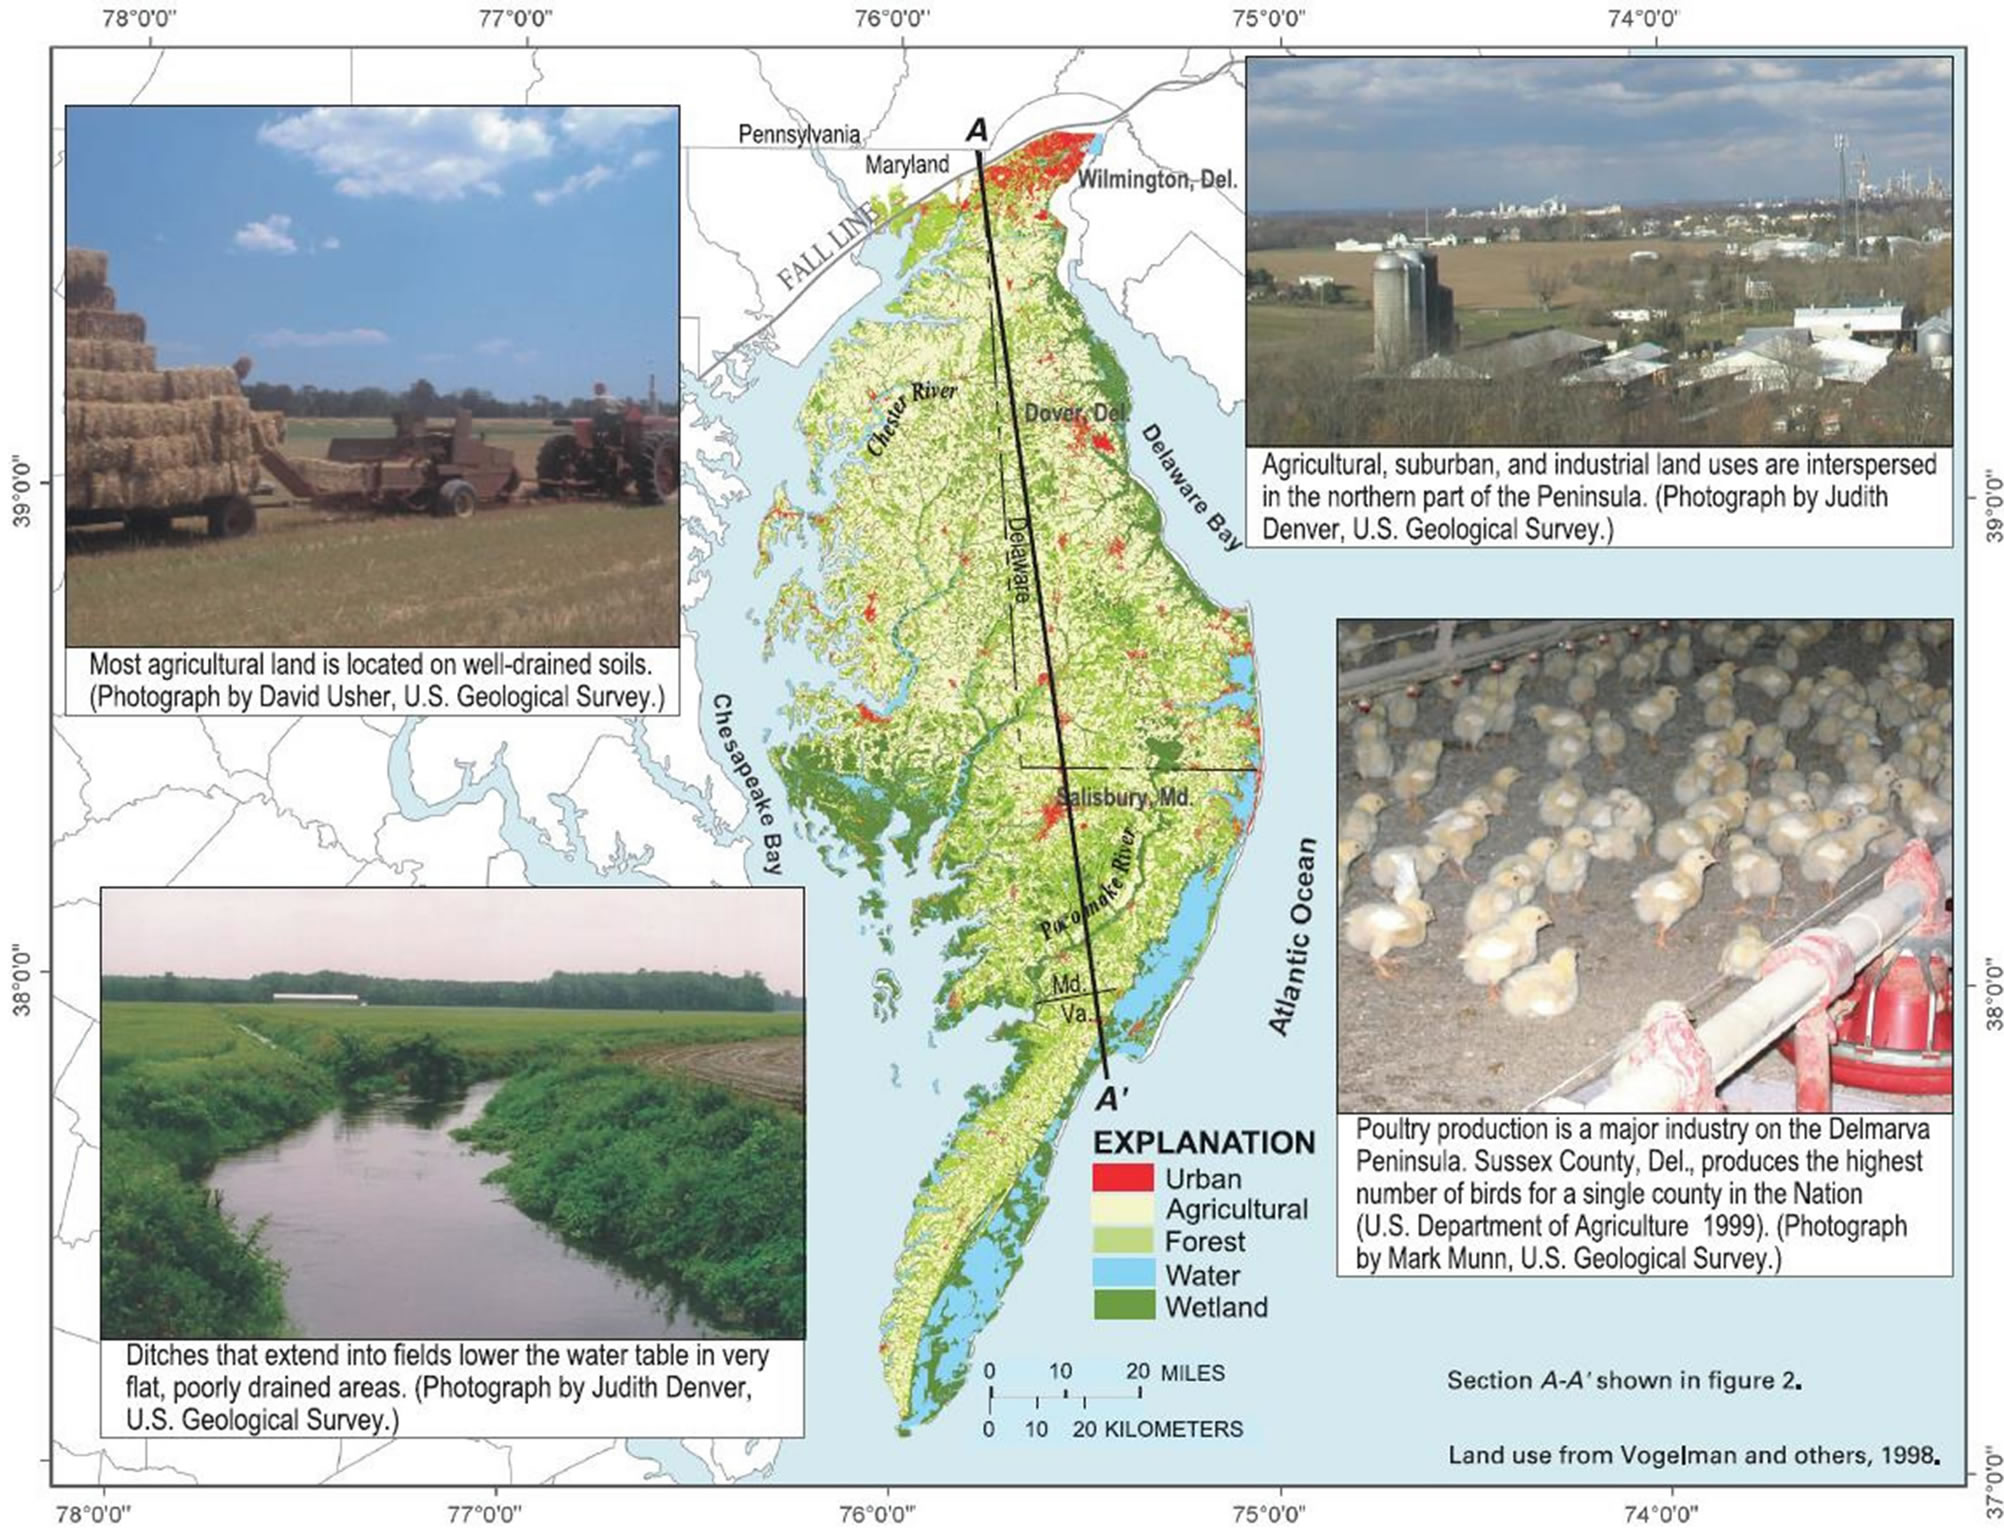
Map 1. The Delmarva Peninsula is primarily rural, with small towns and residences interspersed among agricultural and forested land. Major areas of urban growth are to the north and along the Atlantic coastline [11].
not be underestimated because coliform bacteria are often called “indicator organisms” due to the fact that they indicate the potential for disease-causing bacteria to be present in water [19]. E. coli presence in water samples shows a strong indication that human sewage or animal waste has contaminated the water supply [19]. A few strains of E. coli can produce a powerful toxin and can induce severe illness and death [19]. More common signs of infection are stomach upsets and general flu symptoms such as fever, abdominal cramps and diarrhea [19]. Lead, Arsenic and Cadmium are metals that were also tested for in selected drinking water samples. All of these tests will show homeowners if they have cause for concern in the water samples they bring from their homes, and then be able to address the concerns if they are present.
In regards to the effectiveness of the training workshop seminar, participants were given pre-tests and posttests to garner how much information they learned from the Drinking Water Quality Clinics. The homeowners were also asked to fill out a form sharing how close their wells are to potential sources of contamination. From these details, it can be determined what may be causing contamination by what sources are located close to the homeowners’ wells. Workshop evaluation is provided to the Well Water Quality Clinic Participants to help us improve the way we reach out and effectiveness of information delivery during the workshops (please see the copy of the questionnaire in the appendices).
2. Purpose and Research Objectives
The purpose of the information reported here is to communicate the details and results of Drinking Water Quality Clinics held at Delaware State University for local well owners.
1) To define the information that was shared with participants in the clinics and why this information is relevant to drinking water.
2) To illustrate the results from the water sample tests, as well as the results from participant tests for information and program evaluations.
3. Materials and Methods
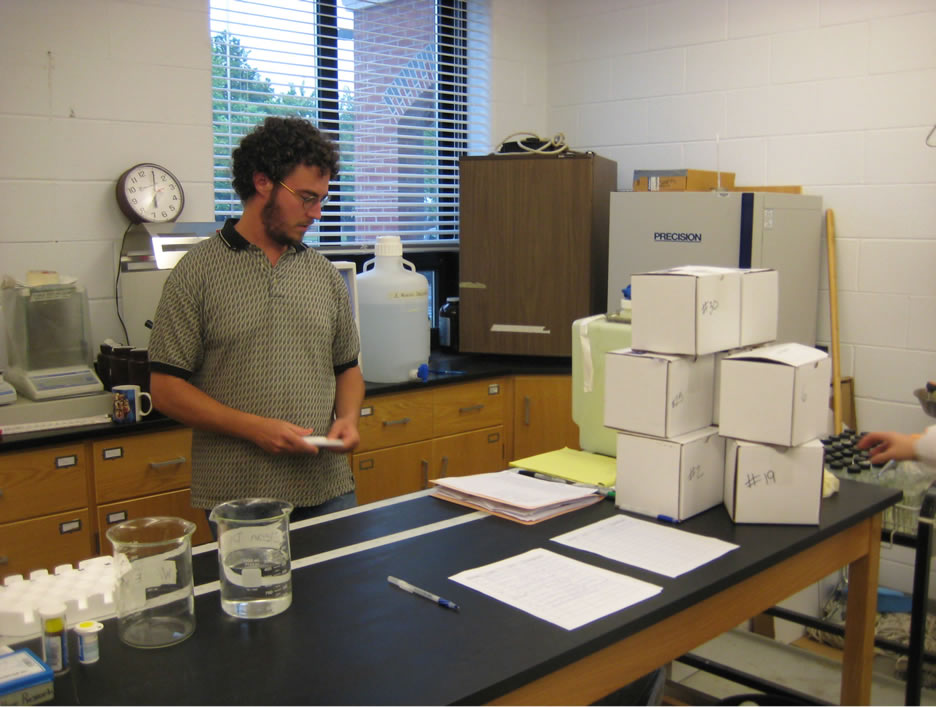
Each of the Drinking Water Quality Clinics has had a keynote speaker who is an expert on drinking water and wells. This offers the public an insight into how important it is to have their water tested, and to learn more about their well systems. This also presents an opportunity for homeowners to participate in a question and answer session to find out more about their wells after the keynote speaker presents their material. At the end of the question and answer period, residents are offered two water bottles to take home and take water samples. The following morning, we provide a location next to our laboratory where we collect samples until noon. At that point, we begin the testing of each sample. Due to the number of samples, we are unable to provide testing in triplicate, but the tests are formatted, able to be replicated and accurate.
During the information sessions of the clinics, many facts were shared with well owners regarding their drinking water supply. Participants were advised how they are responsible for maintenance, testing, treatment and protection of their wells. The participants were offered information on where the water comes from - aquifers. The speakers also shared what kinds of aquifers are available in Delaware, and how these aquifers may become affected by surrounding above-ground activities. The importance of proper well construction was discussed, as well as proper well location to prevent drinking water contamination. In the well construction section, the significance of a sanitary well cap, grout and preventing creatures from living under the well cap was shared.
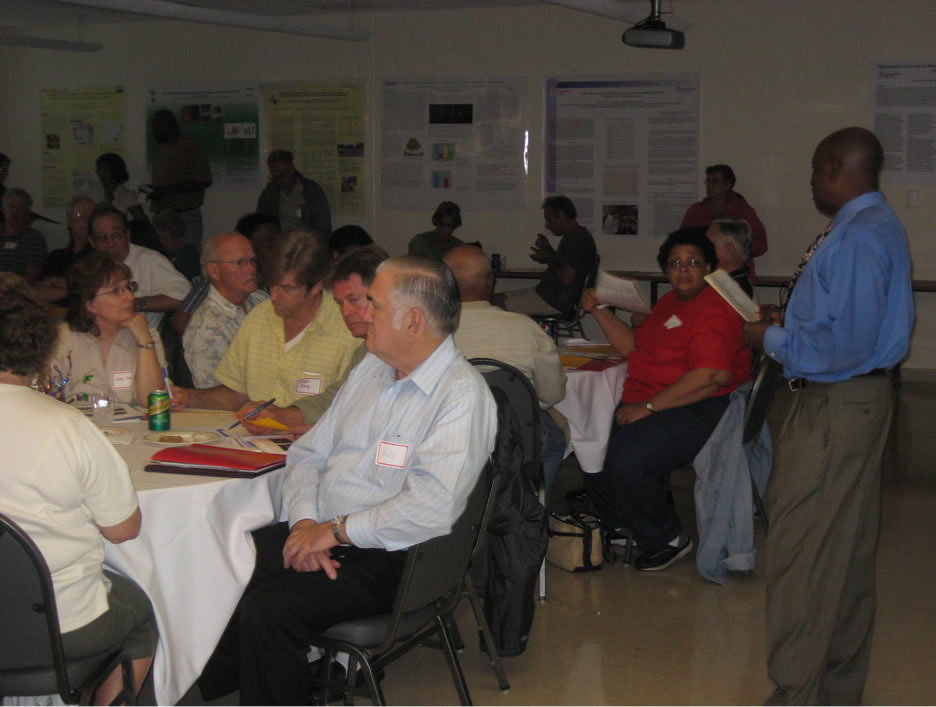
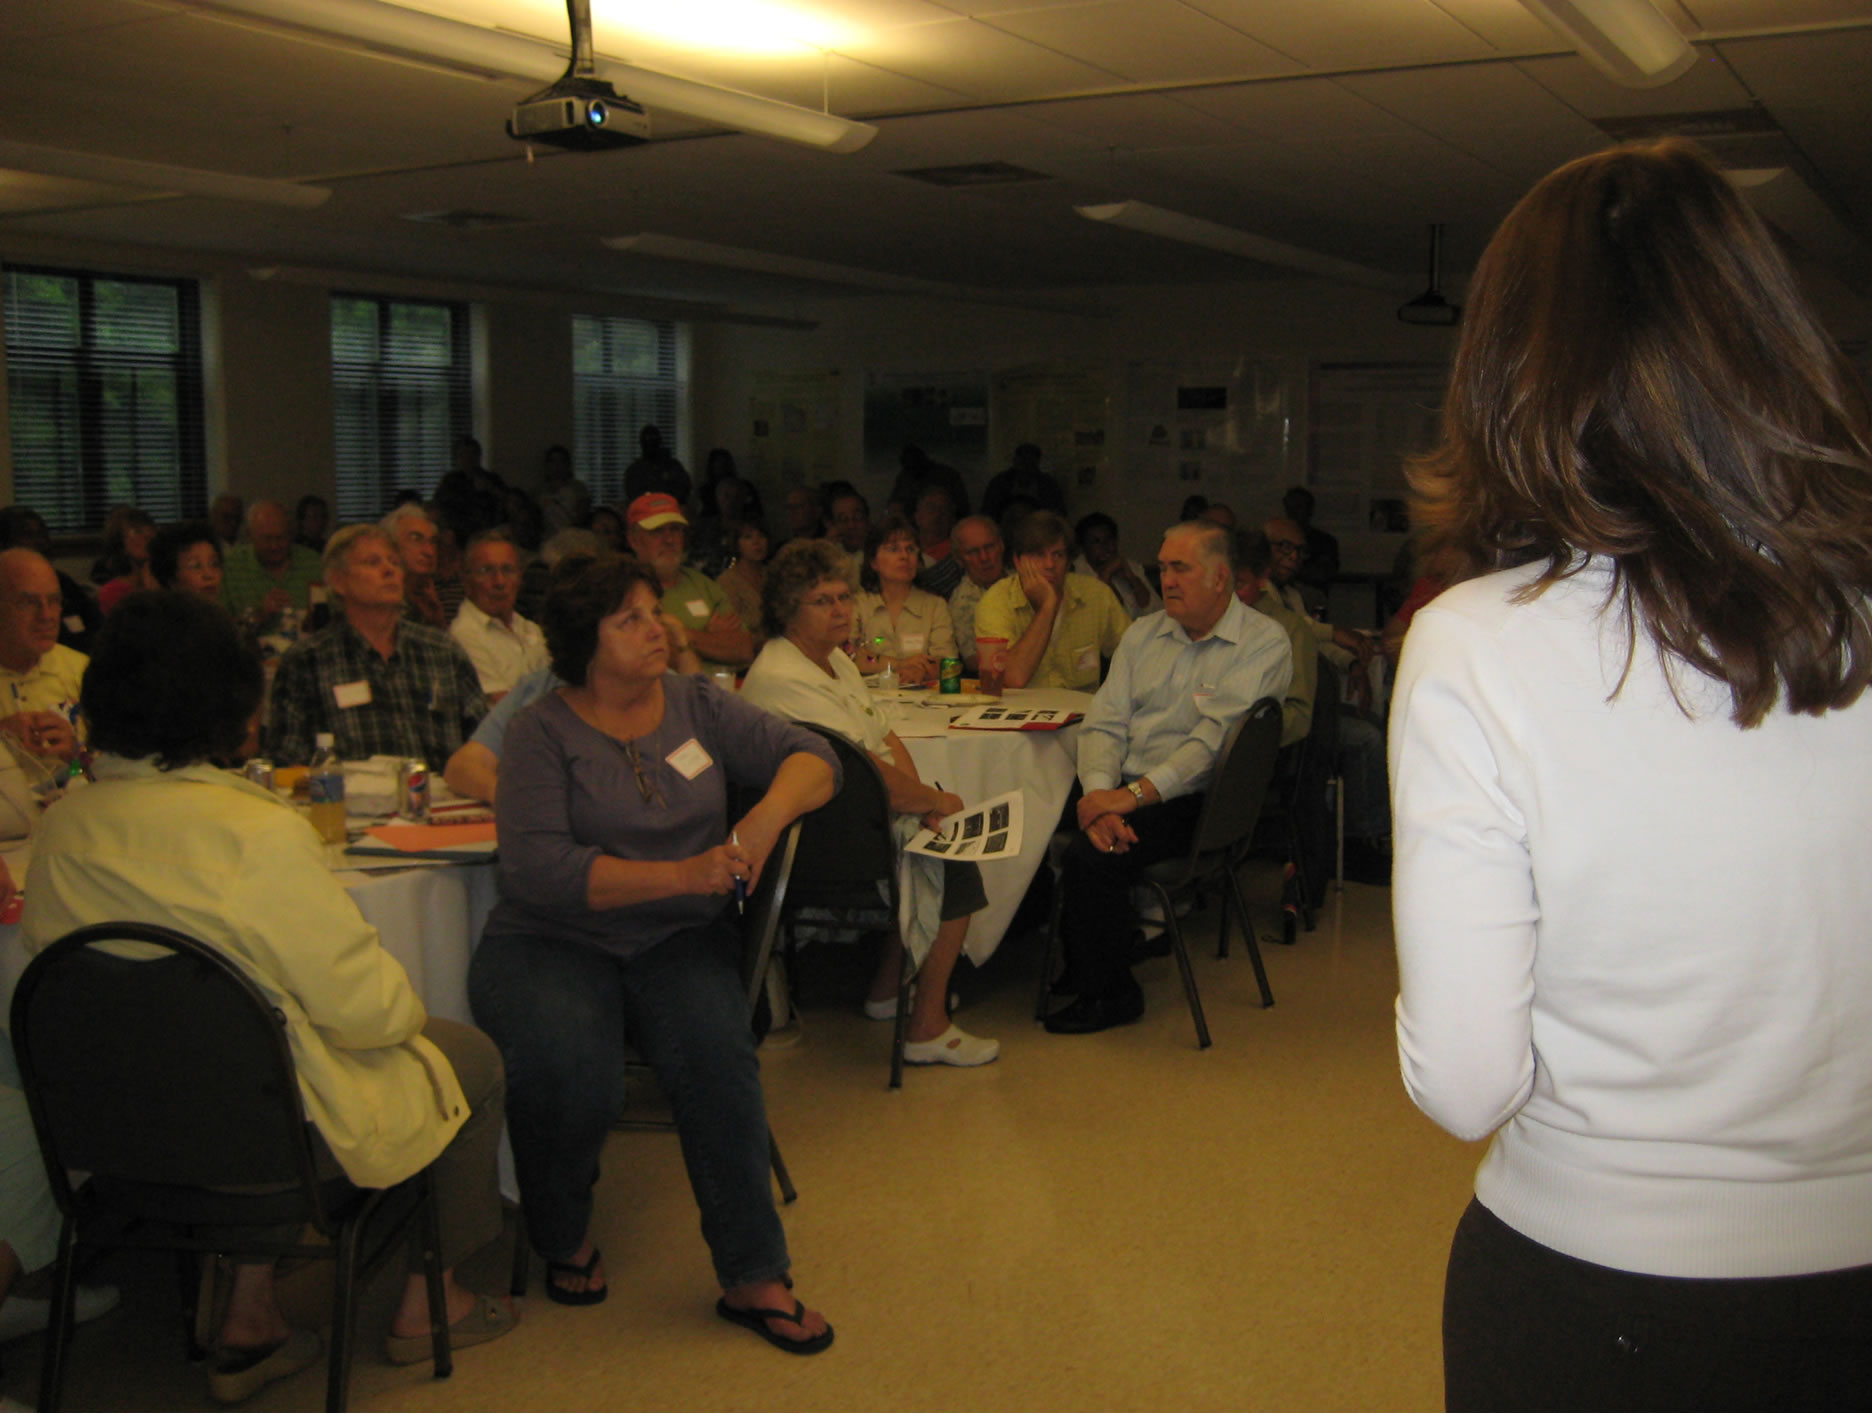
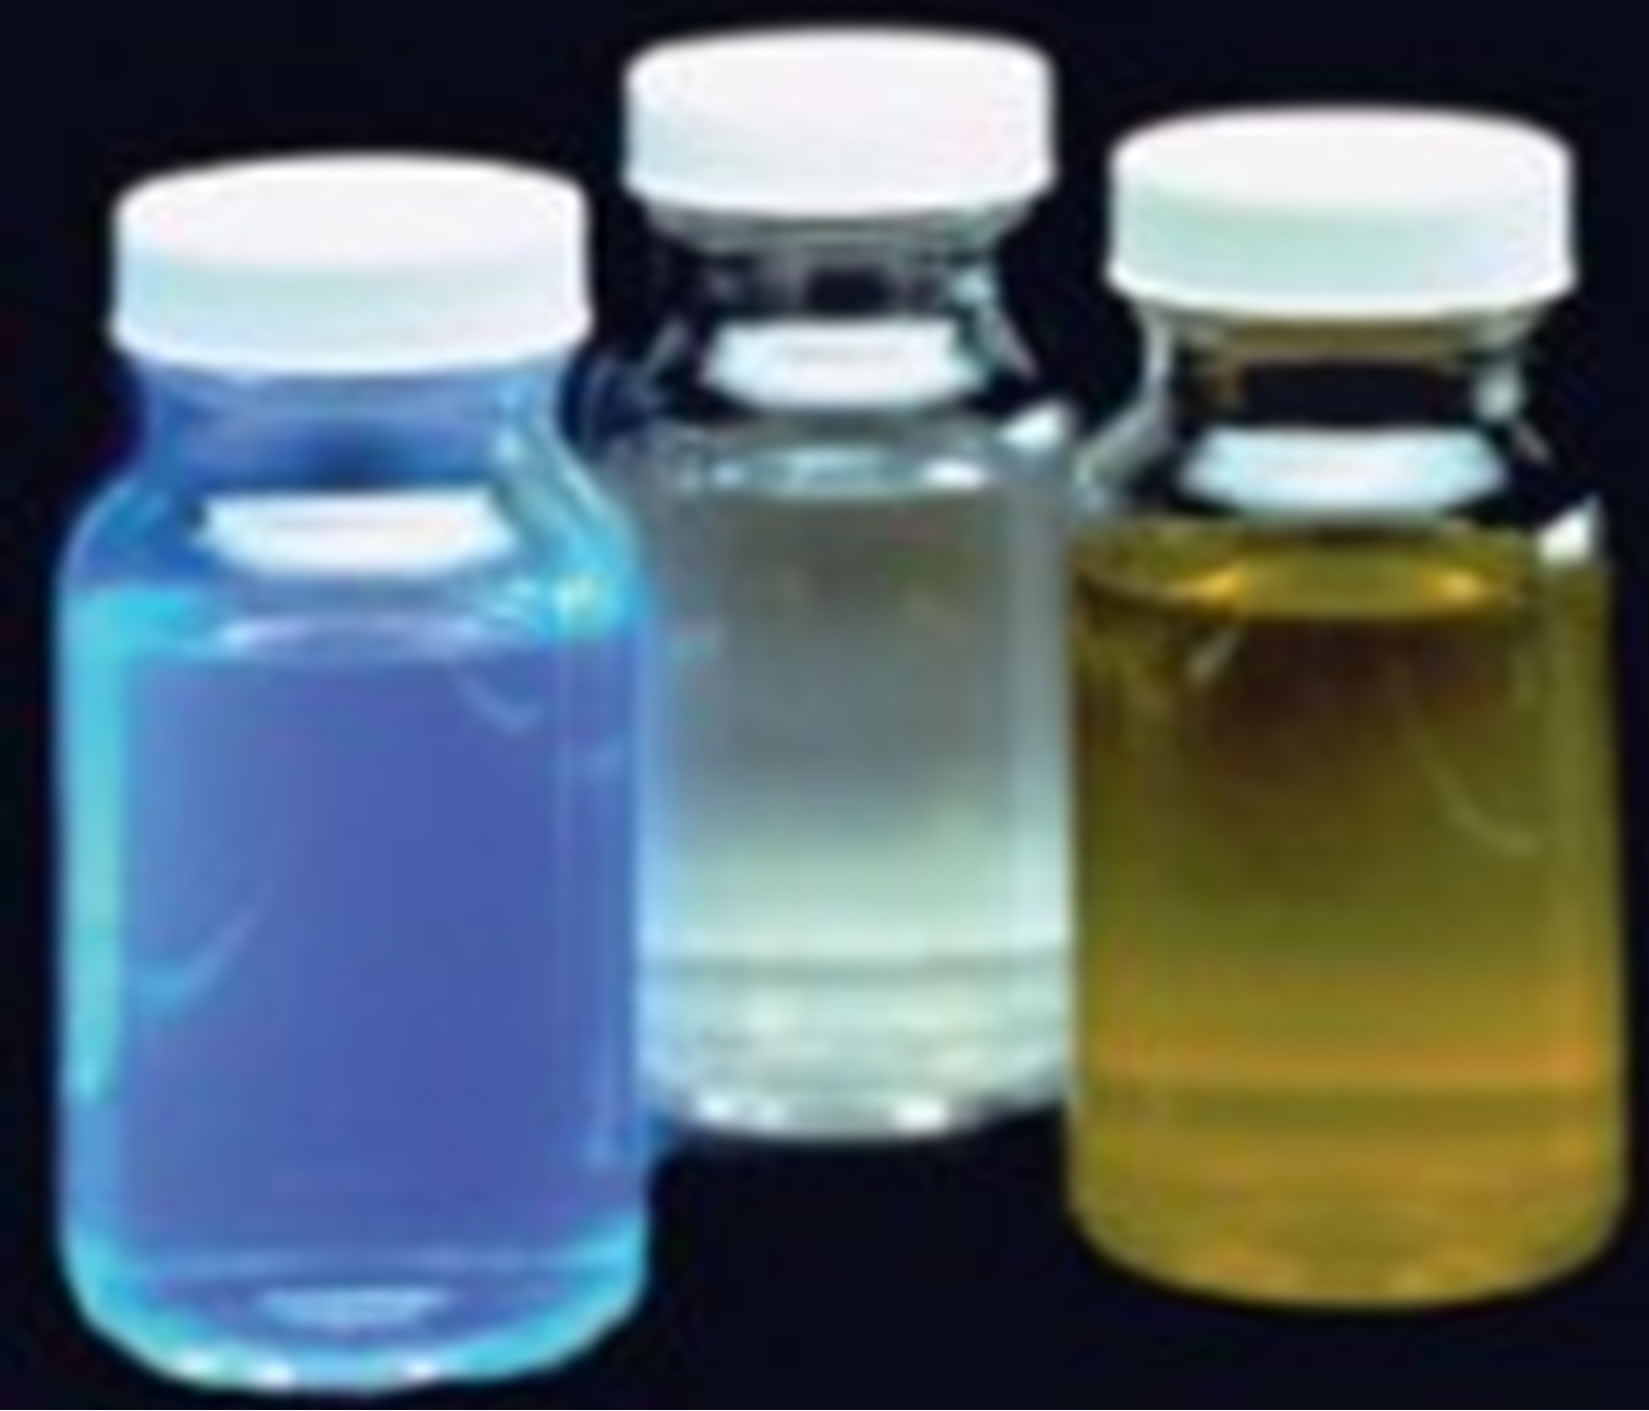
Members of the local community who joined in these sessions were informed of wellhead protection. The location where the well meets the air is important, especially in unconfined aquifers, like those found in most of Delaware, and all of Southern Delaware. In addition to wellhead protection, protecting the health of the families of the well owners was a crucial driving factor to make sure people know how important it is to have their water tested every year, at least. This will improve and protect the health of the people who drink this water. Because many pollutants do not have a smell or taste, it is crucial to keep testing current. Primary and secondary pollutants were discussed, and details about each contaminant were given to participants at the information sessions, prior to having their water tested. Picture 1 illustrates the public information sessions at the clinics, as well as some sample testing.
3.1. pH
The first test performed was for pH. This is performed by using the YSI EcoSense pH10 pH and Temperature Pen (YSI, Yellow Springs, Ohio). This instrument is calibrated first by using YSI Buffer 3821 for pH 4.00. The second buffer is YSI Buffer 3822 for pH 7.00, and the third is YSI Buffer 3823 for pH 10.00. Once calibrated, the implement is placed into each sample individually to measure the pH. Once the data is recorded, the equipment is cleaned with de-ionized water to prepare it for the next sample. The instrument is then wiped clean with a Kimwipe, and the next sample pH is recorded until all samples have been tested for pH.
3.2. Nitrites
Nitrites are the next thing that was measured in the drinking water from wells. These were found by using HACH Method 8507, the Diazotization Method for Low Range concentrations from 0.002 to 3.000 mg/Lof Nitrite ( ) in solution of drinking water. Powder pillows of reagent are used in this method, being added to a 10 mL cylindrical cuvette. The results are read by the HACH DR 2500 spectrophotometer (HACH Co. Loveland, Colorado).
3.3. Nitrates
Next, Nitrates were measured from the well drinking water samples. They were measured using HACH Method 8171, the Cadmium reduction method. This test is for mid-range levels of nitrate, from 0.1 to 10.0 mg/L concentrations in solution. Once powder pillow reagents are added, and the allotted time is taken for the test to complete its reaction, the HACH DR 2500 spectrophotometer was used to measure the levels of Nitrate ( ) in solution.
3.4. Hardness
The following test on the drinking water samples is for Hardness. This test is performed with the Palintest PM 254 Method, the photometer method with automatic wavelength selection. The measurement of hardness is tested over a range of 0 - 500 mg/L CaCO3. Water hardness is caused by the presence of calcium and magnesium salts [20], so this test measures these cations. The results are focused upon Ca2+ part of the CaCO3, which indicates the actual hardness and potential corrosiveness of the water.
3.5. Sulfate
Testing for Sulfate was performed in the samples received. This is measured using HACH Method 8051, USEPA SulfaVer 4 Method. This method is equivalent to USEPA method 375.4. The levels measured are from 0 to 700 mg/L of Sulfate in the samples. Results are found by the HACH DR 2500 Spectrophotometer set to a wavelength of 450 nm. This reads the turbidity that is proportional to the amount of Sulfate ( ) in sample solution.
3.6. Iron
Iron is also measured in the drinking water for each sample collected. It is calculated using the Palintest PM 155 Method, the photometer method with automatic wavelength selection. The levels are measured in the low range, from 0 - 1.0 mg/L of Iron in solution. These results are found by using the YSI 9500 Photometer (YSI, Yellow Springs, Ohio).
3.7. Fluoride
Another component that was assessed was Fluoride levels in the well water. This was analyzed using HACH Method 8029. This is the SPADNS Method that measures 0.02 - 2.00 mg/L Fluoride (F−). The reagent solution was used. There is also an option to use the AccuVacAmpuls, but this was the second option that was not chosen to be used. The reagent solution was chosen to be utilized instead. The results from this test were read by the HACH DR 2500 to measure Fluoride in well drinking water solution.
3.8. Total Coliform and Escherichia coli
Total Coliform tests were performed on a presence or absence basis in the well water samples. They were analyzed using IDEXX’s patented Defined Substrate Technology* (DST). Essentially, a bottle with reagent is used to collect the sample the morning of the test. The homeowner brings the sample bottle, with reagent already inside to the lab for the actual test. It is stored for 24 hours at 35˚C in the lab, and then examined for results. A yellow color denotes presence of Total Coliform bacteria. If the yellow color fluoresces under a black light, then this denotes the presence of E. coli bacteria. This method has been approved by the United States Environmental Protection Agency (USEPA), as well as other nations who are currently using this method for detection. This test does not provide quantitative outcome, but rather denotes the presence or absence of bacterium.
3.9. Lead, Arsenic and Cadmium
A Perkin Elmer AAnalyst 600 Graphite Furnace Atomic Absorption Spectrometer was utilized to measure levels of the above three metals. The protocols used were from EPA Method 200.9: Determination of Trace Elements by Stabilized Temperature Graphite Furnace Atomic Absorption [21]. Not all samples were tested for metals. It was determined that samples with especially low pH to be tested for metals. The reason for this determination is that acidic solutions tend to make metals more soluble, so a low pH can be an indicator of potential heavy metals in water [11] and samples provided by residents living close to the industrial sites were given priority.
4. Results
Over a period of three years, four clinics were held, free of charge to the public. The data in Table 1 shows the number of tests that showed irregular results, outside of the listed safety limits of the measured items. In addition, the tests in 2012 were enhanced to include metals testing. This was only done for the samples that had pH out of range. There was only one result that yielded unsafe results for Lead contamination. This information is analyzed further in the discussion section.

Table 1. Water sample test results. Common water quality issues include pH, iron, hardness, total coliform, and E. coli in the private well waters tested.
4.1. pH
The importance of pH is noted as a potential indicator of threats to human health. The above data shows pH as having the highest occurrence among the tests for being out of a healthy range. Causes for this kind of are that natural and human processes determine the pH of water [22]. “High pH causes a bitter taste, water pipes and water-using appliances become encrusted with deposits, and it depresses the effectiveness of the disinfection of chlorine, thereby causing the need for additional chlorine when pH is high. Low-pH water will corrode or dissolve metals and other substances [22]. The main concern here is human health. Effective treatment options are available to help well owners with pH issues.
4.2. Nitrites
Nitrite testing is important because nitrites are used as food preservatives and in medicine to relieve cardiac pain [23]. They can cause infants below six months who drink water containing nitrite in excess of the maximum contaminant level (MCL) to become seriously ill and, if untreated, to even die [16]. Symptoms are indicated by shortness of breath and blue baby syndrome [16]. Fortunately, none of the samples tested in any clinic returned results of Nitrite over the recommended level, or MCL.
4.3. Nitrates
Elevated concentrations of nitrate in water from aquifers near the surface and used for domestic supply are of particular concern because many homeowners are not aware of possible risks [11]. Unlike public supply wells, domestic wells are not regularly monitored [11]. With this being the case, homeowners’ well water from the clinics was tested for nitrates. Nitrates can come from many sources: runoff from fertilizer use, leaking from septic tanks, sewage, and erosion of natural deposits [24]. Only 8 out of 200 samples yielded results that were out of range for nitrates. This is a very encouraging number for our sample size.
4.4. Hardness
Hardness was measured as a test of the amount of calcium carbonate in the water samples [25]. Hardness or softness of water also is a personal preference, as it also relates to how people feel the water affecting their hair or skin when washing with their water [25]. This test is, therefore, not a measure of something that affects human health; as a matter of fact, calcium and magnesium salts that used to measure hardness are actually essential nutrients [25]. Out of 200 samples tested, only 12 showed results out of range for Hardness. The remaining samples were all considered to be soft, therefore having no potential threat to build up any white scale on pipes or dishes [25].
4.5. Sulfate
Sulfate ( ) is a substance that occurs naturally in drinking water [26]. Sulfates are made up from sulfur and oxygen and are a part of naturally occurring minerals in some rock formations that contain groundwater [15]. Health concerns regarding sulfate in drinking water have been raised because of reports that diarrhea may be associated with ingesting of water containing high levels of sulfate [26]. Of particular concern are sub-groups within the general population that may be at greater risk from the laxative effects of sulfate when they experience an abrupt change from drinking water with low sulfate concentrations to drinking water with high sulfate concentrations [26]. The results here were found to be all within the range that is indicated by the EPA to be safe limits, although no actual regulations are in place for sulfates. They are part of the Secondary Maximum Contaminants Level (SMCL) determinations set by the EPA [27]. SMCLs are set for nuisance chemicals that only have aesthetic concerns rather than health concerns [27]. High levels of sulfates usually result in a salty taste to the water [27].
4.6. Iron
The testing for Iron is a nuisance test [27]. The presence or absence of Iron does not indicate a health concern if found to be over the recommended levels [27]. This test shows the level of Iron in drinking water for aesthetic purposes only [27]. These purposes are for color, odor and taste [27]. Problems associated with high levels of Iron include rusty sediment, a bitter, metallic taste, brownorange stains, iron bacteria, and discolored beverages [28]. Higher concentrations of dissolved Iron are considered typical in poorly oxygenated groundwater on the Delmarva Peninsula [11]. Out of 200 samples tested 32 tests returned with levels of Iron in them that are over the Secondary Maximum Contaminant Level (SMCL) designated by the EPA. This SMCL is not enforceable by any regulation, because the presence of Iron is not considered a risk to human health [27].
4.7. Fluoride
Fluoride is another nuisance chemical, as determined by the EPA, with only aesthetic concerns, rather than human health concerns when found in drinking water [27]. Fluoride helps with dental health so many water systems add small amounts to drinking water [6]. At the same time, excessive consumption of naturally occurring fluoride can damage bone tissue [6]. Levels of fluoride over the SMCL set by the EPA can cause tooth discoloration [27].
Out of the 200 samples that were tested since 2009, none of the samples were found to be over the SMCL recommended limit.
4.8. Total Coliform and E. coli
Total Coliform test indicates not a health threat itself, but rather is used as an indicator of whether or not potentially harmful bacteria may be present [29]. E. coli is a bacterium that indicates that the water may be contaminated with human or animal wastes [29]. Inside the gastrointestinal tract of humans and warm-blooded animals, E. coli poses no threat [30]. Disease-causing microorganisms (pathogens) in the wastes of humans or other animals can cause diarrhea, cramps, nausea, headaches or other symptoms upon ingestion [29]. These pathogens may pose a special health risk for infants, young children, and people with severely compromised immune systems [29]. Out of the 200 samples tested, 37 tested positive for the presence of Total Coliform bacterium, while 28 samples tested positive for the presence of E. coli.
4.9. Lead, Arsenic and Cadmium
Lead is a toxic metal that has been used for many years in products found in and around homes [31]. Lead is sometimes used in household plumbing components or in water service lines used to bring water from the main line into the home [31]. A prohibition on lead in plumbing lines has been in effect since 1986 [31]. Infants and young children who drink water containing lead in excess of the action level (greater than 15 parts per billion in more than 10% of water samples tested) could experience delays in their physical or mental development [31]. Children could also show slight deficits in attention span and learning abilities [31]. Adults who drink this water could develop kidney problems or high blood pressure [31].
Arsenic is a semi-metallic element in the periodic table [32]. Arsenic is odorless and it is tasteless [32]. It enters drinking water supplies from natural deposits in the earth or from agricultural and industrial practices [32]. People who drink water containing arsenic in excess of the Maximum Contaminant Level (MCL) for many years could experience skin damage or problems with their circulatory system, and may have an increased risk of getting cancer [32].
Cadmium is a metal found in natural deposits such as ores containing other elements [33]. Some people who drink water containing cadmium well in excess of the maximum contaminant level (MCL greater than 5 ppb) for many years could experience kidney damage [33]. The multiple health effects discussed are not intended to catalog all possible health effects for these metals [31]. Rather, it is intended to inform people of the most significant and probable health effects, associated with lead, arsenic and cadmium in drinking water [31].
4.10. Surveys
At the start and the end of each information session, participants were asked to take a Pre-test and a Post-test, in order to find out what kind of information was relevant in sharing new knowledge with participants. Less than fifty percent of the well owners who attended the clinics actually returned these tests. Out of that less than fifty percent, only some of the questions were answered correctly. Below you will find the questions that gave the community members trouble in answering correctly before the clinic (Table 2). During the clinic, all of this information was available to them, and they were able to answer the questions correctly following the information sessions. The correct answers are highlighted in bold.
Throughout the clinics, participants were also asked to fill out evaluation forms. These forms helped us to understand how the participants viewed the information that was shared, as well as shaped the learning that was gained from participating in the clinics. One hundred percent of the evaluations returned gave positive feedback on the personal opinions of the participants about the clinics. Ninety-three percent of participants had their water tested after attending the information session part of the clinic. In addition to enjoying the clinics, and having their water tested, there were also questions about the interactive learning that played out in the clinics. Sixty-five percent of participants decided that they will be more careful about activities that happen within fifteen meters (fifty feet) of their wells. This shows not only learning, but a heightened awareness of the importance of keeping drinking water wells safe from potential contamination that would be caused by above-ground activities.
5. Discussion
For all of the testing performed since 2009, most of results that vary outside of the recommended limits are pH, Total Coliform and E. coli. We will take a closer look at the Mid-Atlantic region that Delaware is included within on the Delmarva Peninsula. Within this region we will examine the geological formations that run underground, where drinking water wells find their water sources. We will also examine the U.S. Geological Survey information on the geography, elevations and water quality assessments. In addition, we will place our attention on responses to survey questions asked of the Drinking Water Quality Clinic participants to lead us to some determination of the reasons for the test results as well as the success of the outcome of the testing. Below is Figure 1 that contains an illustration of how the aquifers appear underground in the local region where water tests were performed, in addition to how wells are dug in these dif-
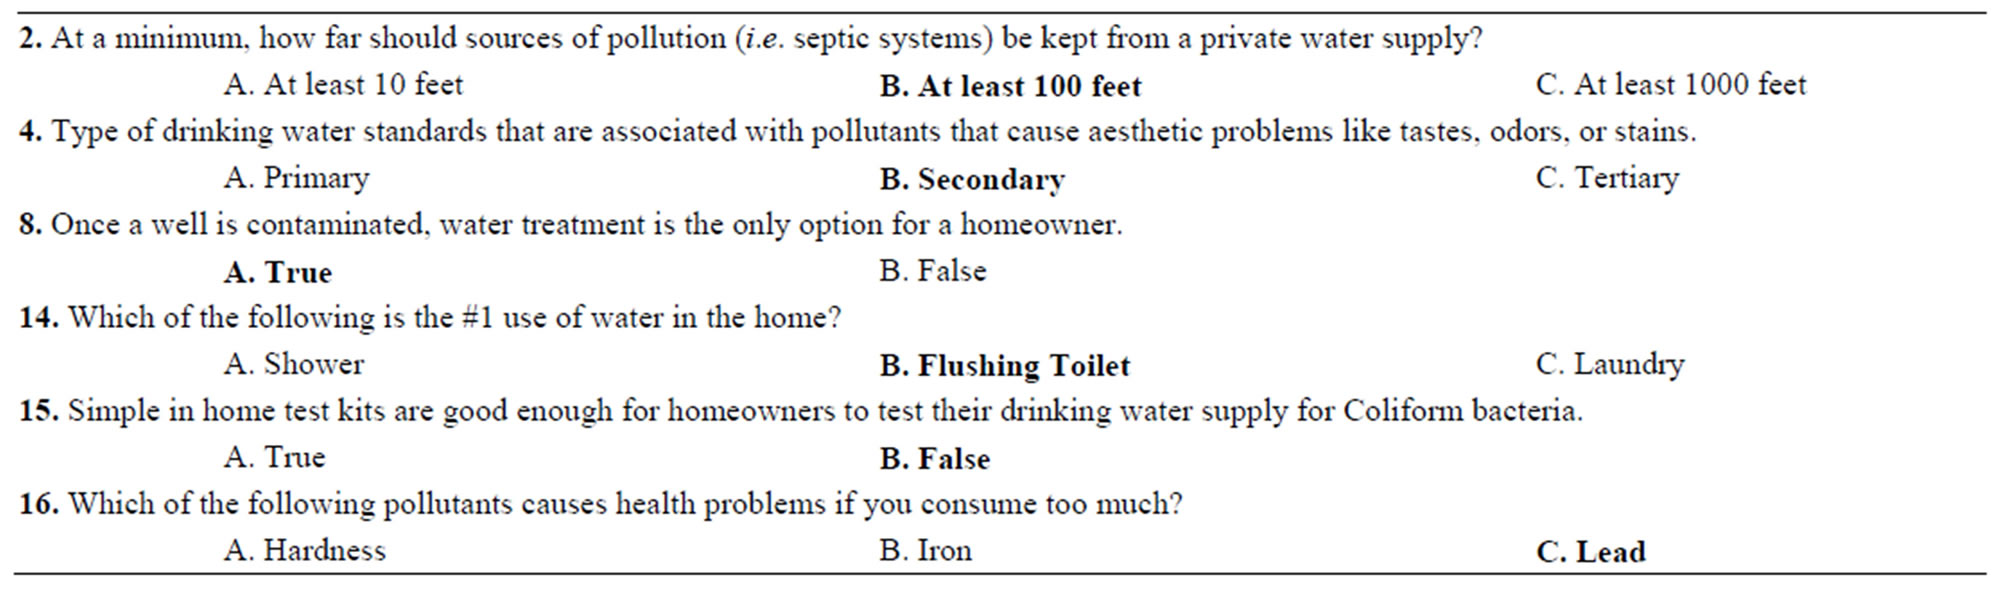
Table 2. Questions that well owners learned in the clinics. The table highlights few important questions regarding the well location, potential pollutants, and water treatment.
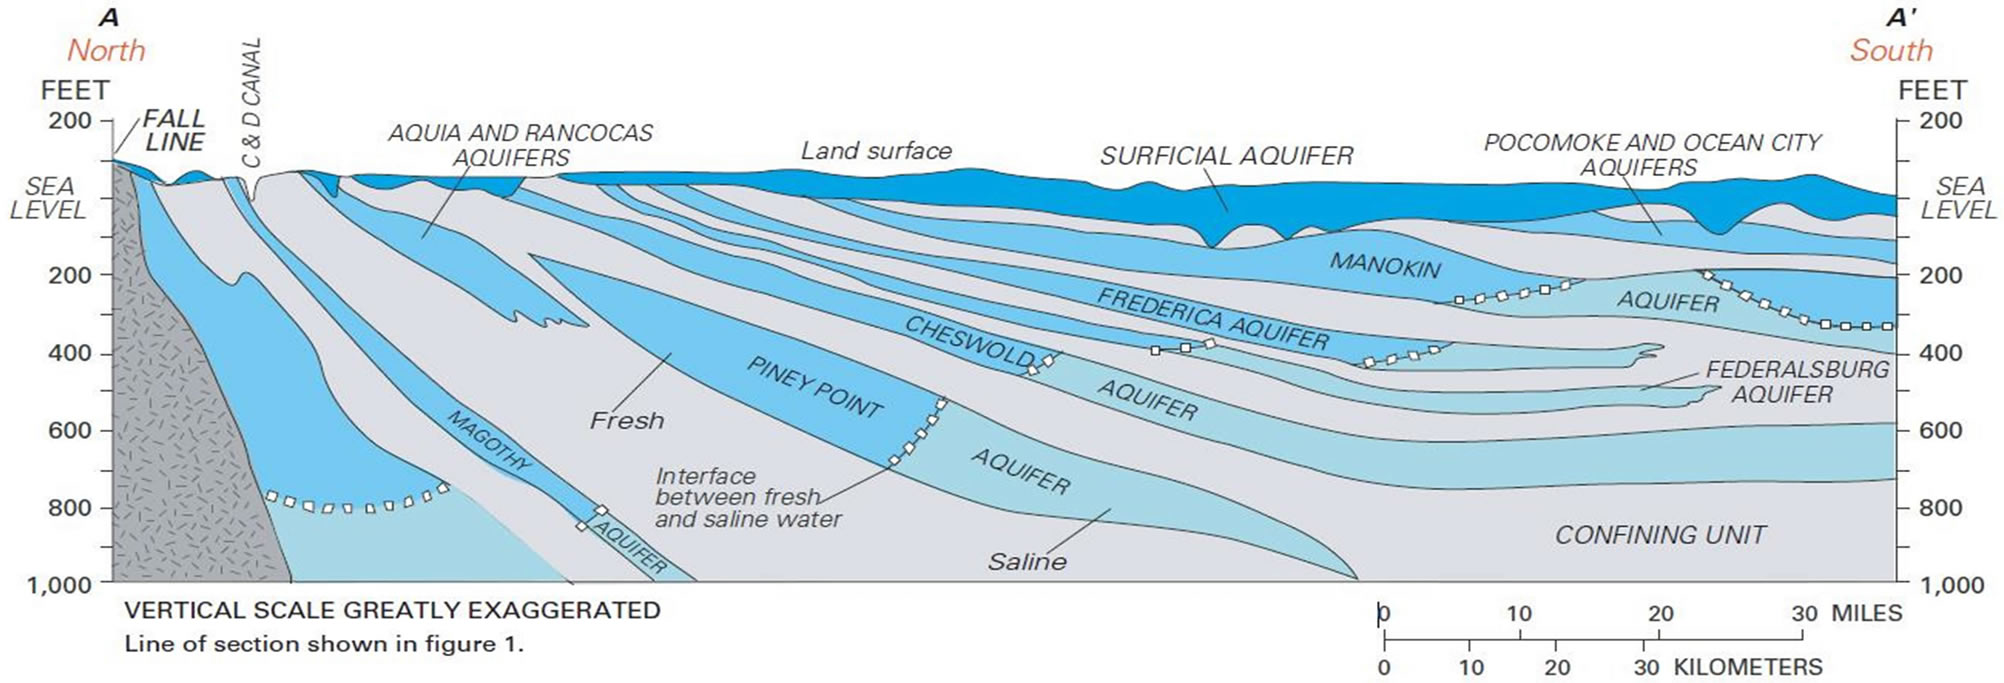

Figure 1. Sediments underlying the Delmarva Peninsula form an alternating series of confined aquifers and associated confining units, overlain by an extensive surficial aquifer that is under water-table conditions [11]. Well placement within aquifers to show how drinking water may be affected by having wells located in different kinds of aquifers.
ferent kinds of aquifers.
It is good to keep the above picture in mind in thinking of how the water may be obtained from well owners and delivered to their faucets. In addition, Map 2 demonstrates the local elevations in the area, so that we can properly view all aspects of the geography and geology. The previous figure is a picture of the land and water below the surface. The following figure is a picture of the land and water on top of the surface.
In addition, the information obtained here must be considered in the light of where these contaminants may be originating, in order to appear in the well water of the homeowners tested. Since most of the homeowners are in southern Delaware, Table 3 shows sources of nutrients in the Inland Bays in southern Delaware. This would lead to an idea of where the nitrates and nitrites may be coming from. It is also not beyond reason to think that the E. coli and Total Coliform bacteria may be originating from agricultural sources if the homeowner does not have a septic tank nearby or on site. Of course, septic tanks may also be causing the bacterial problems.
In the view of the region from above the surface, it is easy to see that the elevations are low. This makes the people who pull their drinking water from wells more vulnerable, because the water they drink is a younger age and more susceptible to contamination [36]. Considering these factors, we must take into account the depths of the wells found in this study. Approximately half of the wells in this program were over 61 meters (200 feet). Most wells above that depth, at the shallower depths, are the wells where the drinking water may be more vulnerable. This makes an even split in the well depth information that has been obtained for this study.
Moving forward, we will examine pH, and why so many samples in the clinics with many participants showed almost half of the samples with out of range pH. When the pH samples were out of range, mostly all of the samples were acidic, below the minimum recommended 6.5 pH, rather than above 8.5 pH. A look at Map 3 will show

Map 2. Local elevations of Delmarva Peninsula [35].
how this is consistent with the pH range for the entire eastern seaboard of the US.
It can be seen how low the pH of the precipitation in the eastern United States is generally much more acidic than the west coast, and much lower the pH is than the low part of the values within range of pH 6.5 - 8.5. All of the samples that were counted as being out of range are actually directly in line with the natural precipitation, and therefore, the natural surface water aquifers of this area of the nation. There are certain times when the pH is within the range given. These samples may be affected by one of two things: 1) either the aquifer that the well is contained within is deep and old, and is not affected by surface water pH, or 2) the homeowners have a water treatment system that directly influences pH of the drinking water.
The other guideline that was out of range of the safe drinking water limits is the Total Coliform and E. coli tests. These tests are very sensitive and show either the presence or absence of the Total Coliform and E. coli. The presence of Total Coliform in this study, almost always was coupled with the presence of E. coli. Because of the dangers of the potential of having disease causing microorganisms found with E. coli, it is strongly recommended to the participants who tested positive to begin with shock chlorination to kill all of the microorganisms in their well water. In addition, we recommend following up with another test at the State of Delaware Public Health Laboratory to ensure that the bacteria has been removed. In addition, we recommend considering an ongoing treatment option that will keep them bacteria-free. The ongoing treatment will ensure the health and safety of the homeowners and their families.
In looking at the relationship between wells and their locations on the property of the homeowners, it was also discussed that we look towards the septic systems. If E. coli comes from human pets waste, then it is imperative to be sure that human or pets waste is not located too close to the drinking water well. There was no statistical correlation between the locations of the wells in relation to the locations of the septic systems. Only two of the wells found to have the presence of Total Coliform and E. coli were located closer than the recommended 15 meters
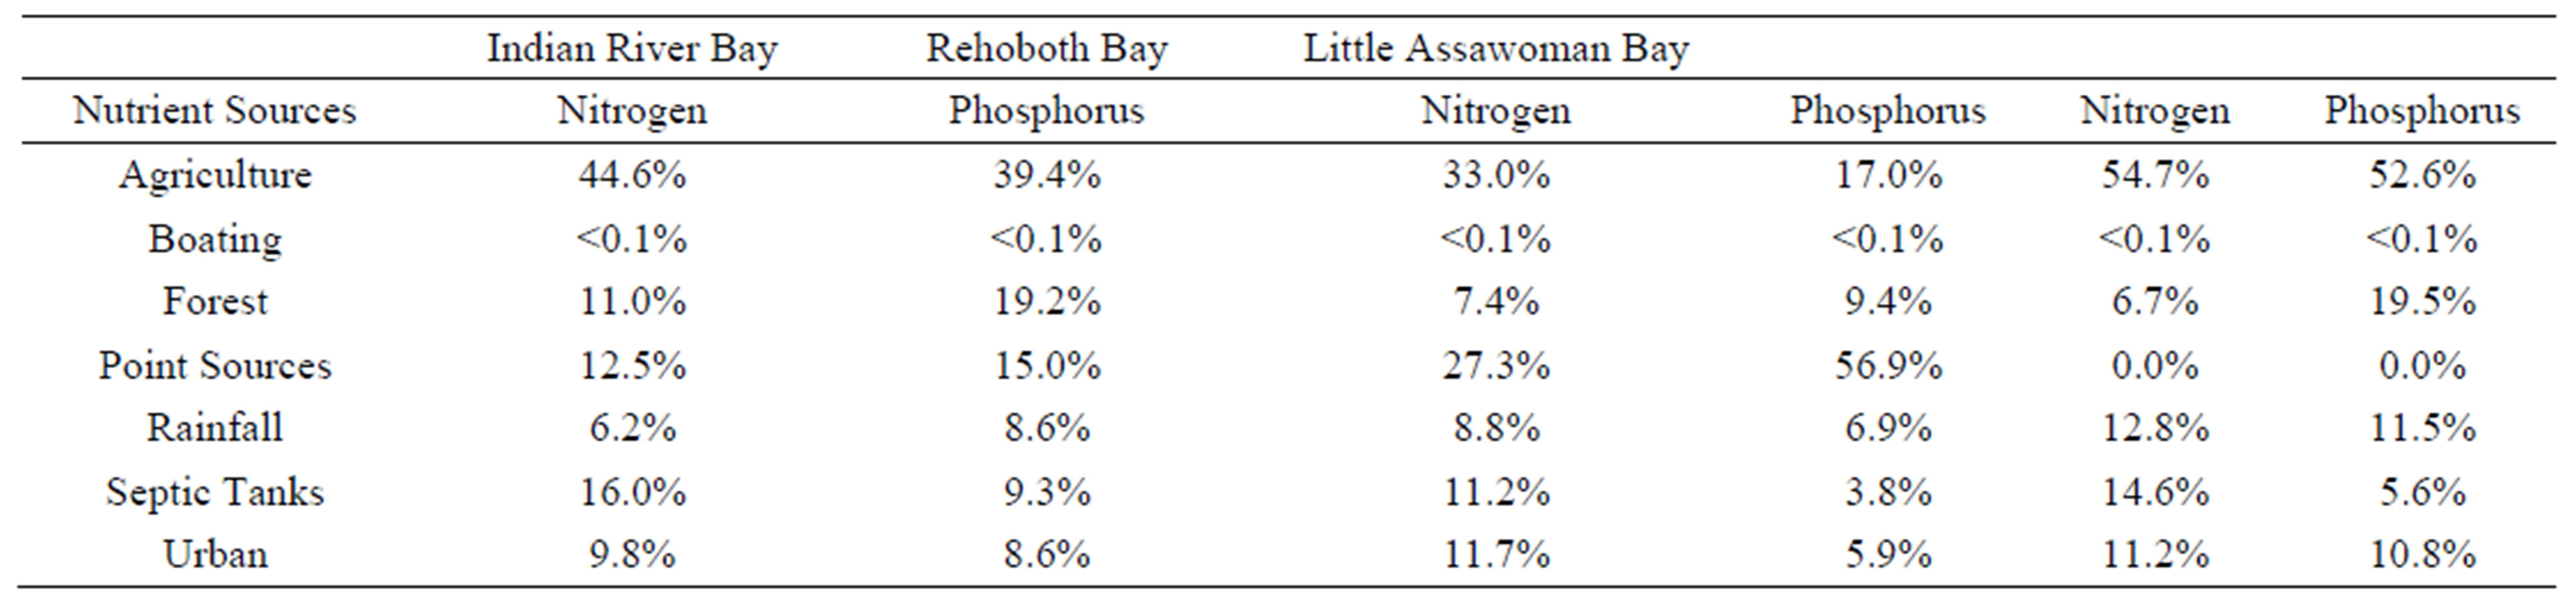
Table 3. Nutrient sources as indicated in waters of Delaware Inland Bays [34].

Map 3. pH of precipitation in United States (National Atmospheric Deposition Program, http://nadp.sws.uiuc.edu).
(50 feet) away from the septic system. However, in the State of Delaware, it is recommended that the well be located at least 30 meters (100 feet) away from the septic system in an unconfined aquifer. The shallow surface aquifers in this local region are probably mostly unconfined, unless the wells are drilled or dig to a depth of more than 61 meters (200 feet). Approximately half of the wells tested with the presence of Total Coliform and E. coli. Although there is no statistical evidence that these two (well location and septic system location) are related, it is always best to be safe about the quality of the drinking water that is being consumed. It will be an area for future study and analysis to interpret all homeowners’ location data and correlate this information with verifiable quantitative data regarding specific point and nonpoint sources of drinking water contaminants.
The Drinking Water Quality Clinics have been wellreceived at Delaware State University. Faculty, staff and students alike have attended the clinics to participate in the meetings and testing. In addition, the most impressive part of these clinics has been the contact and interaction with local well owners. Over 95% of the evaluations completed by participants had positive feedback and shared appreciation for the information (Table 4). In additionmany participants were interested in returning to have their water tested in the future. That is the best way to protect the safety of the people who drink well water. At least once a year, it is important to have the water tested to ensure there are no health concerns floating around in the drinking well water.
6. Acknowledgements
We would like to thank the following individuals for their assistance during the workshops and/or water testing clinics: Frank Marenghi, Brian Reckenbeil, Benjamin Reining, Kenneth Hannum, BalajiBabu, RajuKhatiwada, and Dr. Lathadevi Karuna Chintapenta of the Aquatic Sciences Program in Delaware State University. We would like to extend our sincere thanks to Ms. Corrie Cotton and Mrs. Daphne Pee of the Mid-Atlantic Water Program EPA Region 3 for their support throughout the program. We also would like to thank Mrs. Erin Ling and Dr. Brian Benham of the Master Well Owner Networking Program at Virginia Tech for their support and providing information and resources for us to share with the citizens. Finally, we would like to thank Mrs. Troy Darden and Mr. Pablo Mojica for their assistance with the program advertisements, flyers, and posters. Last, we are grateful to

Table 4. Clinic evaluation form. This is the exact form that participants filled out to share their opinions of the clinics, as well as what was learned or taken away from the clinics.
Dr. Asmare Atalay of Virginia State University for providing the funding for us to continue our program activities. This program is funded by USDA-MAWP for Master Well Owner Network (MWON) Program, USDANIFA and USDA-NIFA CBG for 1890 Water Resource Center Program.
REFERENCES
- Water Sanitation Health, 2013. http://www.who.int/water_sanitation_health/dwq/en/
- International Network of Drinking-Water Regulators, 2012. http://www.who.int/water_sanitation_health/dwq/RegNet/en/index.html
- Countries, 2013. http://www.who.int/countries/en/
- E. Ling, S. Clemens, G. Ozbay, C. Cotton, B. Benham, and D. Pee, “The Mid-Atlantic Master Well Owner Network: Educating Private Water Supply Users and Protecting Ground Water,”2012. http://www.usawaterquality.org/conferences/2011/sessions/presentations/A/Ling.pdf
- Environmental Protection Agency Website, “Private Drinking Water Wells,” 2013. http://water.epa.gov/drink/info/well/
- Environmental Protection Agency, “Pamphlet. Drinking water from Household Wells,” EPA 816-K-02-003, 2002.
- Water: Private Wells. Basic Information. 2013. http://water.epa.gov/drink/info/well/basicinformation.cfm
- C. Renshaw and J. T. Trippe, “Fresh-Water Cistern,” US Patent and Trademark Office, Washington DC, US Patent No. 3, 1970, pp. 517-513.
- National Water Program Outcome Report. Projects of Excellence. A Partnership of USDA CSREES & Land Grant Colleges and Universities. 65 pages (In page 8), 2010.
- E. Ling, B. Benham, S. Clemens, C. Cotton and G. Ozbay, “Mid-Atlantic Regional Master Well Owner Network. National Water Program. A Partnership of USDA NIFA & Land Grant Colleges and Universities,” Land Grant and Sea Grant National Water Conference Abstracts and Proceedings, Washington DC, Received 2010 Projects of Excellence.
- J.M. Denver, S. W. Ator, L. M. Debrewer, M. J. Ferrari, J. R. Barbaro, T. C. Hancock, M. J. Brayton and M. Nardi, “Water Quality in the Delmarva Peninsula, Delaware, Maryland, and Virginia, 1999-2001: Reston, Va.,” US Geological Survey Circular 1228,” 2004, 36 p.
- S. Clemens, “How to Interpret Water Test Reports: A Guide for Private Well Owners,” Pennsylvania State University, University Park, 2009.
- EPA, “Water: Monitoring and Assessment. 5.4 Ph. What Is pH and Why Is It Important?” 2013. http://water.epa.gov/type/rsl/monitoring/vms54.cfm
- EPA, “Water. Basic Information about Regulated Drinking Water Contaminants. Basic Information about Disinfectants in Drinking Water: Chloramine, Chlorine and Chlorine Dioxide,” 2013. http://water.epa.gov/drink/contaminants/basicinformation/disinfectants.cfm
- D. Varner, S. Skipton, P. Jasa and B. Dvorak, “Drinking Water: Sulfates and Hydrogen Sulfide,” University of Nebraska-Lincoln Extension, Institute of Agriculture and Natural Resources. Publication Number: G1275, 2004.
- Environmental Protection Agency Website, “Basic Information about Nitrite (Measured as Nitrogen) in Drinking Water,” 2013. http://water.epa.gov/drink/contaminants/basicinformation/nitrite.cfm#three
- P. D. Robillard, W. E. Sharpe and B. R. Swistock, “Nitrates in Drinking Water. Penn State. College of Agricultural Sciences, Cooperative Extension, Agriculture and Biological Engineering, University Park,” 2001.
- Environmental Protection Agency Website, “Total Alkalinity. What Is Alkalinity and Why Is It Important?” 2013. http://water.epa.gov/type/rsl/monitoring/vms510.cfm
- B.R. Swistock, W.E. Sharpe and P.D. Robillard, “Treating Coliform Bacteria in Drinking Water. Penn State. College of Agriculture Sciences. Cooperative Extension. Agricultural and Biological Engineering, University Park,” 2001.
- Palintest Test Instructions for Hardness, PM 254, AP 254 AUTO.PHOT.15.AUTO, 2005.
- J. T. Creed, T. D. Martin and J. W. Odell, “Method 200.9. Determination of Trace Elements by Stabilized Temperature Graphite Furnace Atomic Absorption,” Revision 2.2. Environmental Monitoring Systems Laboratory, Office of Research and Development, US Environmental Protection Agency, Cincinnati, 1994.
- H. Perlman, “Water Properties: pH. US Department of the Interior, US Geological Survey. The USGS Water Science School,” 2013. http://ga.water.usgs.gov/edu/ph.html
- Encyclopǽdia Britannica, “Encyclopǽdia Britannica Online. Encyclopǽdia Britannica Inc.,” 2013. http://www.britannica.com/EBchecked/topic/416124/nitrite
- Environmental Protection Agency Website, “Basic Information about Nitrate in Drinking Water,” 2013. http://water.epa.gov/drink/contaminants/basicinformation/nitrate.cfm#six
- P. D. Robillard, W. E. Sharpe and B. R. Swistock, “Water Softening. Penn State. College of Agricultural Sciences. Cooperative Extension. Agriculture and Biological Engineering, University Park,” 2001.
- Environmental Protection Agency Website, “Sulfate in Drinking Water,” 2013. http://water.epa.gov/drink/contaminants/unregulated/sulfate.cfm
- Environmental Protection Agency Website, “Secondary Drinking Water Regulations,” 2013. http://water.epa.gov/drink/contaminants/secondarystandards.cfm
- K. Mancl, P. E. Sailus and L. Wagenet, “Private Drinking Water Supplies: Quality, Testing, and Options for Problem Waters,” Cooperative Extension Publication NRAES-47. Northeast Regional Agricultural Engineering Service. Cornell University, Ithaca, 1991.
- Environmental Protection Agency, Office of Water, “Water on Tap: What You Need to Know,” Publication Number: EPA 816-K-03-007, 2003, 32 Pages.
- P. Feng, S. D. Weagant, M. A. Grant and W. Burkhardt, “Enumeration of Escherichia coli and the Coliform Bacteria,” Bacteriological Analytical Manual, Chapter 4, 2002.
- Environmental Protection Agency Website, “Basic Information about Lead in Drinking Water,” 2013. http://water.epa.gov/drink/contaminants/basicinformation/lead.cfm#content
- Environmental Protection Agency Website, “Basic Information about Arsenic in Drinking Water,” 2013. http://water.epa.gov/drink/contaminants/basicinformation/arsenic.cfm#content
- Environmental Protection Agency Website, “Basic Information about Cadmium in Drinking Water,” 2013. http://water.epa.gov/drink/contaminants/basicinformation/cadmium.cfm#content
- Delaware Inland Bays Estuary Program (DIBEP), Delaware Inland Bays Estuary Program Characterization Report. Science and Technical Advisory Committee, Dover, Delaware, 1993, pp. 1-3.
- W. E. Sanford, J. P. Pope, D. L. Selnick and R. F. Stumvoll, “Simulation of Groundwater Flow in the Shallow Aquifer System of the Delmarva Peninsula, Maryland and Delaware,” US Geological Survey Open-File Report 2012-1140, 2012, 58 p.
- S. Eberts and D. Hebert, “Studies Reveal Why Drinking Water Wells Are Vulnerable to Contamination,” 2013. http://www.usgs.gov/newsroom/article.asp?ID=2403
Note List of Main Abbreviations
EPA or USEPA—United States Environmental Protection Agency pH—Power of Hydrogen. Used as a measure of molar concentration of hydrogen ions in a solution.
E. coli—Escherichia coli WHO—World Health Organization MWON—Master Well Owner Network Mg/L—Milligrams per Liter. A measure of concentration of analyte in a solution.
MCL—Maximum Contaminant Level SMCL—Secondary Maximum Contaminant Level
NOTES
*Corresponding author.