Journal of Environmental Protection
Vol.4 No.11(2013), Article ID:39719,6 pages DOI:10.4236/jep.2013.411141
Biomass Accumulation and Water Purification of Water Spinach Planted on Water Surface by Floating Beds for Treating Biogas Slurry
![]()
Hubei Univesity, Wuhan, China.
Email: yuxiaomeifly@163.com
Copyright © 2013 Xiaomei Yu et al. This is an open access article distributed under the Creative Commons Attribution License, which permits unrestricted use, distribution, and reproduction in any medium, provided the original work is properly cited.
Received August 15th, 2013; revised September 13th, 2013; accepted October 12th, 2013
Keywords: Floating-Bed; Water Spinach; Piggery Wastewater; Purification
ABSTRACT
To find a new way treating the wastewater from biogas reactors in a pig farm, vegetated floating bed was built for observing the water-purifying capability of water spinach (Ipomoea aquatic) planted on the water surface. Experiments were carried out to record the growth and biomass accumulation of water spinach and its effect on purification of biogas wastewater. The results show that the water which mixed with biogas wastewater has been purified significantly by water spinach on the floating bed. During its growth season within four months, the overall length of water spinach reached 199 ± 35 cm, while its root length reached 63 ± 28.6 cm. The average weight of individual fresh plant is of 1285 ± 619.7 g. Meanwhile, the concentration of total nitrogen (TN) in water under the floating bed decreased from 8.9 ± 0.062 mg∙L−1 to 0.5 ± 0.011 mg∙L−1; the concentration of total phosphorus (TP) decreased from 4.4 ± 0.236 mg∙L−1 to 0.92 ± 0.024 mg∙L−1; the concentration of chemical oxygen demand (COD) decreased from 87.3 ± 6.68 mg·L−1 to 0.74 ± 0.46 mg·L−1. It suggests that the water spinach removed more than 90% of pollutants in terms of TN, TP, and COD from the water. Results show that the vegetated floating bed technique is a feasible way to dispose the biogas slurry.
1. Introduction
With the rapid development of the biogas engineering in pig farms, biogas slurry, as a by-product, accumulated as an environmental problem in rural China. Although biogas slurry is sometimes used as organic fertilizer [1,2], and more effective method is urgently needed since in quite a lot of pig farms, land is not sufficient for treating such huge amount of slurry. The purpose of this research was defined to develop a new way that could make use of biogas slurry more effectively.
Floating-beds system is an ecological remediation technology developed during the last century. It is comprised of plants and floating carriers [3]. By the assimilation of plants and microbial around the roots, water can be purified. Plants on the artificial floating bed can also embellish the landscape and bring economic value [4].
2. Materials and Methods
2.1. Study Site
The study was conducted in a pig farm at Tianmen city of Hubei province. The biogas reactor can deal with 40 - 50 t pig manure per day. The biogas dry residue is used to produce organic fertilizer, while the slurry discharged to the nearby ditch, which coursed critical water pollution. Our research thereby was defined to search an economical way to reuse the slurry and reduce the water pollution around the pig farm.
The chemical profile of the biogas slurry had been tested before starting the experiment. Since plants can’t survive directly on the slurry, a pond was selected for diluting the slurry. After the biogas slurry was mixed into the pond, the concentration of pollutants in the water mixed biogas slurry was checked (Table 1).
2.2. Materials
Plants for floating-bed should have a strong ability to purify the water. High growth rate and the flourishing roots are also the standards to choose the floating-bed plants [5]. Water spinach (Ipomoea aquatic) as a vegetable can grow in water bodies and has a marketable vale
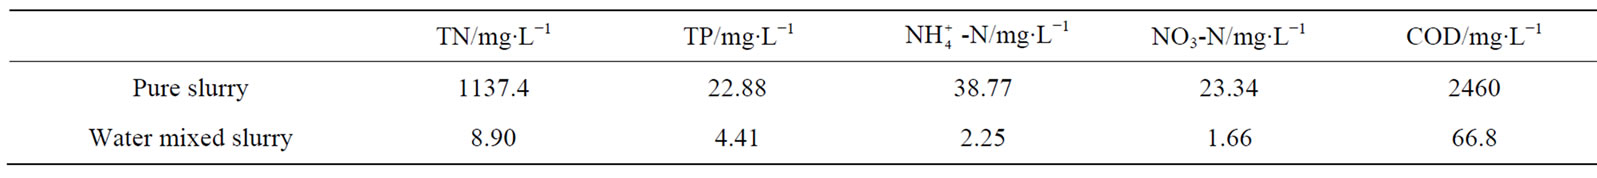
Table 1. Starting concentration of pollutants in the water mixed biogas slurry in the pond.
compared with many other aquatic plants. It was chosen in this study.
There are several kinds of floating beds, such as cystosepiment, rope-made carrier and bamboo-made carrier [6]. In consideration of the stability, durability, landscape, convenience and economy, rope-made carrier was chosen in this study.
This kind of carrier is made of PVC pipes and corrosion resistant plastic rope. The framework of carrier was made of four PVC pipes and had a size of 2 × 1 × 0.25 m (in width × length × height). And they’re connected by elbows which have 25 cm in diameter. These carriers are bistratal. So the roots and the stems can fasten to the rope respectively (Figure 1).
2.3. Method
The experiment was conducted from July 15th to November 28th in 2012. The pond for experiment was 100 m long and 30 m wide. The total area was 3000 m2. The coverage rate of floating beds was 30% in this study. And the floating beds were laid on the surface of the pond equably.
In this study, 390 floating beds were used. The area of per floating bed is of 2 m2, with the total area of 780 m2. Floating beds were arranged into 6 lines. These floating beds in a same line were fixed by rope. To avoid the uneven distribution of dissolved oxygen under the beds, we leaved a gap of 1 meter between every 5 floating beds and 2 meters between every two lines. These gaps can make it convenient for management (Figure 2).
2.4. Analysis
The samples of water and plant were taken from the pond every two weeks. The growth of plants and the appearance of water quality can be observed directly. Then these simples were brought back to the laboratory for chemical analysis, and the concentration of COD (chemical oxygen demand), TP (total phosphorus), TN (total nitrogen),  -N (ammonia nitrogen), NO3-N (nitrate-nitrogen) of the water were checked. The plant was measured in terms of length of root and stem, fresh weight of root and shoots. The content of nitrogen and phosphorus in the plants were tested as well. The analysis methods are as follows:
Analysis of water quality [7]:
1) Water quality-Determination of total nitrogen-Alkaline potassium persulfate digestion UV spectrophoto-
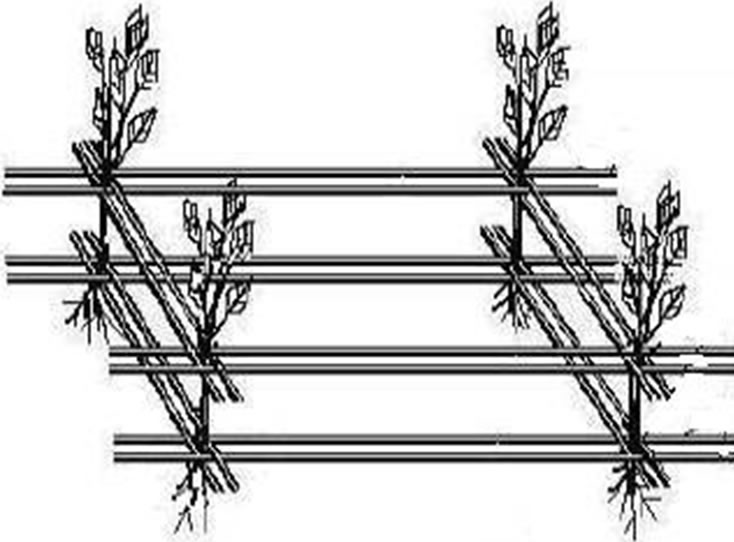
Figure 1. Fixing plants on floating bed.
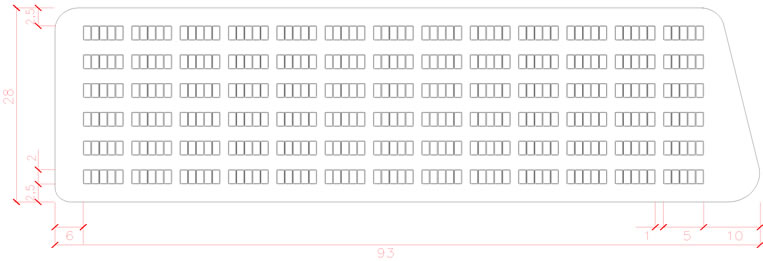
Figure 2. The arrangement of floating beds on the pond.
metric method GB/T11894-1989
2) Water quality-Determination of total phosphorusAmmonium molybdate spectrophotometric method GB/ T11893-1989
3) Water quality—Determination of chemical oxygen demand—Dichromate method GB/T11914—1989
4) Water quality—Determination of ammonia nitrogen—Nessler’s reagent spectrophotometry GB/T7479- 1987
5) Water quality—Determination of nitrate-nitrogen— Ultraviolet spectrophotometry GB/T7480-1987
Determination of plant:
1) Determination of total nitrogen in plant—H2SO4- H2O2-indophenol colorimetric method
2) Determination of total phosphorus in plant—H2SO4- H2O2-Molybdenum antimony colorimetric method
3. Results and Discussion
3.1. Biomass Production
3.1.1. The Biomass of Water Spinach
Within the growing season of water spinach in Tianmen from April to November, the survival percentage of plants reached 95%. These plants grew up and grew new leaves in the first two weeks. There was no obvious difference between the tested plants in the early. Sixty days later, the plants reached the highest peak of growth. The average length of plants reached 199 ± 554.33 cm. The average weight reached 1706 ± 1235.74 g (Table 2). In the middle of the tested period, the biomass among individual plants was significantly different, resulted in high variance of the data. In later October, the plants started wither.
3.1.2. Comparison of Roots and Stem
The biomass of the roots and cormus were compared in this study. The results were shown in Figure 4. The proportion of root showed a trend of increasing. The proportion of roots increased continuously along with the growth of plants. As time went by the plants turned withering, while the root were still flourishing (As shown in Figure 3). This phenomenon explained why the water can be purified in the whole process of experiment.
The production of the plants in this experiment can be calculated according to the biomass we tested. The method was as follow: the weight of per plant was 1.7 kg. There were 45 plants in every floating bed. The total production was 19.13 kg∙m−2.
3.2. Phosphorus Removal
Phosphorus is the essential nutrients for plant growth. It can be assimilated by plants and be converted into various kinds of organic matter of plants [8]. As can be seen from Figure 4, the concentration of phosphorus in the water changed obviously. It declined significantly 40 days later. The main cause was the floating plants thrive after transplanted for 40 days. The plants had a high growth rate with high effect of assimilation. The highest concentration of phosphorus we tested was 0.0843 ± 0.012 mg·L−1. It appeared at the 85th day of the experiment. After that the concentration of phosphorus increased with a narrow range. The result we tested the last time was 0.93 ± 0.024 mg·L−1. For instance, it was attributed to that the leaves of the water spinach fell off into the water at the end of the growth stage. Thus the phosphorrus in the leaves went back to the water. On the other hand, at the end of the experiment, the low conclusion of DO and phosphorus could not meet the growth demands of three aerobes growing on the surface of the roots. As a result, the concentration of the phosphorus increased.
3.3. Nitrogen Removal
The nitrogen in water exists in the form of organic nitrogen,  -N and NO3-N. The removal of nitrogen in water relied on the assimilation of plants on floating beds in this study. The nitrification and denitrification of the microbial around the roots also played an important role in purification. The organic nitrogen was transformed into ammonia nitrogen by the microbial at first. Then ammonia nitrogen was transformed into nitrate Nitrogen or nitrite nitrogen by further decomposition. Finally, they can be assimilated by plants or sent back to the atmosphere by the effect of denitrifying bacteria [9]. Therefore, the nitrogen can be removed from the water.
3.3.1. Analysis of Total Nitrogen Removal
The concentration of total nitrogen in water was shown in Figure 5. The variation tendency of total nitrogen was in step with the phosphorus on the whole. The initial concentration of total nitrogen in water was 8.9 ± 0.062 mg·L−1. The concentration decreased to 6.4 ± 0.122 mg·L−1 after 15 days. The decreased percentage was 28%. The efficiency of nitrogen was lower than the phosphorus at the same period. It may be caused by the heavy rain. The pollution flowed into the pond with the rainwater. And the concentration of nitrogen increased a little as result. While the concentration showed a trend of decrease on the whole. The concentration was 0.5 ± 0.011 mg·L−1 when we tested the simple water the last time. Total removal efficiency reached as high as 94%.
3.3.2. Analysis of Nitrate Nitrogen Removal
As shown in the Figure 5, the concentration of nitrate nitrogen in water showed a trend of decrease on the whole. Initial nitrate concentration was 1.65 ± 0.035
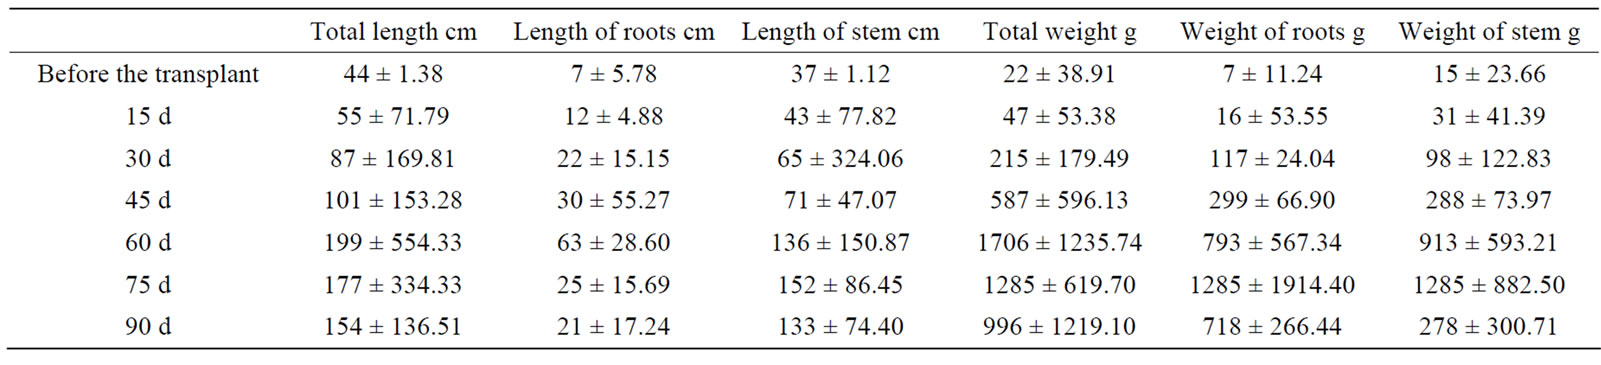
Table 2. Biomass accumulation of plants.
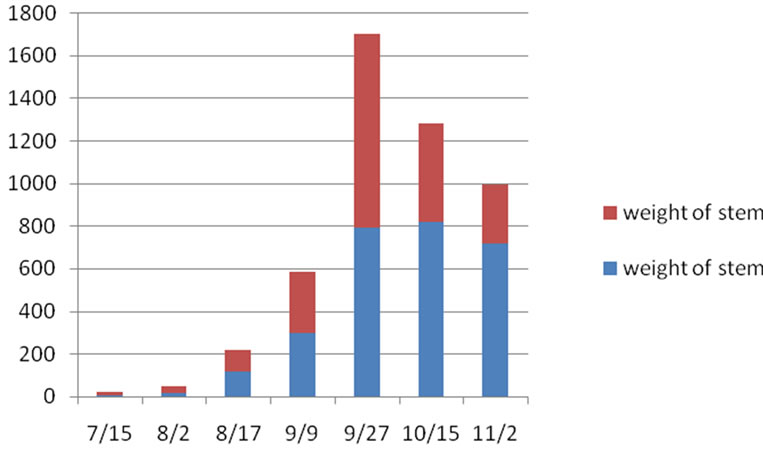
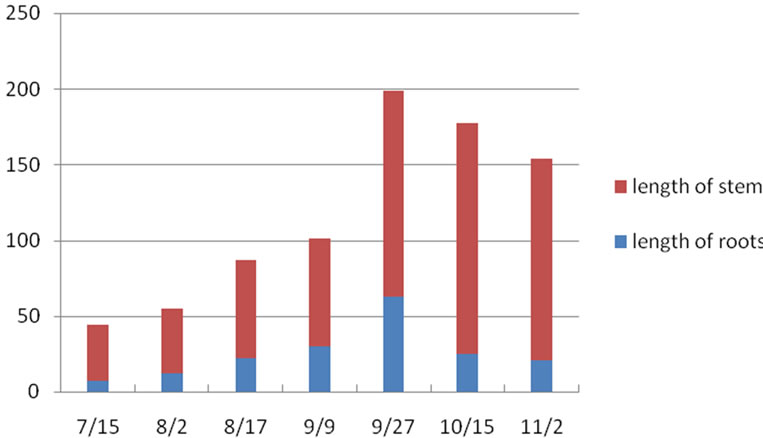
Figure 3. Comparison of biomass between roots and stems.
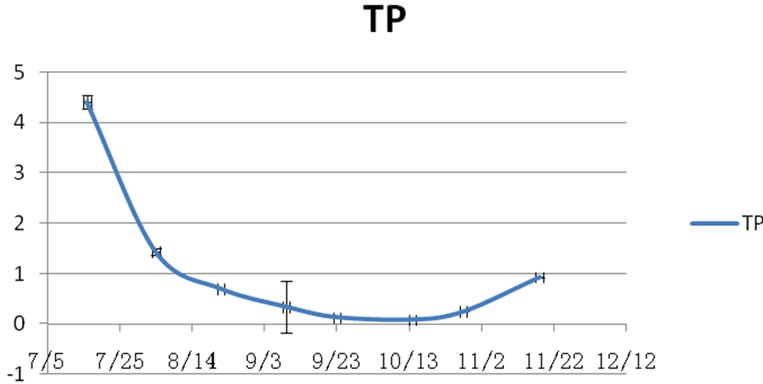
Figure 4. Concentration of phosphorus in pond.
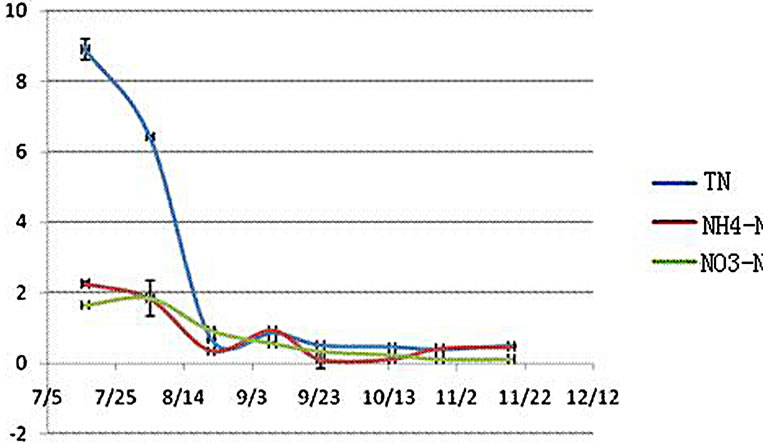
Figure 5. Concentration of nitrogen.
mg·L−1. The concentration increased to 1.85 ± 0.028 mg·L−1 14 days later. It may be due to the time is too short for plants to group in a new environment. The plants could not assimilate the nitrate nitrogen in time. After a period of growth, the vast majority of nitrate nitrogen in water was purified. The concentration decreased to 0.121 ± 0.054 mg·L−1 in the end. The removal rate reached 93%. It was observed that the system of floating beds has a high effect on nitrate nitrogen removal.
3.3.3. Analysis of Ammonia Nitrogen Removal
The concentration of ammonia nitrogen had a same tendency as nitrate nitrogen. The initial concentration was 2.25 ± 0.029 mg·L−1. It can be seen that the concentration fluctuated within a narrow range in the whole process of the experiment. It was due to that the experiments were tested out of door. So, unexpected environmental accidents may cause the increase of concentration.
3.4. COD Removal
Previous research showed that COD can be assimilated by plants. The microbial around the roots can also contribute to the purification. The flourishing roots can provide a comfortable environment for the microbial. Thus the organic matter can be removed effectively.
The concentration of COD in water was shown in Figure 6. The concentration decreased from 87.3 ± 6.68 mg·L−1 to 0.74 mg·L−1 in the whole process. 99% of the COD was removed from the water. The efficiency of removal in different stages is quite difference. The efficiency in the beginning was lower than in the middle time. This could be attributed to that the plants need a period of time to adapt the new environment. When the roots grew flourishing, the plants can purify the water by assimilation. On the other hand, the frequent heavy rain in summer also influenced the result of water quality. On generally, the efficiency of removal was better than we tested in laboratory before. It was due to that the pond in nature had a better function in self-purification.
3.5. The Nitrogen and Phosphorus in Plants
The concentration of nitrogen and phosphorus in tested
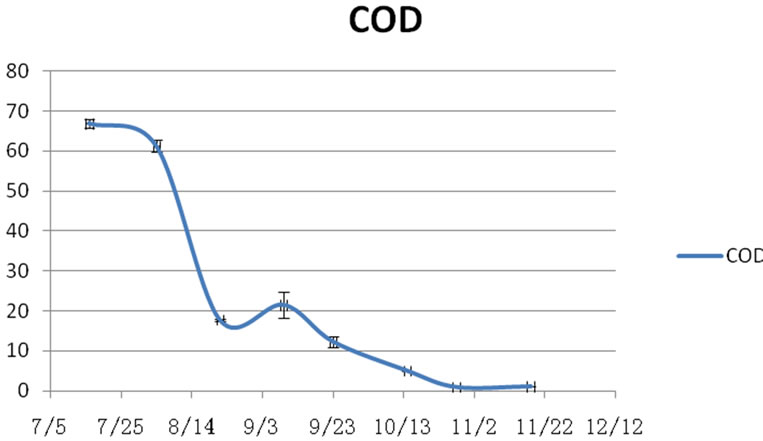
Figure 6. concentration of COD.
water decreased markedly. In addition to the self-purification of the pond, most of the pollutant was assimilated by the plants. We tested the phosphorus and nitrogen in the plants. The results were shown in Table 3.
The experiment results showed that phosphorus and nitrogen were accumulated in the plants. In the whole life of the plants, N increased 33% and P increased 44%. We quantified the purification efficiency of floating beds. For nitrogen, the result was 11.8 g∙m−2. And for P, it can reach 8 g∙m−2. According to the Standard GB3838-2002, 1 m2 of floating bed system can improved the nitrogen in 11 m3 of water from V class to III class. For P, 1 m2 of floating bed system can be purified 8 m3 of water from V class to III class. It can be seen that the purification efficiency is significant.
3.6. Relations between Biomass and Purification Efficiency
To find the relations between the biomass of water spinach and purification efficiency, we calculated the growth rate, biomass and the removal rate of pollutants for correlation analysis. The result was shown in Table 4.
As shown that the N, P and COD in water all show negative correlation with biomass of water spinach. It can be indicated that the growth of floating plants had a good potential in pollutant removal. The most significant negative correlation is −0.9 between the weight of roots and TN. Thus the absorption of ammonia nitrogen is closely related to the plant root growth. According to the result in Table 4, the total length of water spinach has the most relevant concentrations with N, P. It can be concluded that the longer the floating plants the higher the removal rate.
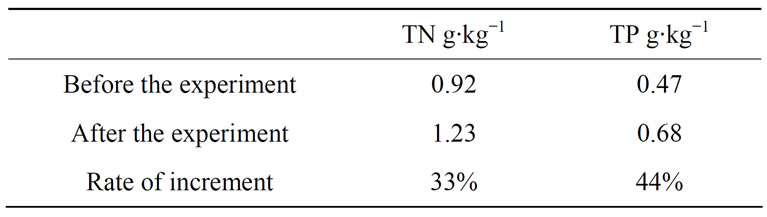
Table 3. Phosphorus and nitrogen in plants.
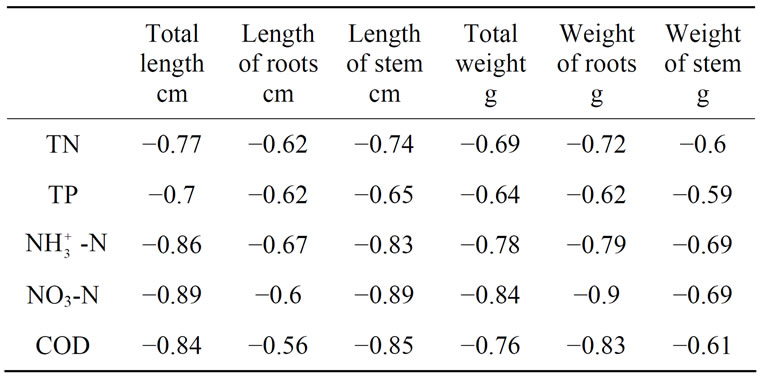
Table 4. Correlation analysis.
4. Conclusions
The experiments showed that floating bed system had high effect in purification. The removal rates of pollutants in water were all above 90%. The effect of purification in the pond was much higher than in the laboratory. As the water in pond was mixed with biogas slurry, it may be the high initial concentration. In addition, the pond in nature with a strong self-purification function can improve the purification efficiency. The result also showed significant negative correlation between biomass of plants and pollutant in water. It can further prove that the floating plants can assimilate the pollutant in water.
Generally speaking, purifying the biogas slurry by floating bed system is an effective way. But component and concentration biogas slurry should be analyzed to find the optimal dilution mixing ratio before the experiments were conducted to make sure the floating plants can grow well. As the plants in this experiment are high yield, finding suitable ways to dispose the floating plants is a difficult problem. Nowadays the mature plants of floating beds can be used to fish farming or feed processing. So to find new ways to dispose these plants is imperative.
REFERENCES
- P. Zhou and H. Q. Yang, “Research of Diagnosis Method to Engine Driving Force Insufficient,” Journal of Agricultural Mechanization Research, Vol. 4, No. 4, 2011, pp. 334-336
- H. L. Gao, “Effects of Biogas Fertilizer on Output and Quality of Brassica Chinensis and Soil Quality,” Journal of Agro-Environment Science, Vol. 29, No. 5, 2010, pp. 43-47.
- J. Zhang, W. Huang and L. H. Sang, “The Water Purification Ability of Plants on Floating Bed and Its Influencing Factors,” Journal of Yangtze River Scientific Research Institute, Vol. 28, No. 12, 2011, pp. 242-245.
- L. M. Wu, H. B. Cong and X. F. Wang, “Effect of Three Kinds of Floating-Bed Plants and Artificial Plants on Nitrogen and Phosphorus Removal in Water,” Environmental Science and Technology, Vol. 23, No. 3, 2012, pp. 12- 16.
- D. W. Xu, L. N. Chen and Q. Ma, “Application and Research Process of Ecological Floating Bed Technology,” China Water & Wastewater, Vol. 26, No. 14, 2006, pp. 11-15.
- P. Dai, X. G. Wu, W. H. Zhang and X. F. Zhang, “Development in the Study of Man-Made Floating Culture Islands’ Carrie,” Environmental Science and Management, Vol. 5, 2007, pp. 85-87.
- “Analysis Method of Water or Wastewater,” 4th Edition, China Environmental Science Press, 2002.
- G. P. Gu, L. Y. Zhou and S. Wang, “Primary Study on the Removal Efficiency of Nitrogen and Phosphorus of Eutrophic Water Body by Planted Float Ipomoea Aquatica Forsk,” Auhui Agricultural Science Bulletin, Vol. 14, No. 19, 2008, pp. 134-137.
- H. Xu, H. Z. Chen, Q. Q. Xiong and B. Z. Wang, “Studies on the Efficiencies and Mechanisms of N and P Removal in Macrohydrophyte Ponds,” Journal of Harbin University of C.E. & Architecture, Vol. 32, No. 4, 1999, pp. 33-47.