Energy and Power Engineering
Vol.07 No.09(2015), Article ID:59058,8 pages
10.4236/epe.2015.79038
Physicochemical Characterization of Photoelectrodes of Ti/TiO2 Prepared by Thermal Oxidation of Titanium
Marcos M. Pedemonte, Alberto L. Capparelli*
Instituto de Investigaciones Fisicoquímicas Teóricas y Aplicadas (INIFTA), Departamen to de Química, Facultad de Ciencias Exactas, UNLP, CCT La Plata-CONICET, La Plata, Argentina
Email: alcappa@quimica.unlp.edu.ar, *alcappa2000@yahoo.com.ar
Copyright © 2015 by authors and Scientific Research Publishing Inc.
This work is licensed under the Creative Commons Attribution International License (CC BY).
http://creativecommons.org/licenses/by/4.0/


Received 15 June 2015; accepted 22 August 2015; published 25 August 2015
ABSTRACT
The preparation and study of supported TiO2 for photocatalytic application in solar cell devices is a relevant research field. Thin films of TiO2 prepared on Ti by thermal oxidation in a wide range of temperatures (450˚C - 900˚C) were characterized by electrochemical impedance spectroscopy, potentiometry and amperometry. This material presents photoelectrochemical activity, which depends dramatically of the oxidation temperature and the exposition time at the studied temperatures. The flatband potential as well as the donor density and the resistance to the charge transfer were measured. All these parameters are temperature dependent, and the optimal values are observed on the photoelectrodes prepared at 750˚C. This result is consistent with the photochemical response reported in the literature for thin films of Ti/TiO2 prepared under similar conditions.
Keywords:
Ti/TiO2 Photoelectrodes, Flatband Potential, Mott-Schottky and Nyquist Diagrams

1. Introduction
Ti/TiO2 photoelectrode becomes one of the relevant materials in studies related to the application towards clean energy using the solar radiation [1] . The photochemical activity of this material is dramatically dependent on the method applied in the construction of the photoelectrode. Different methods and material have been applied in the construction in this system looking for the best performance and reproducibility of this kind of photoelectrode [2] .
When clean metallic Ti is exposed to air, a very thin film of TiO2 grows up on the surface. If this system is heated in air atmosphere, the oxide films increases but crystallographic morphological changes take place on the film [3] -[5] .
It has been found that current measured in chronoamperometric experiments increases when the material is exposed to visible light. We have found that the thermal treatment of the material leads to a larger photocurrent output when films are prepared at the temperature of 750˚C [5] .
Electrochemical impedance spectroscopy (EIS) allows us to get information on the number of charge carriers, the flatband potential and the resistance to the charge transfer [6] -[9] measured on thin films of TiO2 of different samples, obtained after the heat treatment at 450˚C, 600˚C, 750˚C and 900˚C and the reference material exposed at air at room temperature. It is well known that these set of parameters are of interest in the search of materials with higher photoelectrochemical performance.
The flatband potential is related to the space charge layer which is generated when the electrode is dipped into the solution. An electric field arises between the semiconductor surface and the solution. If the electric field increases, the recombination hole-electron in the semiconductor film decreases [8] [10] . The comparison of the flatband potential of the different TiO2 thermally prepared on the Ti surface is a criterion to be considered in the analysis of the performance of the material as an efficient photoelectrode.
We are interested in material with higher yields in connection with the conversion of solar light in chemical energy. In order to accomplish with this target, we expect to prepare photoelectrodes presenting a small resistance to charge transfer, a larger number of charge carriers and a big flatband potential should be expected.
The main objective of this study was the characterization of TiO2 films grown on Ti surface after thermal treatment at different temperatures with the help of the electrochemical impedance spectroscopy and the comparison of the results with other studies performed in our laboratory with the help of amperometry and potentiometry methods as reported previously [5] .
2. Experimental
2.1. Photoelectrode Preparation
A set of 11 plates of Ti (Johnson Mattey, 99.7%) of approximately 100 mm2 were employed in all experimental conditions. The plates were polished till the surface becomes mirror-like using a 1 µm and 0.3 µm particle size alumina suspension (Büehler). These plates were heated in an oven in atmosphere of air at a rate of 20˚C∙min−1. As soon the desired temperature was reached, the plates were taken out of the oven. Four of these plates were heated till 450˚C, 600˚C, 750˚C and 900˚C and taken out of the oven when the temperature reached the desired value. These temperatures will be referred as quenching temperatures. Another set of three plates were allowed to be heated 30 minutes at 450˚C, 600˚C and 750˚C respectively. Finally, a third set was 3 plates were heated 60 minutes at 450˚C, 600˚C and 750˚C. A reference plate remains without thermal treatment.
The reference and the 10 plates, once cooled, were covered by an epoxy resin leaving a section of 64 mm2 for photo-electrochemical experiments.
2.2. Electrochemical Studies
The cell consisting of three electrodes, the photoelectrode as a working electrode (WE) with Pt electrodes symmetrically arranged as counter electrodes and a reference of Hg/HgO were employed in all measurements.
All experiments were carried out at 25˚C. A 6 M KOH (p.a.) aqueous solution was the electrochemical media. Measurements under light irradiation were carried out employing a dichroic lamp of 250 W (Zurich MR16) settled at 16 cm of the photoelectrode surface.
2.2.1. EIS Studies
The equivalent circuit shown in Figure 1 was used for evaluating the charge transfer resistance (Rct) in all the studied samples. The ohmic resistance RW as well as the capacitance C of the material is also shown in Figure 1.
The Rct values were obtained from each photoelectrode taking at the repose potential an impedance spectrum in the range 100 kHz to 1 MHz. These results were fitting using a standard soft for this sort of calculations.
The analysis of the Mott-Schottky plot [11] [12] can be applied to measure the flatband potential. The space charge layer Csc is the usual parameter to be measured in this kind of studies. As reported in the literature, a
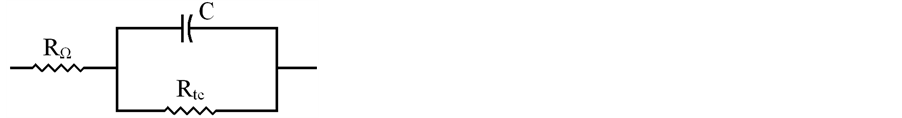
Figure 1. Equivalent circuit for EIS.
 plot versus the applied potential (V) to the photoelectrode lead to the typical Mott-Schottky plot. Equation (1) can be used to interpret the experimental results,
 (1)
(1)
In Equation (1), e0 is the elemental charge, Nd is the donor density, ε is the dielectric constant of TiO2, ε0 is the permittivity in the vacuum, V is the applied potential, Vfb is the flatband potential, k is the Boltzmann constant and T is the temperature of the solution.
A linear dependence between
 and V should be expected. The donor density is obtained from the slope of this plot. The value kT/e0 is normally smaller than the difference
 (kT/e0 = 0.03 V at 298 K) and it can be ignored in standard studies. Therefore, the flatband potential is obtained by extrapolation of the linear plot to
 .
.
The Csc is measured as the imaginary component (Im) in impedance measurements at the frequency f (in Hertz) using an electrode of area A, as given by Equation (2),
 (2)
(2)
Spectrochemical impedance measurements were carried out employing an impedance analyzer Zahner IM6. An external overvoltage of 5 mV was chosen and applied in all experiments performed with this equipment.
2.2.2. Current and Potential Measurements on the Photoelectrode
The measurements were carried out in short circuited conditions irradiating the photoelectrode against an electrode of Pt. Both electrodes were dipped in the electrolyte solution. The photocurrent was measured with a microamperimeter Kipp and Zoner (AL4 model).
A similar set of experiments were carried out in open circuit conditions with the photoelectrodes in darkness and under irradiation. These experiments were used for characterizing the photoelectrodes and for measuring the photoactivity of the materials under studies. These potential difference against the Hg/HgO electrode was recorded with a potentiostat PAR model 263 A.
3. Results
3.1. Potentiometry and Amperometry Results
The potential of the photoelectrodes in darkness and under irradiation as well as the output photocurrent is listed in Table 1, where the results in darkness and under irradiation are shown. Experimental conditions can be read in Table 1 legend.
As seen in this Table, excluding the reference, the response of the photoelectrodes depend on the quenching temperature and the time of heating of the material at a given temperature. Even though the behavior is strongly dependent how the material was handled (temperature quenching and time of heating at a given temperature during 30 and 60 minutes), the best photochemical answer is observed in the material prepared at 750˚C. This behavior is consistent with previous results obtained in our laboratory [13] .
An interesting behavior can be observed in Table 1. In fact, the potential in darkness depends dramatically on the temperature program applied to the material whereas the potential measured under light irradiation is almost independent on the quenching temperature applied on the same material. The thermal treatment induces morphological changes on the surface [4] -[6] , being these changes responsible of the voltage measured in darkness, but the similar values observed under irradiation can be attributed to the TiO2, which is the photo active material.

Table 1. Difference of potential measured in the photoelectrde in darkness and under irradiation (open cirduit) versus Hg/HgO and photocurrent measured under irradiation at closed circuit with a counter-electrode pf Pt. In the first column 450.30 means 450˚C and 30 minutes of heating at this temperature. A similar nomenclature is appied to all experimental conditions in this column.
Moreover, the largest output photocurrent is obtained from the material prepared at 750˚C. Except for the reference and the photoelectrode prepared at 900˚C; these results are reproducible, even though the measurements were carried out several days after their preparation.
The behavior of these magnitudes show that the photoelectrode quenched at 750˚C presents the optimal photocurrent. These results can be correlated with the optimal thickness and the ratio of the anatase/rutile crystalline forms on the films as seen by X-ray diffraction and SEM studies reported in earlier studies [5] .
A small current intensity (1 mA) is recorded in the blank and the photoelectrode prepared at 900˚C. However, these values decays to negligible values (<1 µA) in a few minutes. Some instability are observed which can be associated to morphological changes on the electrodes, i.e., if the mirror-like Ti electrode is dipped alone into the solution, there are visual changes in the reflectance of the surface, but when is connected to the Pt counter electrode, the visual appearance of the surface changes, and a dark-grayish tonality is developed. This behavior is not observed on the other photoelectrodes, which show stability and reproducibility as reported in the literature [5] .
The thickness or amount of the TiO2 on the surfaces should increase regularly with the time of heating leading to a better performance of the photoelectrochemical behavior. At 750˚C, the photocurrent is the highest observed in our experiments, but it decreases by a factor 3 to 4 with the heating time of this photoelectrode.
3.2. Nyquist Diagrams
Nyquist diagrams obtained on the photoelectrodes prepared at 750˚C are shown in Figure 2. As seen in these plots, at higher frequencies the typical loops are observed. At lower frequencies a difusional behavior can be observed but not depicted in these Figures, because we are only interested in the parameters associated with the charge transfer processes. The difusional contribution is only observed in the photoelectrode prepared at 750˚C which presents a lower charge transfer resistance in comparison with the other electrodes listed in Table 2.
Nyquist diagrams shown dramatic differences when the measurements are carried out in darkness and under illumination. A significant decreasing the charge transfer resistance in the illuminated photoelectrode is recorded, as consequence of the catalytic effect of the TiO2 under irradiation.
In Table 2 are resumed the experimental results measured in these set of experiments. All the Rct listed this Table show an important decrease when the photoelectrodes are irradiated. These parameters are temperature dependent as can be observed for all photoelectrodes analyzed in this study. Even though the photocatalytic effect of light is observed in all samples, the effect is more important in the photoelectrode prepared at 750˚C.
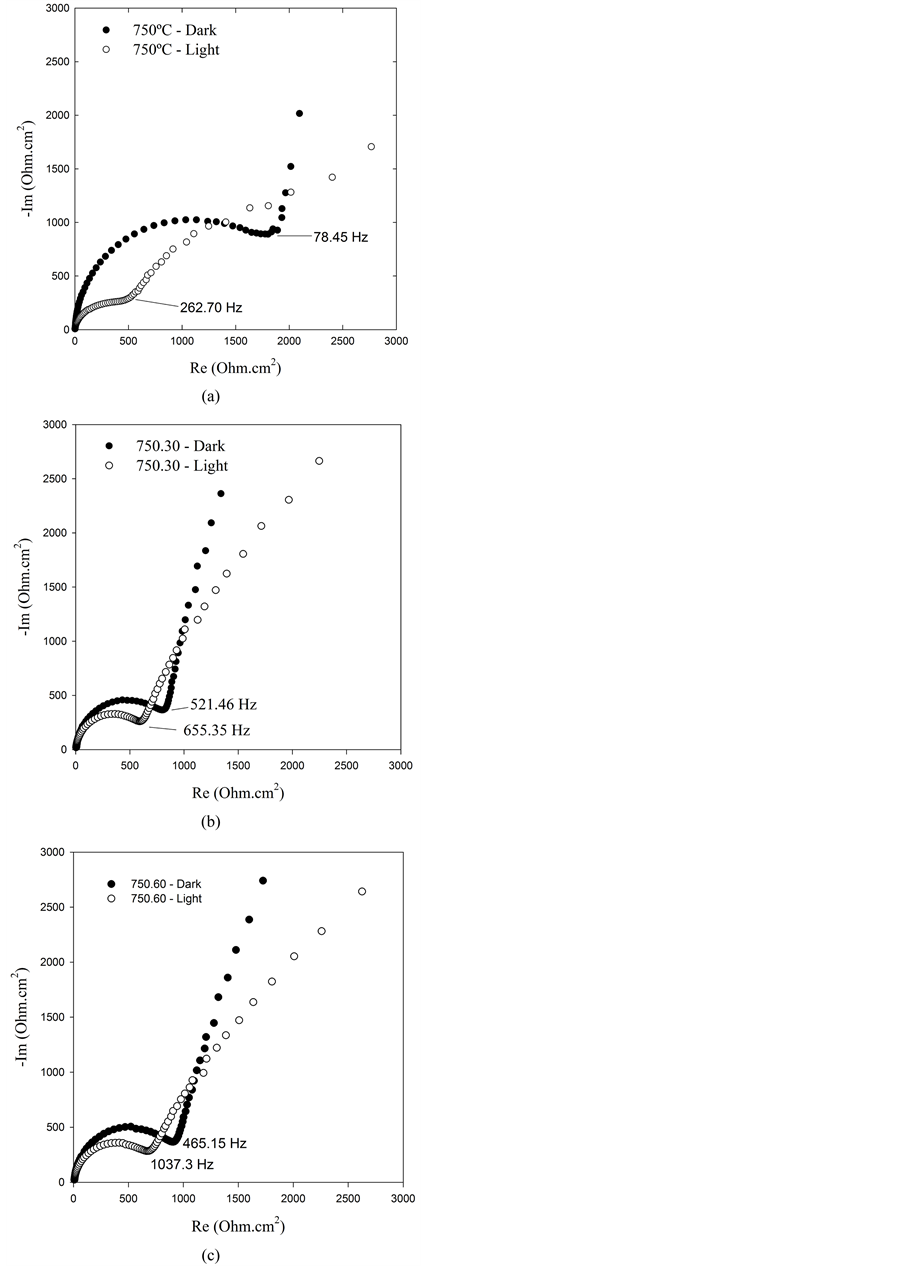
Figure 2. Nyquist diagrams obtained using photoelectrodes prepared at 750˚C and different times of heating: (a) quenching at 750˚C, (b) maintained at 750˚C during 30 minutes and (c) maintained at 750˚C during 60 minutes.
Table 2. Experimental results of charge transfer resistance (Rct) and degree of fitness (n) obtained in darkness and under light illumination for all samples. The nomenclature employed in the first column is the same as described in Table 1.
As seen in Table 1, the photocurrent output increases with the temperature, being higher on the photoelectrodes prepared at 750˚C, meanwhile, as observed in Table 2, the Rct value is the most small. As can be seen the Table 1, the parameter n » 1 suggests that the model depicted in Figure 1 fits reasonably well the experimental results.
3.3. Mott-Schottky Plots (MS)
Plots of
 versus the applied potential V are shown in Figure 3. In all cases V was measured against a Hg/HgO electrode. The slopes in all cases are positive as expected for a semiconductor type n [11] .
The slopes and the intercepts of MS plots are also temperature dependent as seen in these Figures. New sets of photoelectrodes were prepared to perform these experiments as described in section 2.1.
As usual, experiments were performed in a wide range of frequencies, but those showing a reasonable electrochemical behavior were selected as relevant in the construction of MS diagrams.
Experimental results are resumed in Table 3. It can be observed that the donor density (Nd) decrease as the temperature increases. The comparison between those experimental results listed in Table 1 are not parallel as expected in a simplified analysis, i.e. larger Nd values should imply an increase in the current output (Ilight).
The flatband potentials do not show a significant difference below 750˚C, but at this temperature a much higher value is measured.
The information presented in Table 3 can be correlated to the film thickness (w) of the space charge layer (SCL) as well as to structural changes on the TiO2. The film thickens of the SLC can be estimated by Equation (3), as proposed in the literature [12] , assuming that the SLC is fully depleted at high anodic potentials, where the layer behaves as a capacitor. This assumption allows us to correlate its capacity with the er of the TiO2.
 (3)
(3)
Vint is the potential in the erfase between the support and the TiO2. A rough estimation can be obtained is this value is assumed smaller than Vint, as observed on other systems [14] .
The simplified expression leads to an approximate linear dependence between w and . Assuming that the geometric area of the photoelectrode is constant, the increase of the TiO2 films should be proportional to the relative increase of the TiO2 mass with the quenching temperature (see Table 3).
This proportionality between these variables allows us to estimate the dielectric constant of the film, assuming that the natural thickness of the film is of the order 10 - 20 nm. Therefore, taking a value of 15 nm, an applying the Equation (3) assuming that , a value of er = 230 is obtained. Weber et al. [13] reported values of 300 - 1000 for εr in defect-doped TiO2. In Table 3 are shown the estimated values of the film thickness. It can
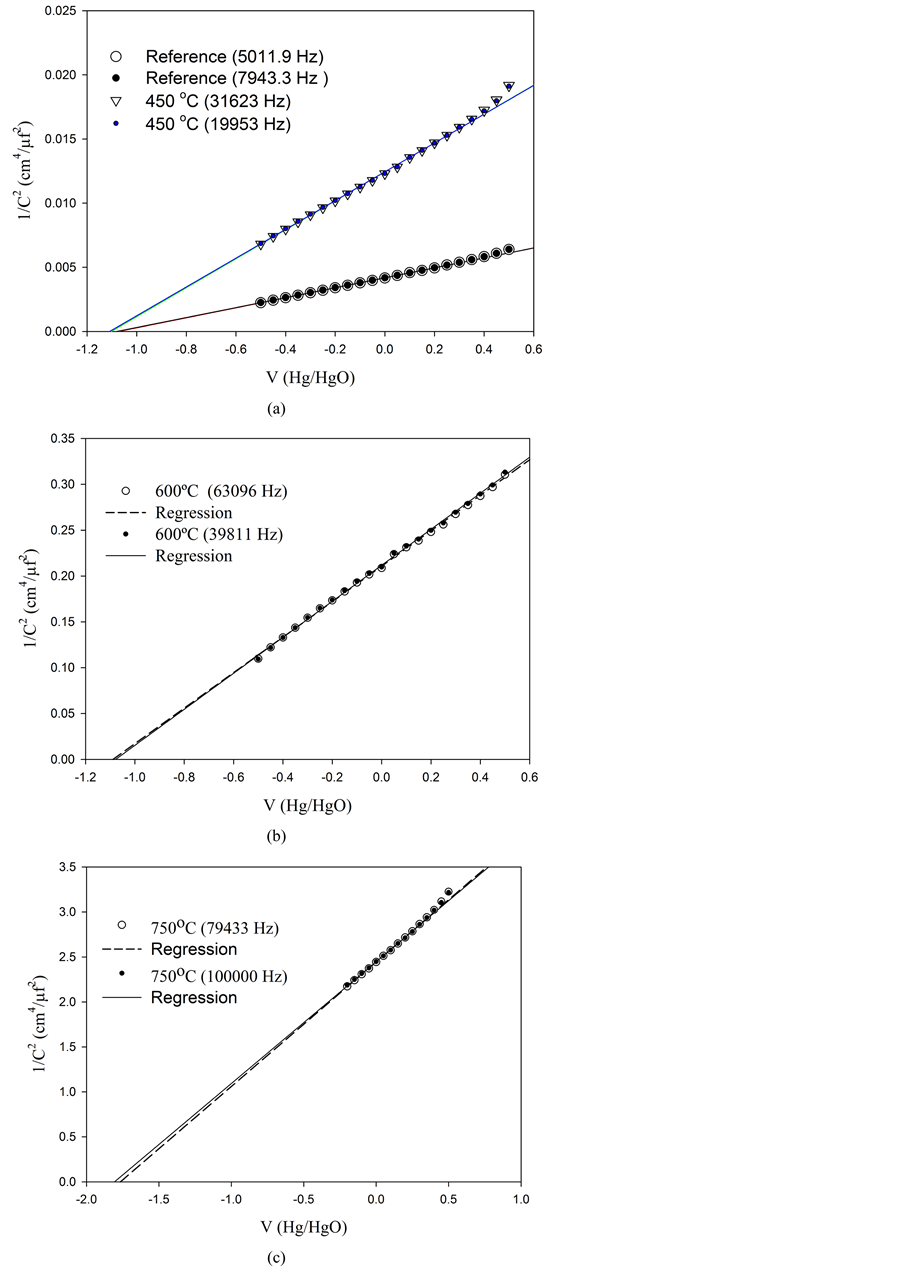
Figure 3. Mott-Schottky plots obtained at different temperatures and frequencies: (a) reference at 25˚C and at 450˚C, (b) at 600˚C, and (c) at 750˚C. The lines were obtained by lineal regression. The frequencies are given in brackets.
Table 3. Donor density (Nd) and flatband potential (Vfb) measured in the studied samples. The thickness of SCL of the film is estimated as described in the text.
be seen that the donor density decreases with the thickness as observed in by R. van de Krol et al., [15] . The donor density behaves in a similar way as the value reported by Spagnol et al. working on TiO2 nanotubes (on stainless steel) i.e., at 145 nm, a value of Nd = 1.4 × 1018 cm−3 is reported.
Studies performed on films of anatase on indium-tin oxide showed that the donor density decreases with the thickness. Values of 2.9 × 10¹⁹, 7.9 × 10¹⁸ and 4.1 × 1016 cm−3 have been evaluated for thickness of 40, 80 and 120 nm respectively (See reference [15] ), employing a dielectric constant of 55 for anatase.
4. Conclusions
Photoelectrodes of Ti/TiO2 prepared by thermal treatment at different temperatures and at different time of heating (450˚C, 600˚C, 750˚C and 900˚C) show different behavior in darkness and under light illumination. The photoactivity of the semiconductor measured by the charge transfer resistance, the flatband potential and the number of charge carriers are also temperature dependent as well as the temperature and the heating time at a given temperature.
Under the present experimental conditions, the electrodes prepared at 750˚C showed the best photoresponse under irradiation, which could be applied in the design photoelectrochemical devices in PEC.
Acknowledgements
The authors thank the support by grants from the National Agency of Science and Technology (ANPCyT-PICT 01482/06), CONICET (PIP 157/08) and UNLP (11-X486) as well as to Ing. L. Gassa for employing of the equipments in her laboratory, Dr. Ricardo Tucceri for the critical comments on the manuscript and Lic Dario Scolari for his assistance on the computational software. MP is member of Comisión de Investigaciones de la Provincia de Buenos Aires and ALC is member of CONICET.
Cite this paper
Marcos M.Pedemonte,Alberto L.Capparelli, (2015) Physicochemical Characterization of Photoelectrodes of Ti/TiO2 Prepared by Thermal Oxidation of Titanium. Energy and Power Engineering,07,403-411. doi: 10.4236/epe.2015.79038
References
- 1. Nowotny, J., Sorrell, C.C., Sheppard, L.R. and Bak, T. (2005) Solar-Hydrogen: Environmentally Safe Fuel for the Future. International Journal of Hydrogen Energy, 30, 521-544.
http://dx.doi.org/10.1016/j.ijhydene.2004.06.012 - 2. Halme, J. (2002) Dye-Sensitized Nanostructured and Organic Photovoltaic Cells: Technical Review and Preliminary Tests. M.Sc. Thesis, Helsinki University of Technology, Espoo.
- 3. Pouilleau, J., Devilliers, D., Garrido, F., Durand-Vidal, S. and Mahé, E. (1997) Structure and Composition of Passive Titanium Oxide Films. Materials Science and Engineering, B47, 235-243.
http://dx.doi.org/10.1016/S0921-5107(97)00043-3 - 4. Gemelli, E. and Camargo, N.H.A. (2007) Oxidation Kinetics of Commercially Pure Titanium. Revista Materia, 12, 525-531.
http://dx.doi.org/10.1590/S1517-70762007000300014 - 5. Pedemonte, M.M., Visintin, A. and Capparelli, A.L. (2010) Study of a Photostable Thin Films of TiO2 on Titanium. International Journal of Hydrogen Energy, 35, 6069-6073.
http://dx.doi.org/10.1016/j.ijhydene.2009.12.067 - 6. Akikusa, J. and Khan, S. (1997) Photorespose and AC Impedance Characterizarion of n-TiO2 Films during Hydrogen and Oxygen Evolution Reactions in an Electrochemical Cell. International Journal of Hydrogen Energy, 22, 875-882.
http://dx.doi.org/10.1016/S0360-3199(96)00235-2 - 7. Barsoukov, E. and Ross Macdonald, J. (2005) Impedance Spectroscopy. Emphasizing Solid Materials and Systems. 2nd Edition, John Wiley & Sons, Inc., Hoboken.
- 8. Radecka, M., Rekas, M., Trenczek-Zajac, A. and Zakrzewska, K. (2008) Importance of the Band Gap Energy and Flat Band Potential for Application of Modified TiO2 Photoanodes in Water Photolysis. Journal of Power Sources, 181, 46-55.
http://dx.doi.org/10.1016/j.jpowsour.2007.10.082 - 9. Gomes, W.P. and Vanmaekelbergh, D. (1996) Impedance Spectroscopy at Semiconductor Electrodes: Review and Recent Developments. Electrochimica Acta, 41, 967-973.
http://dx.doi.org/10.1016/0013-4686(95)00427-0 - 10. Radecka, M. (2004) TiO2 for Photoelectrolytic Decomposition of Water. Thin Solid Films, 451-452, 98-104.
http://dx.doi.org/10.1016/j.tsf.2003.11.061 - 11. Finklea, H.O., Ed. (1988) Semiconductor Electrodes. Elsevier, Amsterdam.
- 12. Bard, A.J. and Faulkner, L.R. (2001) Electrochemical Methods. 2nd Edition, John Wiley & Sons, Hoboken.
- 13. Weber, M.F., Schumacher, L.C. and Dignam, M.J.J. (1982) Effect of Hydrogen on the Dielectric and Photoelectrochemical Properties of Sputtered TiO2 Films. Journal of the Electrochemical Society, 129, 2022-2028.
http://dx.doi.org/10.1149/1.2124343 - 14. Spagnol, V., Sutter, E., Debiemme-Chouvy, C., Cachet, H. and Baroux, B. (2009) EIS Study of Photo-Induced Modifications of Nano-Columnar TiO2 Films. Electrochimica Acta, 54, 1228-1232.
http://dx.doi.org/10.1016/j.electacta.2008.08.070 - 15. van de Krol, R., Goossens, A. and Schoonman, J. (1997) Mott-Schottky Analysis of Nanometer-Scale Thin-Film Anatase TiO2. Journal of the Electrochemical Society, 144, 1723-1726.
http://dx.doi.org/10.1149/1.1837668
NOTES

*Corresponding author.