Green and Sustainable Chemistry
Vol.2 No.3(2012), Article ID:21744,6 pages 21744"> DOI:10.4236/gsc.2012.23017
Investigation of a Simple and Cheap Source of a Natural Indicator for Acid-Base Titration: Effects of System Conditions on Natural Indicators
1Department of Chemistry, College of Arts and Sciences, Tuskegee University, Tuskegee, USA
2Department of Applied Chemistry and Biochemistry, University for Development Studies, Navrongo, Ghana
Email: abugrigh@yahoo.com
Received May 28, 2012; revised June 26, 2012; accepted July 2, 2012
Keywords: Waakye Leaves; Ethanol; Natural Indicator; Acid-Base Titration; Dyes
ABSTRACT
This study investigated a natural indicator for acid-base titration which is extracted from guinea corn leaves popularly called “waakye leaves” in Ghana. Four types of acid-base titration were studied: strong acid versus (v/s) strong base, strong acid versus weak base, weak acid versus strong base, and weak acid versus weak base. The indicator color change, pH range and the average titre values were determined for each type of acid-base titration. These values were comparable to those obtained from three standard indicators: methyl orange, methyl red and phenolphthalein. Total flavonoids (TF) and condensed tannin (CT) from the crude leaves extract were determined which might be the major reasons for the activity of the extract as an indicator for simple acid-base titration. The authors suggest that the natural indicator is cheap, available, simple to extract, user and environmentally friendly and could be an excellent replacement for standard indicators.
1. Introduction
Commercial indicators are expensive and some of them have toxic effects on users and can also cause environmental pollution [1-3]. For these reasons there has been an increasing interest in searching for alternative sources of indicators from natural origins. These alternatives would be cheaper, more available, simple to extract, less toxic to users and environmentally friendly. Volumetric analysis is one of the key quantitative techniques used to analytically determine both inorganic and organic acid interaction with strong or weak acids and bases in raw materials, intermediates and finished products for quality assurance purposes [1]. This is accomplished via the use of appropriate weak organic dyes or acids pH indicators. Most pH indicators are either weak organic acids or bases dyes which accept or donate electrons. The change in color at a marginal range is attributed to their acidity or basicity properties. Although there are automated titration apparatus that determine the equivalent points between reacting species, indicators are still needed for teaching and research laboratories for simple titration [1]. Natural indicators have been extracted from Hibiscus (red species), Bougainvillea and rose flowers [1]. Several authors have reported on the effectiveness of natural indicators in acid-base titrations e.g. Nerium odorumThespesia populnea extract used as indicators [3]; Morus alba linn fruit extract indicator [2] and Ixora coccinea, Datura stramonium, Sun flower (Helianthus annus), pride of Barbados (Caesalpinia pulcherrima) and rail creeper (Ipomoea palmate) flower petal extracts [1]. The natural indicator sources investigated in these papers have been extracted and prepared using ethanol, water, or methanol [1-3].
Waakye leaves are obtained from Guinea corn which is cultivated mostly in African countries and other parts of the world. The plant is listed as the fourth major world cereal crop base on its production and is also considered as staple food in semi-arid tropics [4]. The leaves are considered as good dye sources for dying hats, hand bags and wallets in Ghana (Azumdo 2006 unpublished data) [5]. Besides the above very important aspect of the leaves, they have been reported to contain essential fatty acids and important bioactive compounds such as lycopene, beta-carotene, phenolics, chlorophyll a and chlorophyll b, condensed tannins and flavonoids [5]. On a previous study carried out by Azumdo 2006 (Unpublished data), dyes were extracted from the guinea corn leaves and used for titration. However, the data was not consistent and little is known about whether the dyes could react well with all types of reacting species (strong bases versus strong acids and or weak acids versus strong base or the vice versa or weak acids versus weak bases). Also no evidence is available with regards to the pH ranges of the indicator, its optimum function and its possibilities of replacing some expensive commercial indicators. In this present study, we further investigated the potentials of using waakye leaves (Guninea Corn red leaves) with ethanol extract as a source of natural indicator for simple acid-base titration. The outcome of the study could promote the use of the guinea corn leaves as a raw material for industrial production of chemicals such as indicators, pH papers, dyes and other potential products for foreign exchange. Unlike some commercial indicators that are known to have detrimental effects, we anticipate that indicators from natural sources could reduce both environmental pollution and the toxic effect on users. This will also encourage the cultivation of the crop in large scale for multipurpose uses.
2. Materials and Methods
The chemicals and materials used for the study include; High Performance Liquid Chromatography (HPLC) grade ethanol, sodium hydroxide (NaOH), hydrochloric acid (HCl), acetic acid (CH3COOH), sodium bicarbonate (NaHCO3), methyl red, phenolphthalein, methyl orange of the American Chemical Society (ACS) grade, waakye leaves extract and Whatman No. 4 filter papers. The following apparatus such as; volumetric flasks (100 mL, 500 mL and 1000 mL), conical flask with volume size of 125 mL, burette of 50 mL, and graduated measuring cylinders of volume size 10, 20, 25 and 100 mL were used to carried out the experiment.
2"> 2.1. Sample Collection and Preparation of Indicator Solution
The plant materials (leaves) were purchased from an African market in Columbus, Georgia, USA and then ground into powdered form. The powder was sieved into an amber bottle and stored away from direct sun-light to prevent photolysis and decomposition.
The natural indicator extract was prepared by weighing approximately 1.01 g of a powdered sample leaves into a Pyrex culture test tube (20 × 250 mm) and 25.0 mL of ethanol (99.9%) added. The mixture was vortexed for 5 minutes at ambient temperature (25˚C) and then filtered using Whatman No. 4 filter paper into a new culture test tube of the same size, capped with a Teflon cap and store for use on the same day.
2"> 2.2. Experimental Procedure
2.2.1. Experiment with Natural Indicators
Approximately 15.0 mL of 0.1 M HCl or 0.1 M CH3COOH was titrated with 2.2 M NaOH using the natural indicator extracted from the waakye leaves in the order of strong acid versus strong base and weak acid versus strong base respectively, and then 5.0 mL of 0.1 M HCl or 0.1 M CH3COOH was also titrated against the weak base 0.1 M NaHCO3 in the order of (HCl v/s NaHCO3, CH3COOH v/s NaHCO3). Three drops of the extracted indicator were added to each volume of acid used for the titration. The experiment was conducted in triplicate at some cases and replicates of five (5) as indicated in 2" target="_self">Table 2. The acidbase titration was carried out at room temperature.
2.2.2. Experiment with Commercial Indicators
For comparison, the procedure used for the commercial indicators (standard indicators) was the same as described above for the natural indicators. The experiment was conducted in triplicate and replication of five (5) and the results were analyzed with simple Microsoft excel 2010 and SPSS statistical software. The statistics generated were used to discuss the results.
2.2.3. Determination of Total Flavonoids (TF)
TF was determined by a colourimetric method as described in [6-8] with slight modification. Briefly, 250 µL of sample was mixed with 1.25 mL of deionized water and 75 µL of a 5% NaNO2 solution. After 6 min, 150 µL of a 10% AlCl3·6H2O solution was added to the mixture. The mixture was incubated at room temperature for 5 minutes, and then 0.5 mL of 1 M NaOH and 2.5 mL of deionized water were added. The mixture was then thoroughly vortexed and the absorbance of the light pink color was measured at 510 nm against the blank using Perkier Elmer 8454 UV-Visible spectrophotometer. A blank solution prepared with ethanol replacing the guinea corn leaves extract. Results were expressed as absorbance per 1.0 g amount of extract dry weight (DW). All experiments were carried out using eight (8) replicates.
2.2.4. Determination of Condensed Tannin (CT)
CT content in sorghum bicolor crude extract was determined using a colourimetric method as described in [9, 10], with slight modification. A 1.0 mL of sample solution, 5.0 mL of vanillin/HCl reagent (0.5 g villain in 4% methanol plus 1.5 mL HCl solution (v/v)) was added. After mixing well, the mixture was allowed to stand for 20 minutes at room temperature in darkness. Absorbance was measured against the blank reagent at 500 nm using Perkier Elmer 8454 UV-Visible spectrophotometer. A blank solution prepared with ethanol replacing the guinea corn leaves extract. Results were expressed as absorbance per 1.0 g amount of extract dry weight (DW). All experiments were carried out in replication of eight.
3. Results and Discussion
pH Range of Indicators: The results of the titre values obtained using the natural indicator and the standard indicators are presented in Table 2. It was observed that the natural indicator (waakye leaves extracts) when added to the acid produced a sharp yellow color as indicated in Table 1 and in Figure 1. For the strong acid the pH range was between 1.0 (acidic) to 12.0 (alkaline) after titration, whereas for the weak acid the pH was observed to be around 4.0 to 12.0 with exception in the case of a weak acid versus weak base as indicated in Table 1. The possible factors that might have contributed to the pattern of the pH variation as well as titre value could be temperature, ionic strength, colloidal particles and organic solvents [11]. Another reason could be the chemical composition of the natural indicators. Flavonoids and tannins have the capacity to produce sharp color changes at certain pH ranges as compared to non-flavonoid and tannins derivatives because of the functional groups (e.g. OH) in flavonoids and tannins.
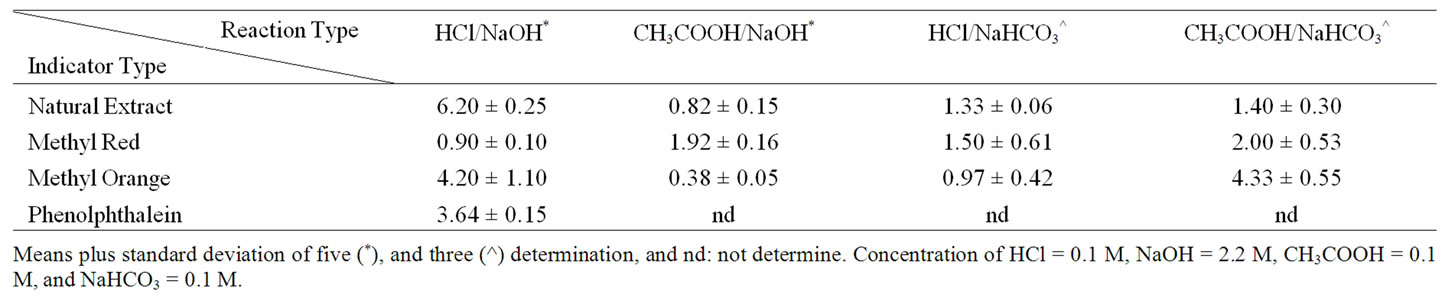
Equivalent Points: The average titre values obtained for the extract was comparable to methyl orange and phenolphthalein indicator used as indicated in 2" target="_self">Table 2. However, the waakye extract average titre volume was higher compared to methyl red in a strong acid versus strong base. It was interesting to observe that for the weak acid versus strong base the titre values were similar between the methyl red, waakye extract and methyl orange. A similar trend was found in strong acid versus weak base. For weak acid versus weak base the methyl red were quite comparative to the natural indicator extract, however methyl orange was way higher by a factor of 3 than the natural extracted indicator as presented in 2" target="_self">Table 2. The anomalies are also attributed to the mole strength as indicated in Table 3. For instance, generally, the sharply increasing pH during titration must surpass 2 pH units for an indicator to function accurately [13]. This however, hinders any smallest concentration of a strong acid (HCl) which could be titrated to approximately 5.0 × 10⁻⁴ M. It is therefore, prudent to use a concentrated base but the challenges are that the volume of the base must be accurately measured in a titration process to avoid a large margin of error [13]. It is therefore, anticipated that for instance, if a volume of 25 mL of 5.0 × 10⁻⁴ M HCl will need only about 0.125 mL of 0.1 M NaOH solution to obtain an equivalent point, then the relative error expected in delivering such a small volume with an ordinary burette will be reasonably large [13]. This could have happened with the methyl red indicator.
2-110c-4568-84eb-7ee3c521a606.jpg" width="914.755023193359" height="232.75 " />
Table 1. Physical and chemical parameters of the indicators used for titration.
 23193359" height="188.86000289917 " />
2" target="_self">Table 2. Mean volume (in mL) of base used to reach the equivalent point of acid-base titrations.
29f6-432e-8a89-4282ed78cfff.jpg" width="913.70998840332" height="184.775 " />
Table 3. Comparison of moles of Acid used versus moles of Base used to reach an equivalent point in acid-base titrations.
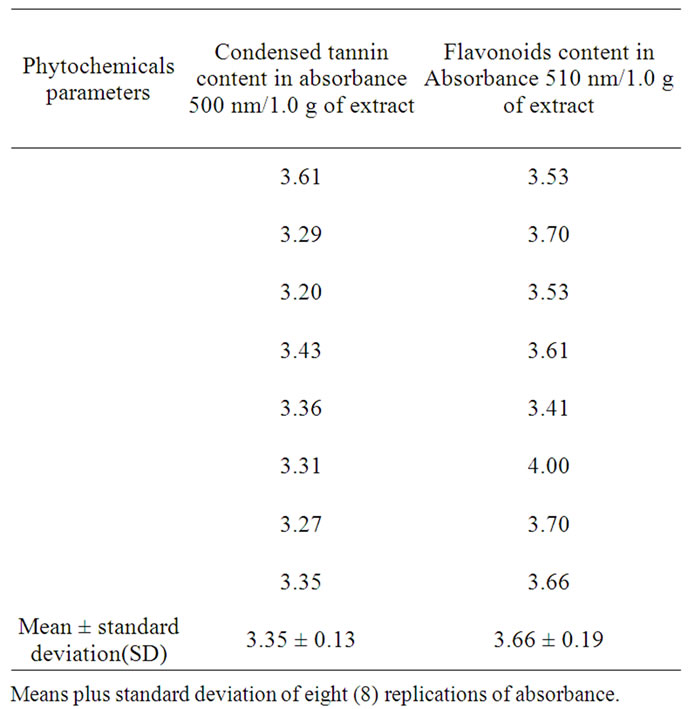
The trend of the results agreed with other findings in Hibiscus plant leaves, flowers, and petals [1-4,12]. Other different sorghum leaves preliminary studied by (Azumdo 2006 unpublished data) also depicted similar trends. The variation in the equivalent point is attributed partly to the presence of flavonoids, condensed tannins which gave high absorbance at 500 and 510 nm indicated in Table 4, and also because of the presence of phenolic and chlorophylls reported by [5]. It could also be argued that the ratio of the reacting species and the mole strength as well as other side reacting functional groups might have been found in the natural indicator extracted resulting in the variation of the pH and the titre values obtained. Since there is no speciation analysis of the individual compounds yet on the composition of the indicator much cannot be emphasized. Although there have reported that flowers extract from Delonix regia Raf. and Caesalpina pulcherrima Swartz obs were found to possess polyphenolic, flavonoids, anthocyanins and also been pH sensitive and therefore yielded sharp end points with sharp color change at the equivalence points [14]. Our studies with the natural indicator was also sensitive to pH and also show a sharp pink color change at equivalent point and light yellow at acid region Figure 1 and 2.
2d5-e523c3b3a1e4.jpg" width="438.99500579834" height="207.19500579834 " />
Figure 1. Acid (HCl or CH3COOH) solution plus three drops of natural indicator (waakye leaves extract). Color change was yellow.
28c15a-008f-470f-9589-5938b3e1fea5.jpg" width="437.95" height="255.26501159668 " />
Figure 2. Acid (HCl or CH3COOH) solution plus three drops of natural indicator (waakye leaves extract) at equivalent point with base (NaOH or NaHCO3) showing a sharp color change to be light pink.
A T-test analysis results are presented in Table 5. The statistics indicated at 95% confidence level (CL) that the indicators gave endpoints which had significantly departed from the stoichiometric end point (true mole ratio). The natural indicator (NI), methyl red (MR), and methyl orange (MO) gave mole ratios (at the observed endpoints) which were less than the true mole ratio for CH3COOH/ NaOH system. This shows that the indicators suggest endpoints earlier than expected theoretically.
A similar observation was noted for the system HCl/ NaOH using NI, MR, MO, and phenolphthalein (PH) indicators. However, for CH3COOH/NaHCO3 system, confidence levels (CL) greater than zero for NI and MR indicators were noted which indicated that they gave higher mole ratios compared to the true mole ratio. For the same system however, CL < 0 was noted for MO, indicating that the mole ratio was lower than expected. In the case of HCl/NaHCO3 system, NI, MR, and MO gave significantly higher mole ratios (26e413.jpg" width="64.3149971008301" height="22.4200003623962 " />as shown in Table 5.
The observed phenomenon of overestimation and underestimation of endpoint by all the indicators may be related to several factors but we wish to simply indicate in this study that the natural indicator under study behaves much the same as the commercial indicators. In addition, the data shows that NI gave comparable estimates of the endpoint in relation to the commercial indicators. Therefore determination of the indicator-compound in the plant extract is vital to enable an effective chemical assessment of its indicator properties versus its chemical properties.
 2 " />
Table 4. Condensed tannins and flavonoids absorbance reported per 1.0 g of extract using ethanol.
2116-4603-a1e7-81e8c0214598.jpg" width="437.95" height="283.76501159668 " />
28e9b66.jpg" width="437.95" height="363.47000579834 " />
Table 5. T-test of theoretical mole ratio.
Indicators and the Neutralization Process: The following chemical equations; Equations (1)-(4) were considered to be the reactions which proceed during the neutralization process, in the presence of the visual indicators at 25˚C. The mole ratios of the stoichiometric equations were taken as the true mole ratio (with a value of 1.0). This was compared with the experimentally determined mole ratios by deductions from the titre values.
Indicator organic, 25˚C
HCl + NaOH 25cd-cb2c-46c4-84fc-3837693ae5ad.jpg" width="42.844998550415" height="19.3799996376038 " /> NaCl + H2O (1)
Indicator organic, 25˚C
HCl + NaHCO3 265-91eb-1d528b01cd8c.jpg" width="42.844998550415" height="19.3799996376038 " /> NaCl + CO2 + H2O (2)
Indicator organic, 25˚C
CH3COOH + NaOH 2cd5a1-3ef4-4f60-a6dc-879d85166218.jpg" width="42.844998550415" height="19.3799996376038 " /> CH3COONa + H2O (3)
Indicator organic, 25˚C
CH3COOH + NaHCO3 2b-9671-efa92bd1bb84.jpg" width="42.844998550415" height="19.3799996376038 " /> CH3COONa + CO2 + H2O (4)
4. Conclusion
The current paper suggests that natural indicators should be exploited to prevent toxicity among users and pollution of the environment. It is also evident that the leaves when prepared as commercial indicators will serve as a source of economic gains to farmers and countries producing the crop. Also in conclusion, the study depicts that standard indicators can be successfully substituted with waakye leaves extract (natural indicator) for simple acid-base titration.
REFERENCES
- F. O. Nwosu, F. A. Adekola and K. C. Ihedioha, “Simple Titrimetric Colour Indicators from Some Natural Flower Petals,” Centrepoint (Science Edition), Vol. 12, No. 1, 2004, pp. 74-89.
- K .S. Pathade, S. B. Patil, M. S. Konda-war, N. S. Naikwade and C. S. Magdum, “ Morus Alba Fruit-Herbal Alternative to Synthetic Acid Base Indicators,” International Journal of ChemTech Research, Vol. 1, No. 3, 2009, pp. 549-551.
- S. B. Patil, M. S. Kondawar, D. S. Ghod-ke, N. S. Naikwade and C. S. Magdum, “ Use of Flower Extracts as an Indicator in Acid-Base Titrations,” Research Journal of. Pharmacy and Technology, Vol. 2, No. 2, 2009, pp. 421- 422.
- I. S. Udachan, A. K. Sahoo and G. M. Hend, “ Extraction and Characterization of Sorghum (Sorghum bicolor L. Moench) Starch,” International Food Research Journal, Vol. 19, No. 1, 2012, pp. 15-319.
- D. A. Abugri, B. J. Tiimob, V. A. Apal-angya, G. Pritchett and W. H. McElhenney, “Bioactive and Nutritive Compounds in Sorghum Bicolor (Guinea Corn) Red Leaves and Their Health Implication,” Journal of Food Chemistry, 2012.
- N. Turkmen, F. Sari and Y. S. Velioglu, “Effects of Extraction Solvents on Concentration and Antioxidant Activity of Black and Black Mate Tea Polyphenols Determined by Ferrous Tartrate and Folin-Ciocalteu Methods,” Food Chemistry, Vol. 99, No. 4, 2006, pp. 835-841. 2005.08.034" target="_blank"> doi:10.1016/j.foodchem.2005.08.034.
- B. J. Xu and S. K. C. Chang, “A Comparative Study on Phenolic Profiles and Antiox-Idant Activities of Legimes as Affected by Extraction Solvents,” Journal of Food Science, Vol. 72, No. 2, 2007, pp. S159-S166. 2006.00260.xPMid:17995858"> doi:10.1111/j.1750-3841.2006.00260.xPMid:17995858
- H. S. Yim, F. Y. Chye, S. K. Ho and C. W. Ho, “Phenolic Profiles of Selected Edible Wild Mushrooms are Affected by Extraction Solvent, Time and Temperature,” Asia Journal of Food Argo-Industry, Vol. 2, No. 3, 2009, pp. 392- 401.
- M. L. Price, S. Vanscoyoc and L. G. Butler, “A Critical Evaluation of the Vanillin Reaction as an Assay for Tannin in Sorghum Grain,” Journal of Agriculture and Food Chemistry, Vol. 26, No. 5, 1978, pp. 1214-1218. 21/jf60219a031" target="_blank">doi:10.1021/jf60219a031.
- U. D. Chavan, F. Shahidi and M. Naczk, “Extraction of Condensed Tannins from Beach Pea (Lathyrus maritimus L.) as Affected by Different Solvents,” Food Chemistry, Vol. 75, No. 4, 2001, pp. 509-512. 234-5" target="_blank">doi:10.1016/S0308-8146(01)00234-5.
- D. S. Skoog, D. M. West and F. J. Holler, “Analytical Chemistry: An Introduction,” 6th Edition, Saunders College Publishing, Philadelphia, 1994.
- V. C. Bhagat, R. D. Patil, P. R. Channekar, S. C. Shetty and A. S. Akarte, “ Herbal Indicators as a Substituent to Synthetic Indicators,” International Journal of Green Pharmacy, Vol. 2, No. 3, 2008, pp. 162-163. 258.42735" target="_blank">doi:10.4103/0973-8258.42735
- L. G. Hargis, “Analytical Chemistry: Principles and Techniques,” Prentice Hall International Editions, Upper Saddle River, 1988.
- S. Singh, S. B. Bothara, S. Singh, R. Patel and R. Ughreja, “Preliminary Pharmaceutical Characterization of Some Flowers as Natural Indicators,” The Pharma Research, Vol. 5, No. 2, 2011, pp. 213-220.
Journal Menu >>
- 2">2px; _font-size: 7px; padding: 0 5px 0 0">●Indexing
- 2">2px; _font-size: 7px; padding: 0 5px 0 0">●View Papers
- 2">2px; _font-size: 7px; padding: 0 5px 0 0">●Aims & Scope
- 2"> 2px; _font-size: 7px; padding: 0 5px 0 0">●Editorial Board
- 2">2px; _font-size: 7px; padding: 0 5px 0 0">●Guideline
- 2">2px; _font-size: 7px; padding: 0 5px 0 0">●Article Processing Charges
- 2px; _font-size: 7px; padding: 0 5px 0 0">●Paper Submission
- 2"> 2px; _font-size: 7px; padding: 0 5px 0 0">● GSC Subscription
- 2"> 2px; _font-size: 7px; padding: 0 5px 0 0">●Free Newsletter Subscription
- 2" target="_blank">2px; _font-size: 7px; padding: 0 5px 0 0"> ●Most popular papers in GSC
- 2"> 2px; _font-size: 7px; padding: 0 5px 0 0">●Publication Ethics Statement
- 2"> 2px; _font-size: 7px; padding: 0 5px 0 0">●About GSC News
- 2">2px; _font-size: 7px; padding: 0 5px 0 0">●Frequently Asked Questions